
Triple Net Lease REIT Update: Stronger Rent Collection And Lower Cap Rates
Summary
- Triple net lease REITs are positioned quite well for the current macro environment.
- Rent collections continue to improve throughout the sector. The only net lease REITs not posting higher rates for rent collections were already well over 90%.
- Lower Treasury yields drive lower capitalization rates on triple net lease properties (higher prices) and elevate triple net lease REIT prices.
- Top choices are still WPC and NNN. WPC benefits from owning industrial assets and diversification including Europe.
- NNN usually trades in tighter correlation with O. The current spread appears to be driven by consensus estimates for AFFO. The current estimates don’t reflect the usual correlation for O and NNN.
We’re checking on the triple net lease REITs again today. The main triple net lease REITs are:
- Realty Income (O)
- National Retail Properties (NNN)
- W.P. Carey (WPC)
- Agree Realty Corporation (ADC)
- STORE Capital (STOR)
- Spirit Realty Capital (SRC)
- VEREIT (VER)
- EPR Properties (EPR)
- Four Corners Property Trust (FCPT)
- Getty Realty Corp. (GTY)
When recessionary risks rise, we see Treasury yields falling. Because the triple net lease REITs lock in their expected revenue (long leases and high occupancy) for so many years, they can often trade closer to bonds. Investors value those recurring cash flows whether from dividends or from direct ownership of the property. For an investor buying real estate directly, they would be looking at the capitalization rate. When capitalization rates decline, property values increase. Currently the spread between Treasury rates and cap rates on triple net lease transactions is exceptionally large:
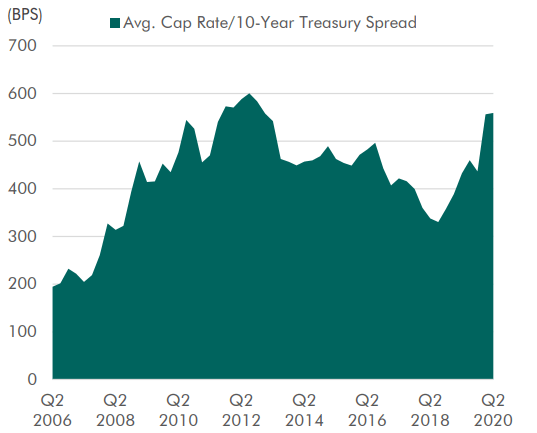
Source: CBRE
We expect those spreads to shrink. If Treasuries pay less than 1%, investors shouldn’t be able to get 5% to 6% on a good triple net lease REIT.
In essence, investors like the certainty a triple net lease REIT usually provides. In prior recessions, we often saw the triple net lease REITs dramatically beating the equity REIT sector:
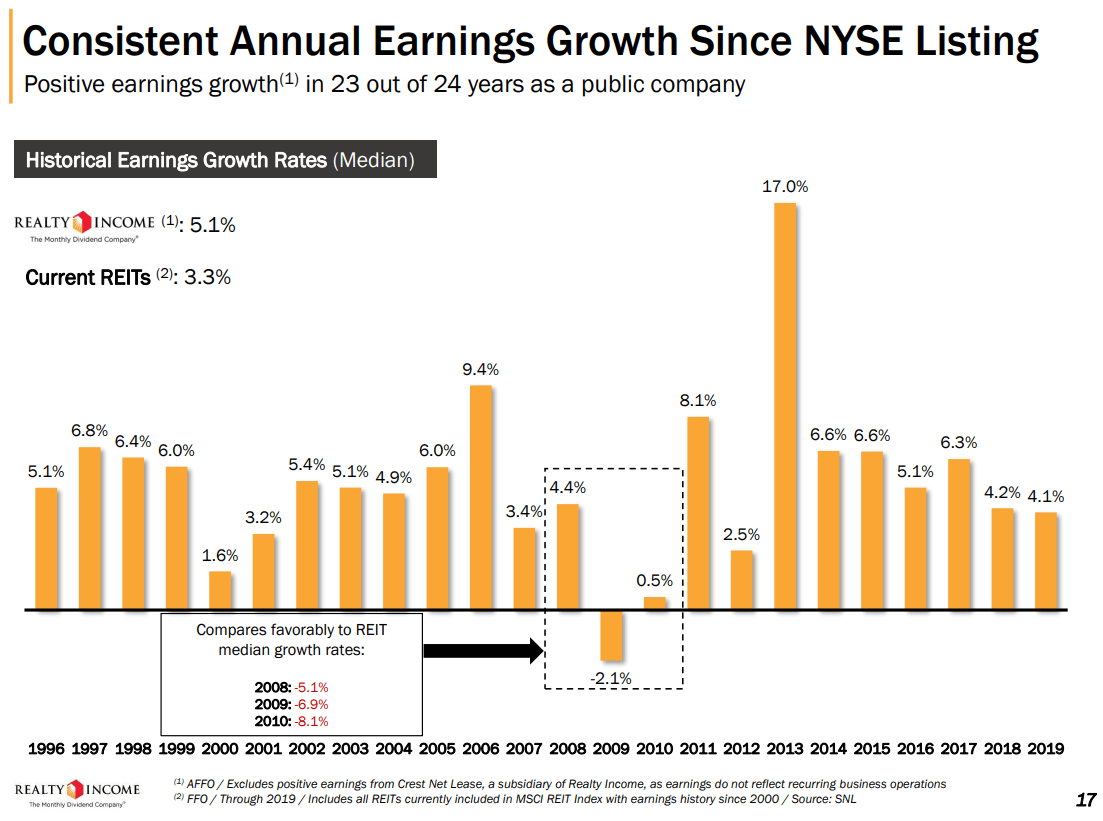
Source: Realty Income
Industrial Assets Are Great
Industrial assets weren’t always viewed as a great asset class. Industrial assets regularly traded at higher cap rates than retail assets until 2018. Now we’ve seen industrial properties trade at more aggressive cap rates:
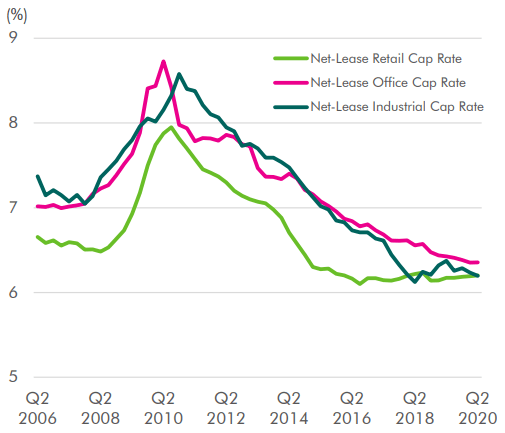
Source: CBRE
WPC has a substantial amount of industrial properties within their portfolio.
While those cap rates have continued to decline, remember that Treasury rates fell even faster. If Treasury rates remain this low, it would suggest that cap rates should fall further.
Industrial assets are also increasing as a percentage of net lease real estate transactions:
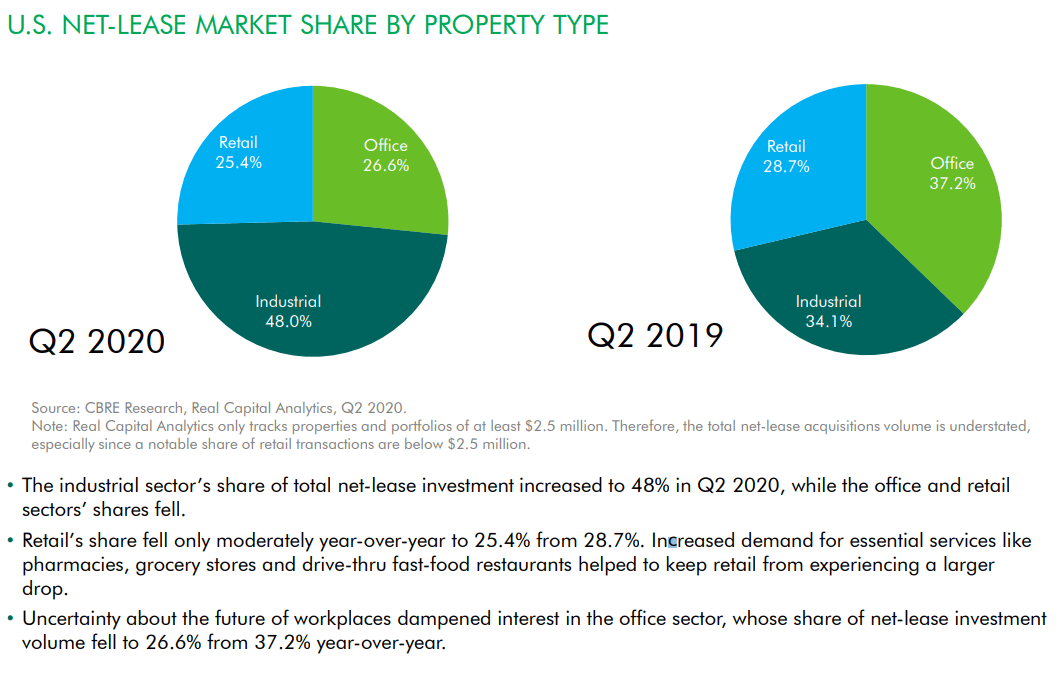
Source: CBRE
Yet the triple net lease REITs trade at relatively low multiples of AFFO per share and exceptionally wide spreads compared to Treasuries. So we need to look at the headwinds facing the sector
Non-essential Headwinds
What difficulties are triple net lease REITs having? The largest factor by a huge margin is non-essential customers who can’t (or don’t want to) pay rent as agreed upon. Some tenants are making much stronger efforts to pay than others. Clearly stronger rent collections would be positive, but a significant portion of the late rent is covered under deferral agreements.
So where are rent collections for these REITs over the last 4 months? The following chart breaks it down and includes August collections if they have been reported:
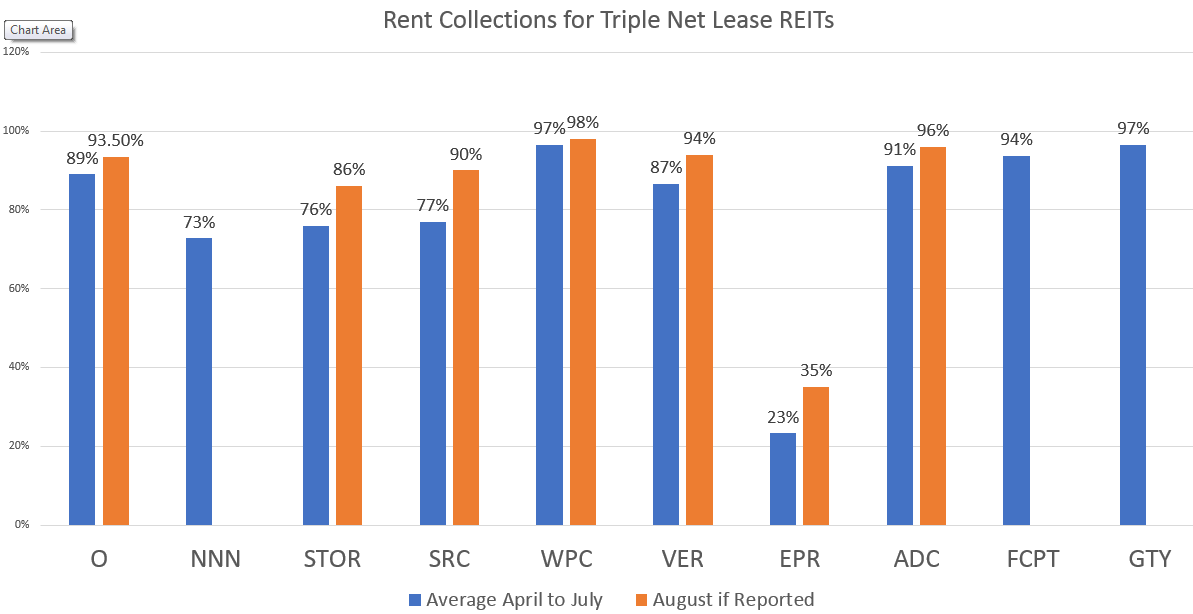
Source: The REIT Forum
Including EPR brings some clarity to the sector. While every REIT would like to be over 90%, EPR is suffering far more than peers from a lack of rent collection. Three of the REITs, NNN, FCPT, and GTY haven’t provided updates on rent collections for August. NNN regularly discloses on the earnings call that they don’t intend to provide monthly updates between calls, so investors shouldn’t read anything into it. FCPT and GTY appeared to provide less communication overall.
Overall, rent collections have been improving significantly since April and May:
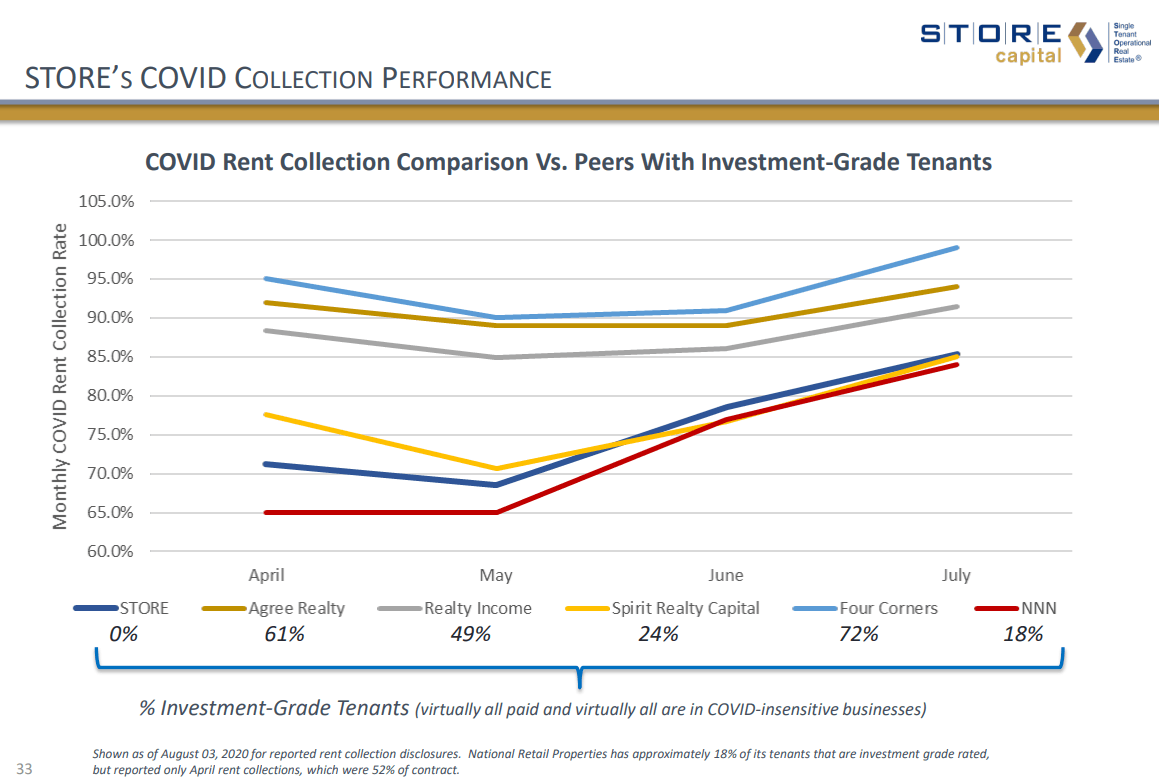
Source: STOR
Index Cards
Our top choices in the sector currently are WPC and NNN.
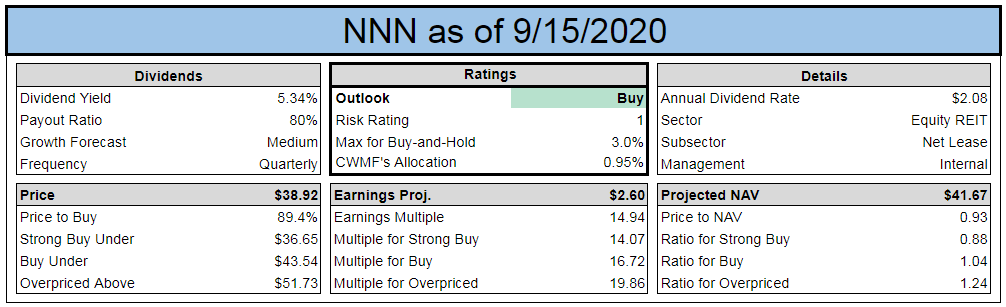
The index cards for our top picks are included below:
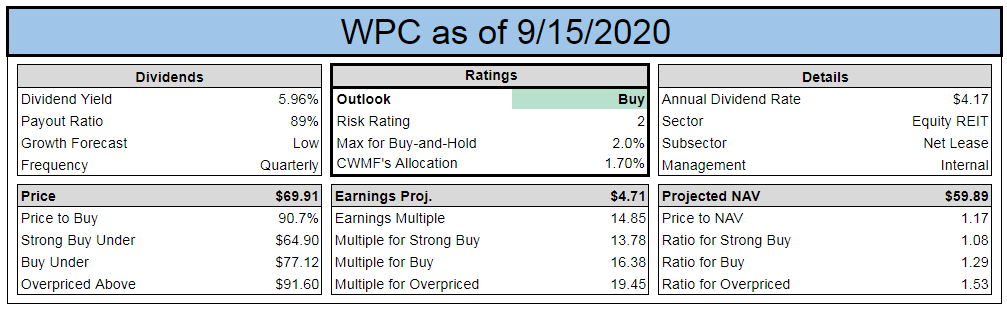
We like WPC for their exposure to industrial assets and diversification to European markets.
We like NNN for the unusually low valuation.
Comparing O and NNN Behind the Curtain
We want to touch on relative values for O and NNN. We’re going to take investors “behind the curtain” here on our process. This highlights why we think NNN is a better bargain today than O, but it is something few investors would ever guess.
Our “buy under” target for O is set at 16.85x estimated AFFO and our target for NNN is set at 16.75x estimated AFFO.
Historically, O has on average traded at a slightly higher multiple of AFFO:
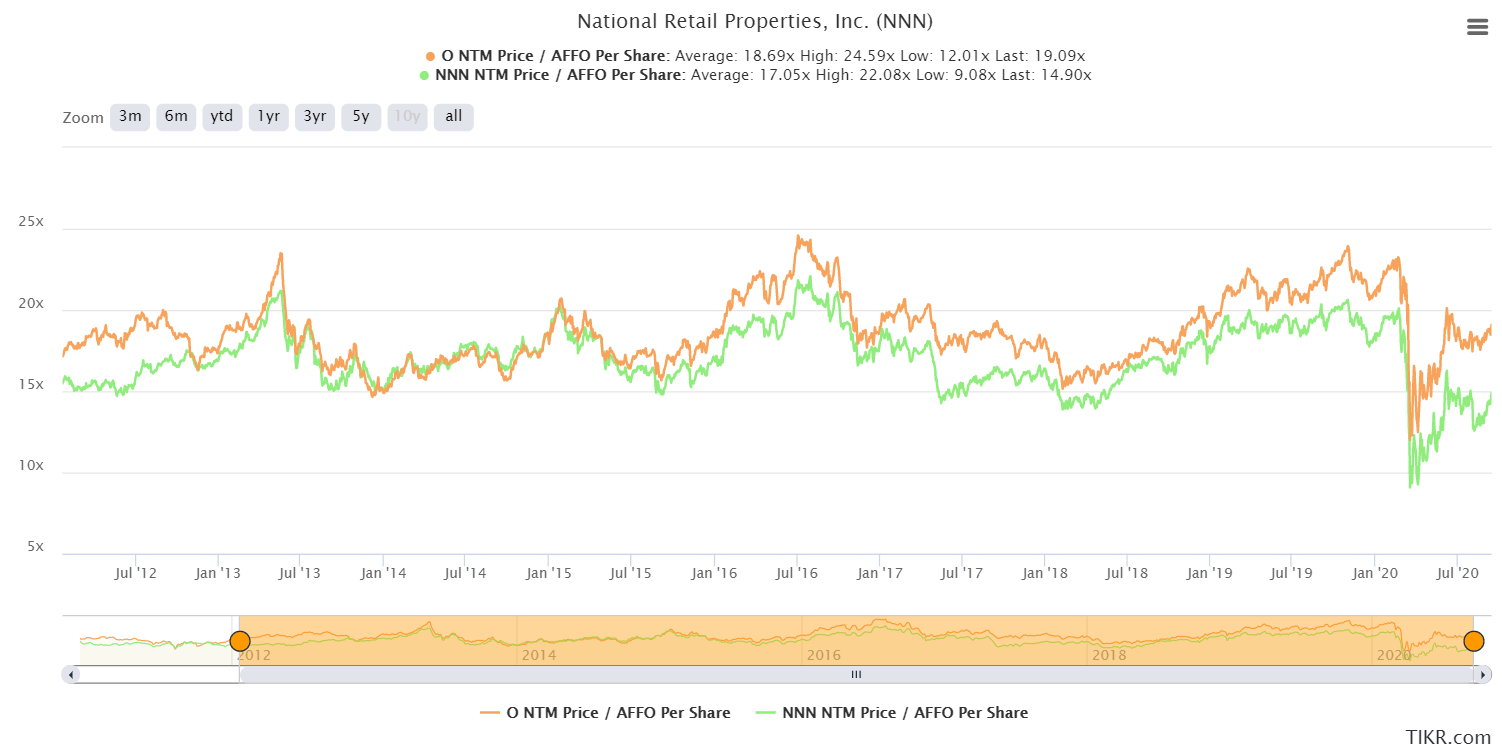
Source: TIKR.com
Sometimes the multiples were extremely close, other times O traded at a multiple that was up to about 3 turns higher (for instance, 19x to 16x). Today the spread is a little more than 4 (over 19x for O, just under 15x for NNN).
If O trades at a slightly higher multiple on average, why would our estimates put them at the same level? Because we don’t agree with the consensus estimate for the moment. AFFO per share can be influenced by changes in cash collections from one year to the next. Normally, this impact is pretty minor. However, we need to compare some estimates. We’re going to contrast the values between R/B AFFO (REITBase AFFO, which we consider the most accurate value) for 2019 and the forward estimate:
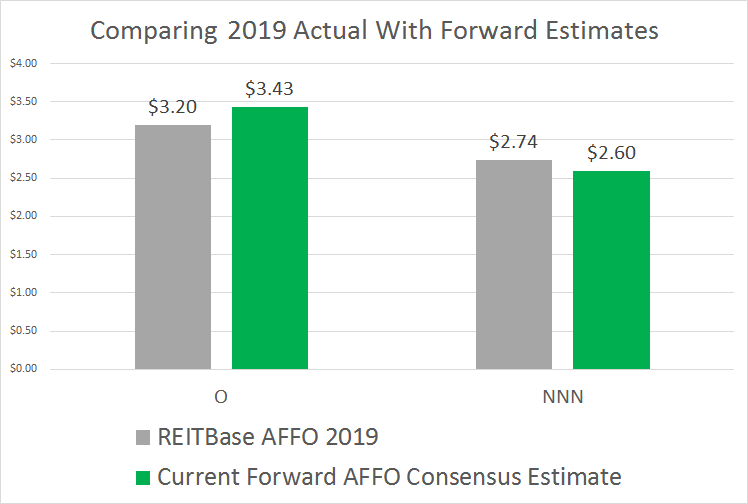
Source: Author Calculations with data from REITbase.com & TIKR.com
We find the calculations by REITBase for AFFO provide the most reliable and comparable values. Using those values, we believe the current forward estimates are including too many non-recurring impacts. It is unlikely that O would enjoy 7% growth while NNN saw a 5% decline. Historically, their growth rates have been very highly correlated.
If we evaluated our target prices as multiples of 2019 REITbase AFFO, then our targets would be 18.05x for O and 15.89x for NNN. We believe it is likely that over the next year or two the consensus estimates for NNN will grow more than the consensus estimates for O. Why? Because the current estimates appear optimistic for O and pessimistic for NNN.
Note: Historical multiples for WPC are less useful because they are moving away from managing non-traded REITs, which was boosting AFFO per share in prior periods.
Valuation Across The Sector
We have targets on O, NNN, STOR, SRC, WPC, and VER.
We don’t have targets on EPR, ADC, FCPT, or GTY.
When looking at the triple net lease REITs, many investors will look at the dividend yield or the AFFO yield. If you’re familiar with AFFO multiples, then AFFO yields are very easy. It is simply the other way of expressing the number. For instance, O trades at 19.32x projected AFFO or a 5.18% AFFO yield. You reach an AFFO yield the same way as a dividend yield. Divide the AFFO per share by the share price. The following chart is sorted from the lowest dividend yields to the highest:
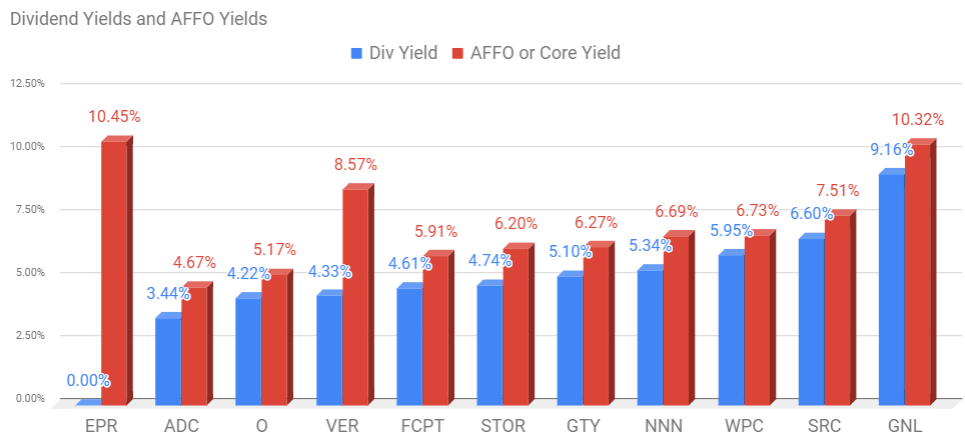
Source: The REIT Forum, Data from TIKR.com
Normally the REITs with lower dividend yields in a sector are the safer REITs, but the correlation isn’t strong here. EPR has no dividend and is one of the highest-risk REITs in the space. They have the most upside but also have the most downside. EPR’s latest updates were fairly positive, indicating smaller reductions in leasing rates than we expected.
We suggest caution in relying on AFFO multiples for EPR though. The consensus estimates have been all over the place:
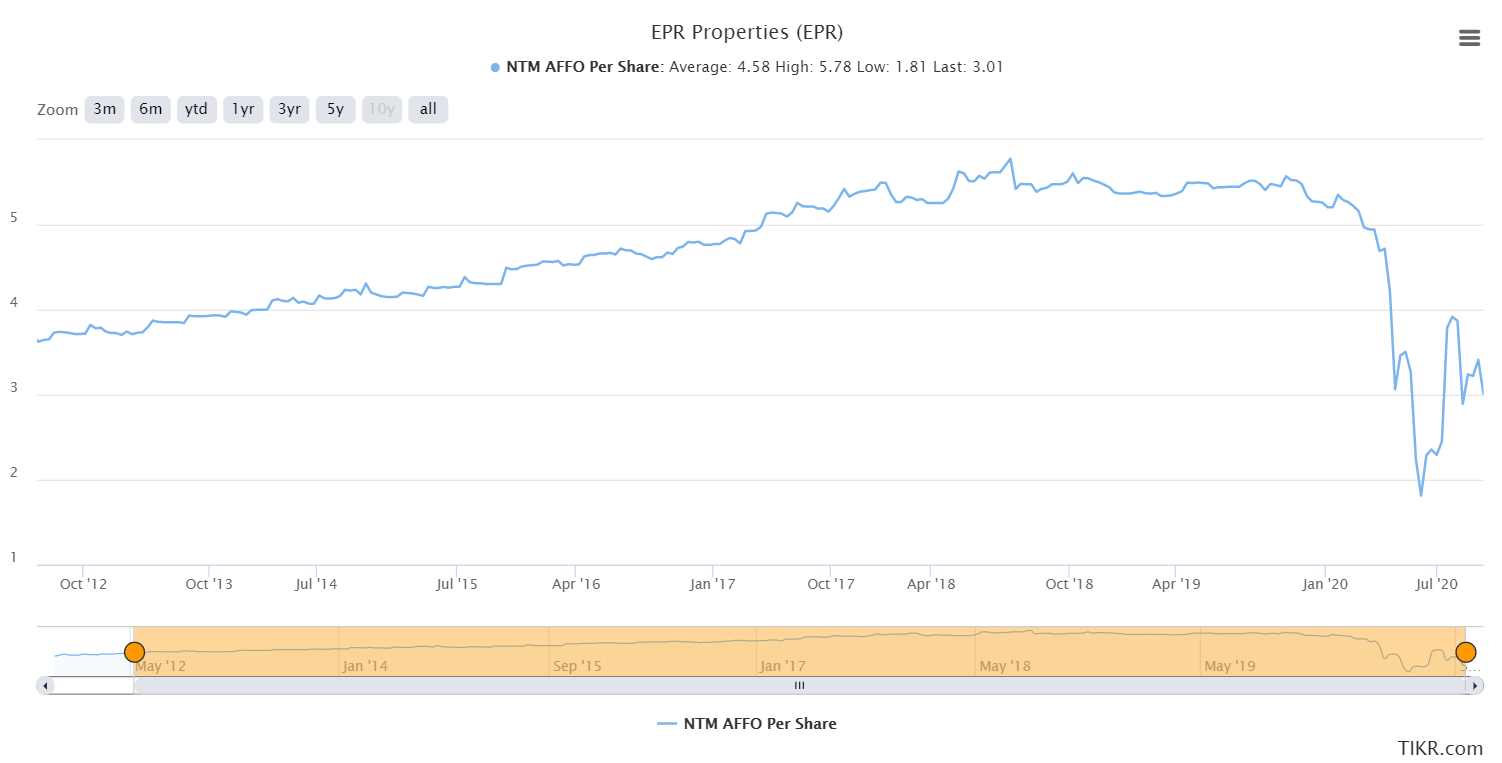
Source: TIKR.com
This could be a temporary dip caused by accounting treatment for leasing situations or it could signal more difficulty in the future. Either way, investors should simply be aware of the risks.
EPR was touted as a “top pick” and “safe high yield” by many analysts before it plunged.
Payout Ratios
Most of the payout ratios for the sector are in the 75% to 90% range:
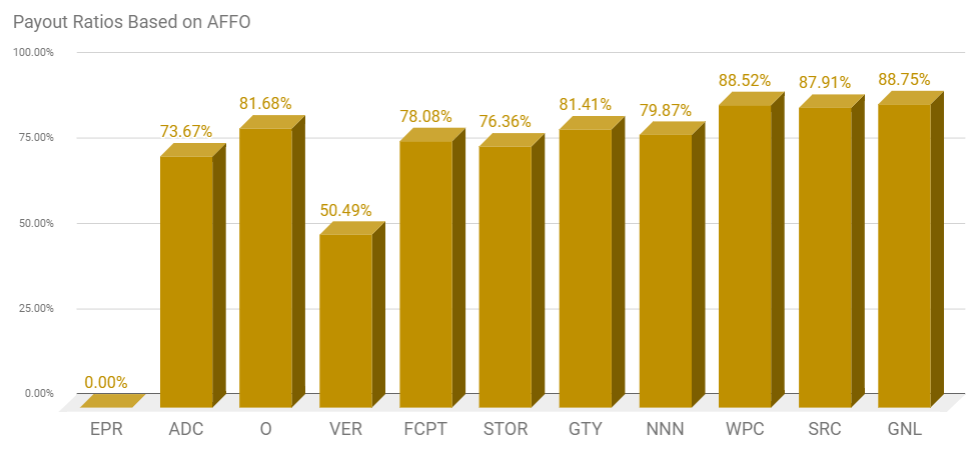
Source: The REIT Forum
Since the AFFO estimates have been very volatile, investors should put less weight on the payout ratio today than at most points in the past.
Price to NAV
Ratios of price to NAV (using average analyst estimate) show values in the range of .75 to 1.28:
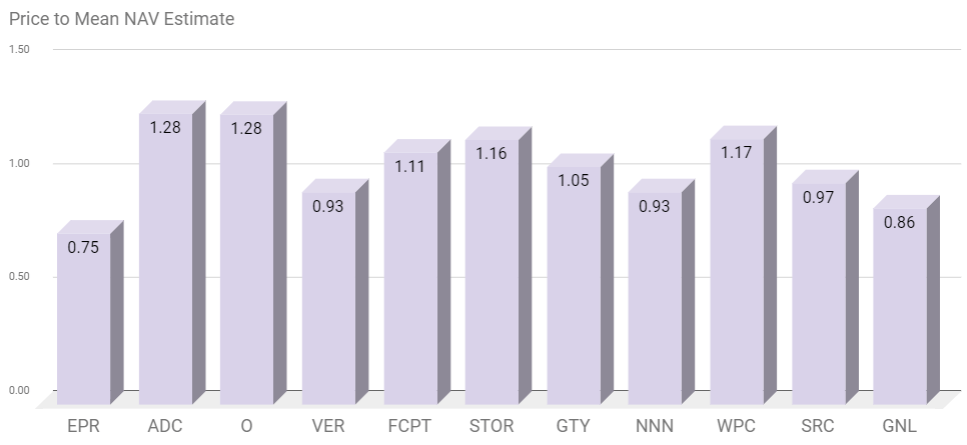
Source: The REIT Forum
Normally we would expect O to have the highest multiple. STOR is back to having a healthy premium. They had some of the highest volatility over the last year. WPC has a premium to NAV, but that is quite normal. NNN has occasionally traded at a premium, but also traded at discounts (though usually smaller than this):
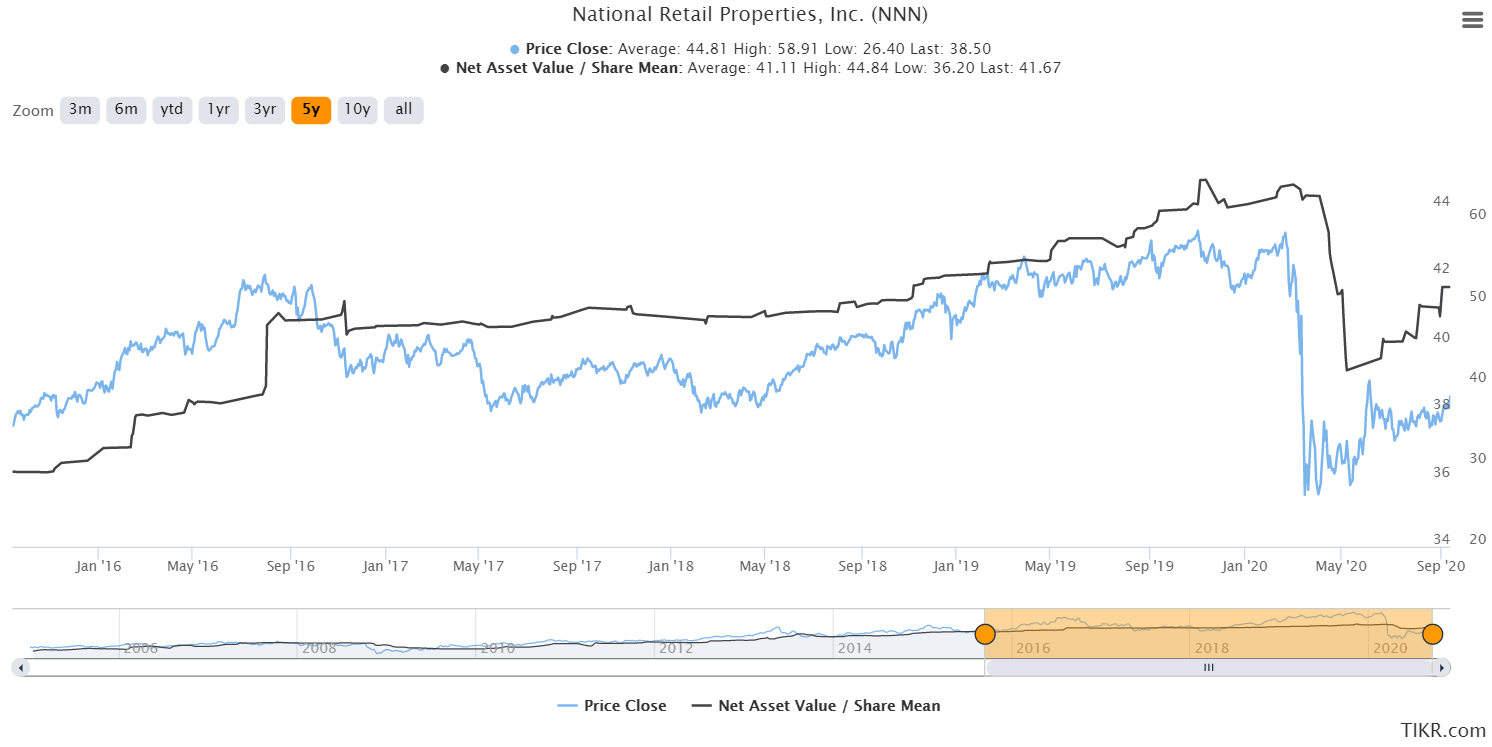
One thing we would highlight here is that share price tends to be moving ahead of the NAV estimates. That’s one of the risks in putting too much emphasis on NAV for equity REITs. This is different from mortgage REITs, where real-time estimates on book value are very effective for predicting the future price.
The lowest risk ratings in the sector go to O, NNN, WPC, STOR, and ADC:
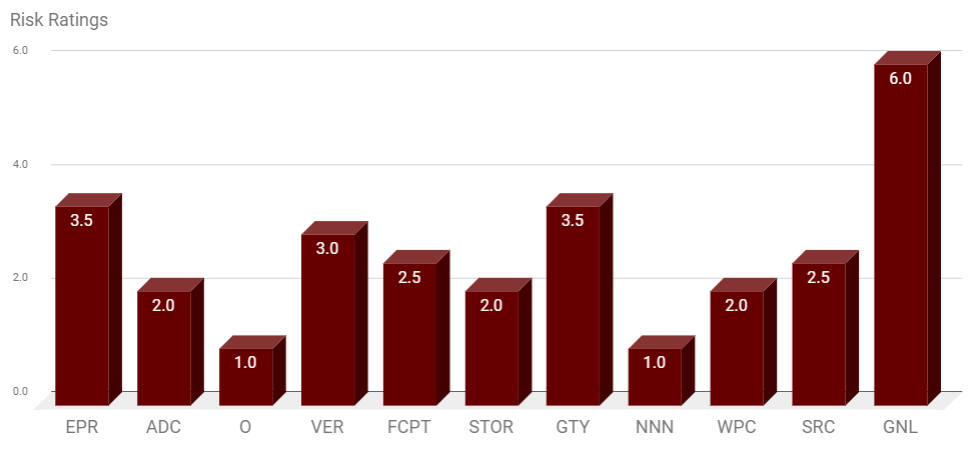
Source: The REIT Forum
Based on the volatility over the last year, there would be an argument for moving STOR to 2.5. However, we are keeping them at a rating of 2.0 for now.
Price Target Adjustments
We made slight adjustments to target prices to reflect strong rent collections, lower infection rates, and low Treasury yields. All price targets were adjusted slightly higher.
Conclusion
The triple net lease sector still faces a headwind from rent collection, but the headwinds are easing significantly. Rent collections have improved materially over the last few months and appear likely to continue improving. The drop in Treasury rates creates a tailwind for the sector, as lower Treasury rates often lead income investors to triple net lease REITs and push prices higher. At the same time, lower capitalization rates on assets drives NAV per share estimates higher. However, the share price can often move before the consensus estimate. Consequently, we use some extra caution in relying on those estimates here.
Current estimates on forward AFFO per share are being much more favorable to some REITs than others. We expect that to be resolved over the coming years and see it as a positive factor for NNN.
WPC stands to benefit from their exposure to industrial assets, which has assisted in driving their exceptionally high rent collection rates. They’ve been more insulated from the pandemic than most of the sector. It still had a material impact and it created a huge swing in the share price, but it had a smaller impact on their portfolio.
==================================
Equity REIT Terms
We use several terms when talking about equity REITs. It helps us communicate if we have the same definitions. Consequently, we put together charts to help investors understand several equity REIT terms:
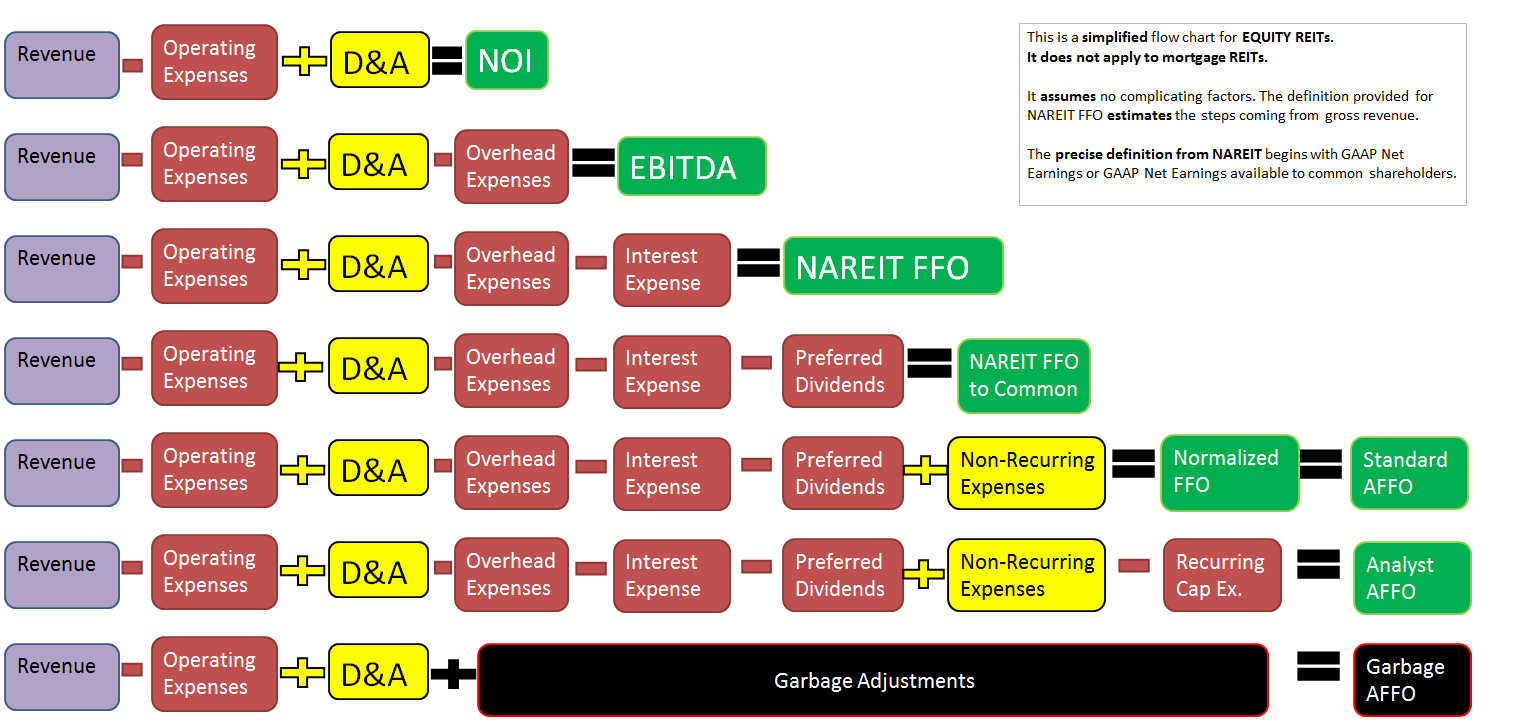
Note: Our definitions and calculations shown here are simplified. We’ve eliminated tiny adjustments that are usually immaterial.
You'll see Analyst AFFO is near the very bottom of the chart. If we want to start from revenue, it takes quite a while to get there. You don't need to memorize this table, but it could help you as a REIT investor.
Each line provides the formula to reach the value listed on the right. You’ll notice that “Normalized FFO” and “Standard AFFO” are the same. This is the value that most management teams report as “AFFO”. However, we also have “Analyst AFFO” which adjusts for recurring capitalized expenses.
Note: To be even more precise, there are a handful of other non-cash adjustments going into Analyst AFFO. However, in most cases the other non-cash adjustments have a fairly small cumulative impact. We didn’t think it was worth adding several other boxes to represent a very small adjustment.
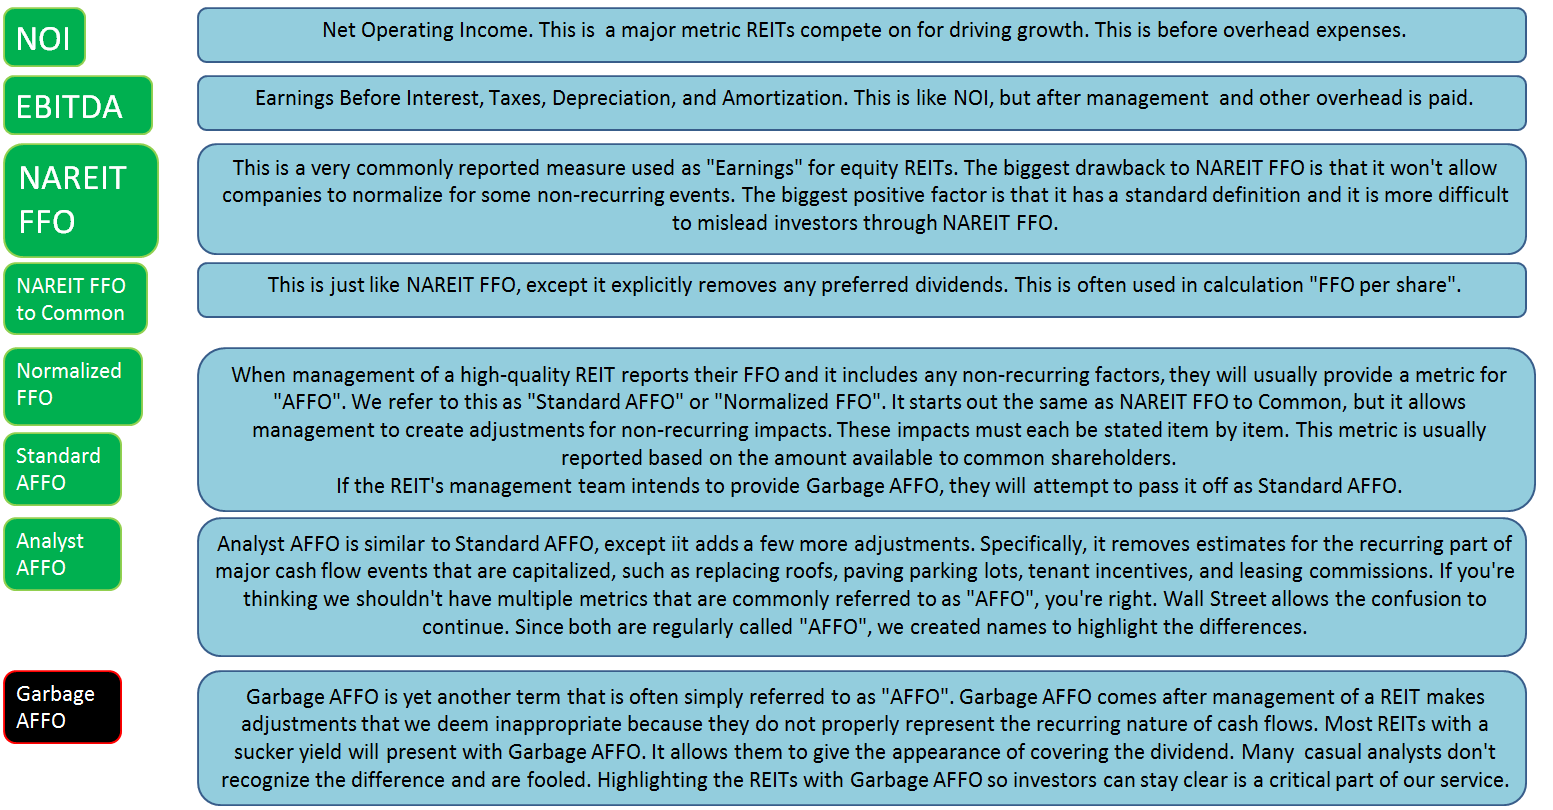
The next two tables dive deeper into the definitions:

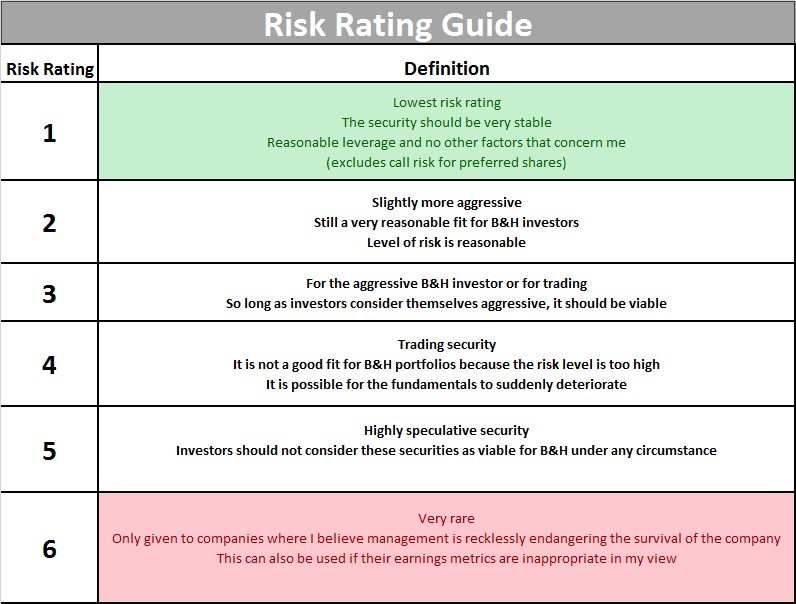
Risk Ratings
The following table explains our risk ratings:
Analyst's Disclosure: I am/we are long all shares in CWMF's portfolio.
Member discussion