
Trade Alert: AGNCO, AGNCP, CSWC, MFA-C
Using our website to communicate with our readers removes some of the current hurdles for posting public articles. Since I’m planning to dramatically increase the content flowing through our website, I want to share a trade alert we provided to subscribers of our paid service yesterday. This isn’t available on the public side of Seeking Alpha.
This article is a trade alert. We always post them after a trade, but they don’t usually go to the public side.
The idea between AGNCP and AGNCO played out later that afternoon. However, MFA-C is still only up about 1.3% from our purchase price.
Trades Placed
- Sold 899 shares of AGNCO (AGNCO) at $20.9244
- Purchased 978 shares of AGNCP (AGNCP) at $19.22
- Sold 170 shares of AGNCO at $20.9554
- Purchased 186 shares of AGNCP at $19.22
- Sold 437 shares of Capital Southwest (CSWC) at $17.6001
- Purchased 457 shares of MFA-C (MFA.PC) at $16.8194
- Purchased another 95 shares of MFA-C at $16.8327
The first 6 lines are related to each other. We would sell one investment to free up cash for another investment. In the final line, we put a little bit of cash on hand to use.
Account
All of these trades are in tax-advantaged accounts.
I expect to actively trade between the preferred shares to exploit the increased volatility. Therefore, it's no surprise the preferred shares went to the tax-advantaged account.
Execution
Most of the trades went through Schwab:
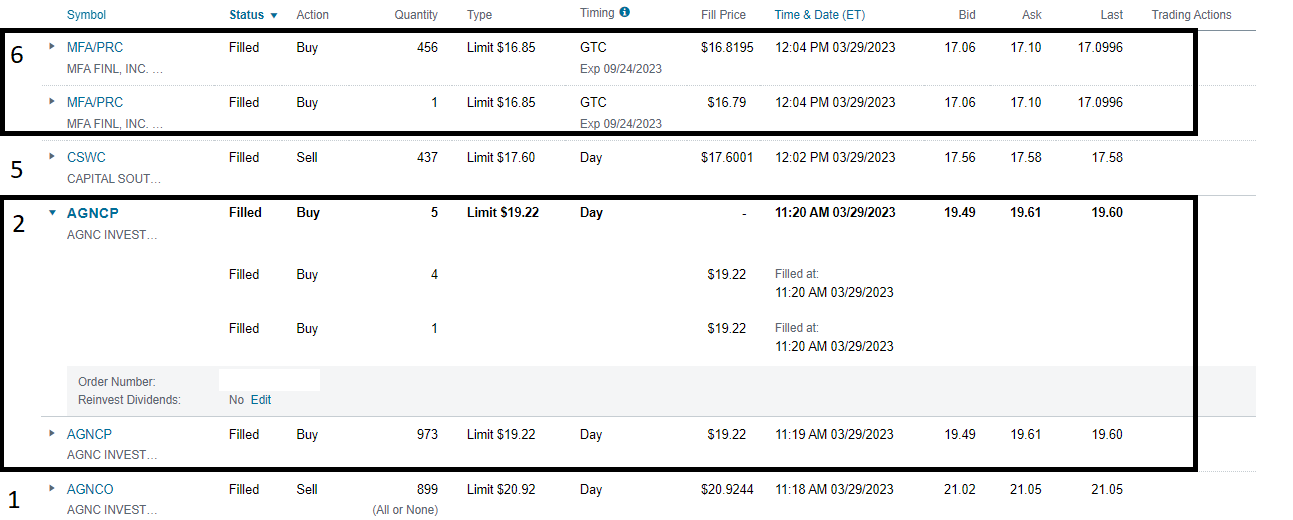
Source: Schwab
Since the new trading images are a bit harder to read, I numbered the trades.
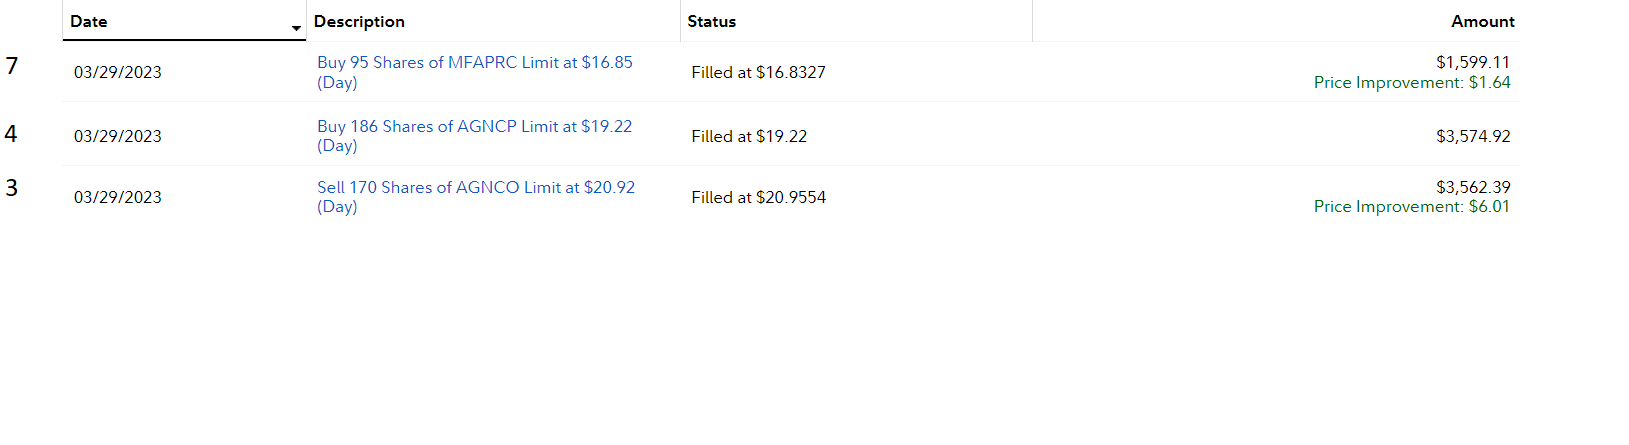
Source: Fidelity
Those small orders for 1 to 5 shares are simply to make the total dollar volume match as closely as possible. That makes it easier to demonstrate the performance from swapping between positions.
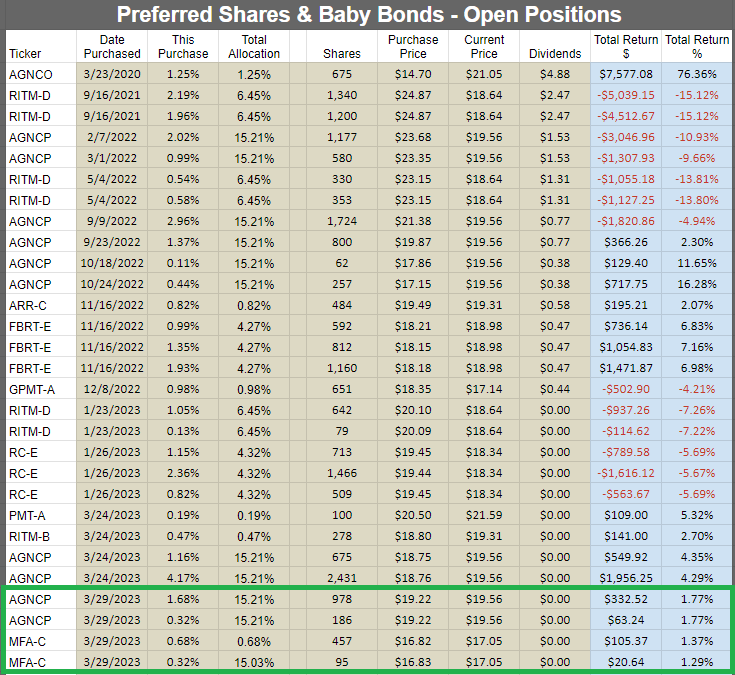
Returns for Open Positions
All our open preferred share positions are shown below:
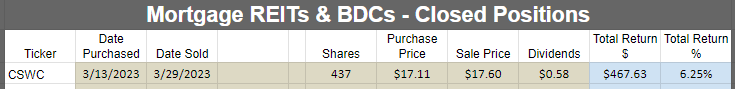
Returns for Closed Positions
Some Charts
There are a few ways to explain the move between AGNCO and AGNCP. One of them is this chart:
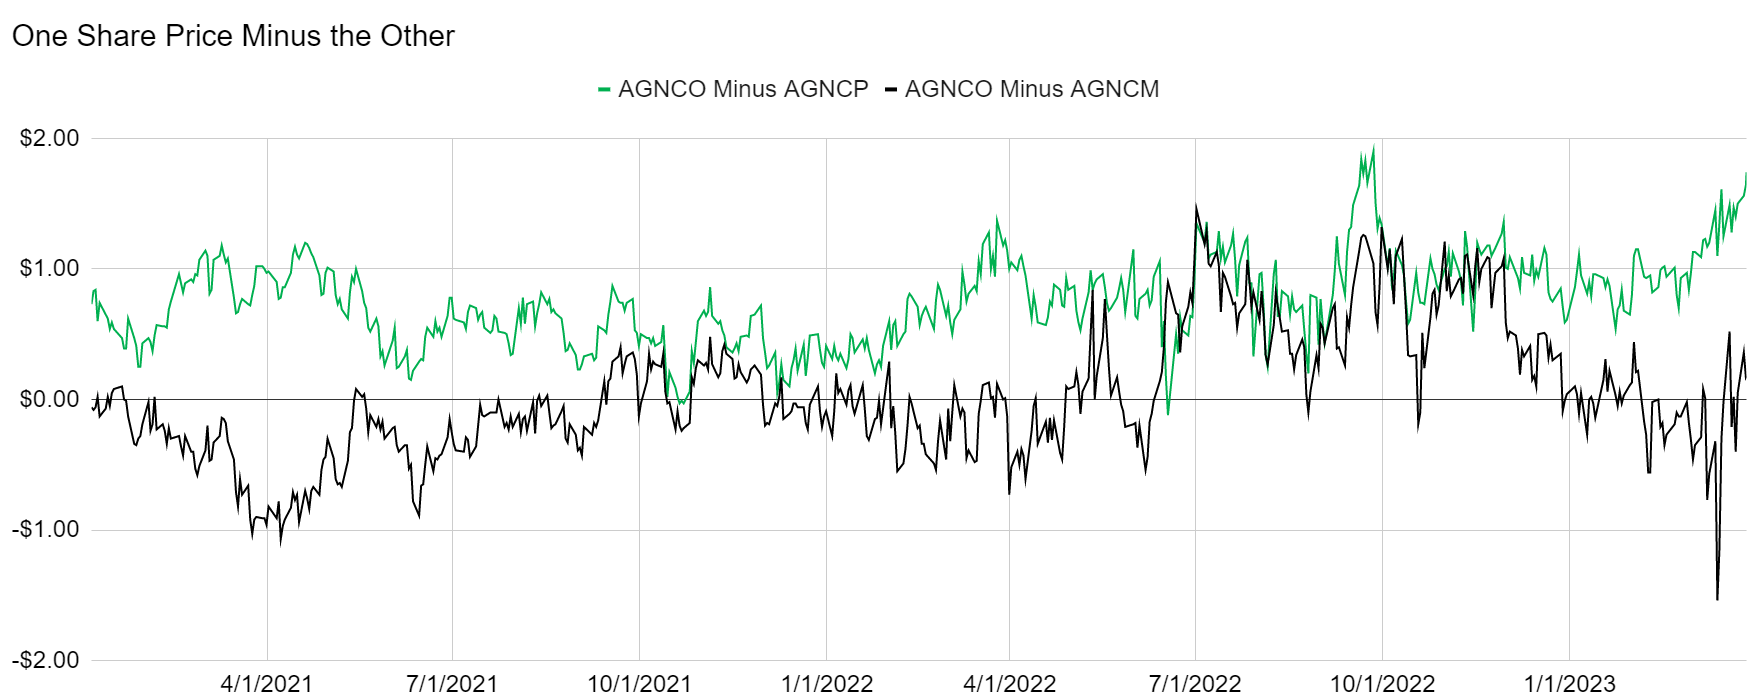
See the green line near record highs? That's the reason.
However, there is also a fundamental reason. AGNCO has two advantages. It floats 6 months earlier and it carries a wider spread. If we can put aside the 6-month issue temporarily, we can focus on the spread. The 4.993% spread for AGNCO is better than 4.697% for AGNCP.
How much better? If short-term rates were absolutely 0%, then AGNCO would pay $1.24825 when floating and AGNCP would pay $1.17425 when floating. That is a difference of 6.302%. Therefore, if we can increase our share count by more than 6.302%, the new position would create a larger floating dividend even if short-term rates are 0%.
We increased the share count by 8.88%. Therefore, we beat the 6.302% hurdle rate to say that AGNCP shares definitely produce more income when floating. AGNCP's 6.125% coupon rate is lower than the 6.5% rate for AGNCO. However, the gap is only 6.122% when we measure it with dollars and cents. Consequently, the 8.88% increase in shares means more income today.
When the exchange ratio is 1 AGNCO to 1.0888 AGNCP, the only period AGNCO wins is the 6 months when AGNCO floats and AGNCP does not.
In my opinion, those 6 months are insufficient to offset the extra shares of AGNCP we are acquiring.
However, when AGNCO gets closer to floating (10/15/2024 is materially too far away for this impact), the market will most likely become at least this inefficient again. It may well become even more inefficient. That's just because the market has been less efficient when one share is about to float.
That big gap in prices is also reflected in the $100k chart:
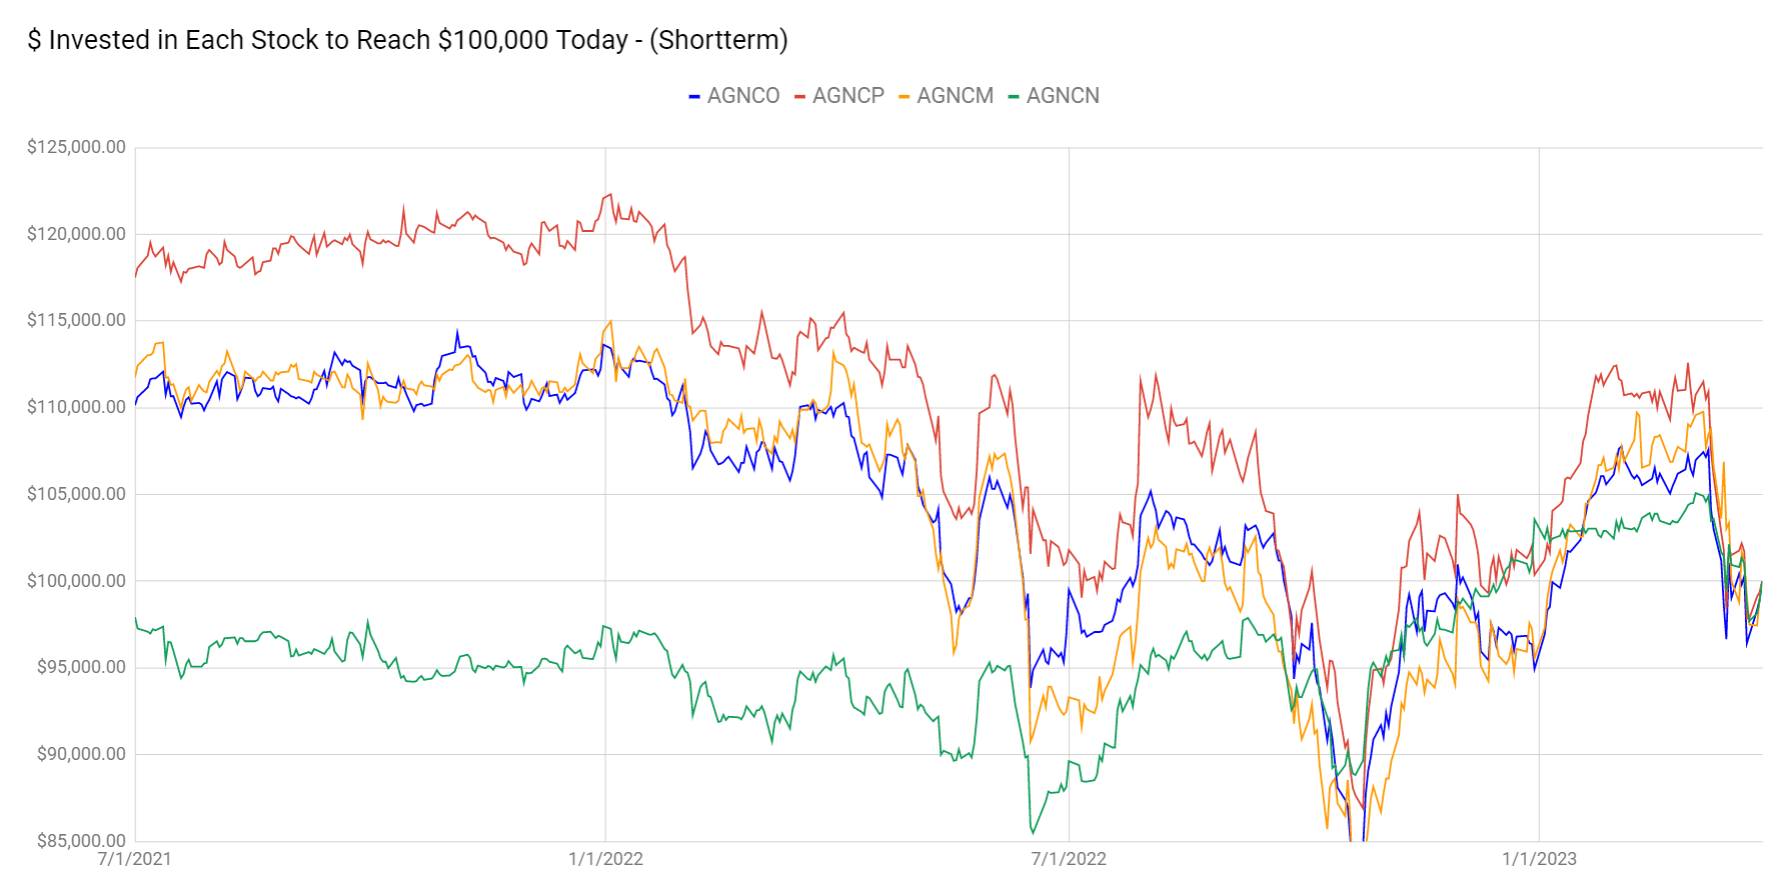
Using that chart, you can see that AGNCP took the bigger dip based on most starting periods. I expect that to partially even out. It shouldn't quite completely even out because of the difference in floating dates, but it should become materially closer.
Looking at our trade, CSWC performed better than most of the BDCs. It wasn't first place for the sector, but it was clearly better than average. There are way too many lines to follow as I want to demonstrate the whole sector, but I added dots to the dark blue line for CSWC:
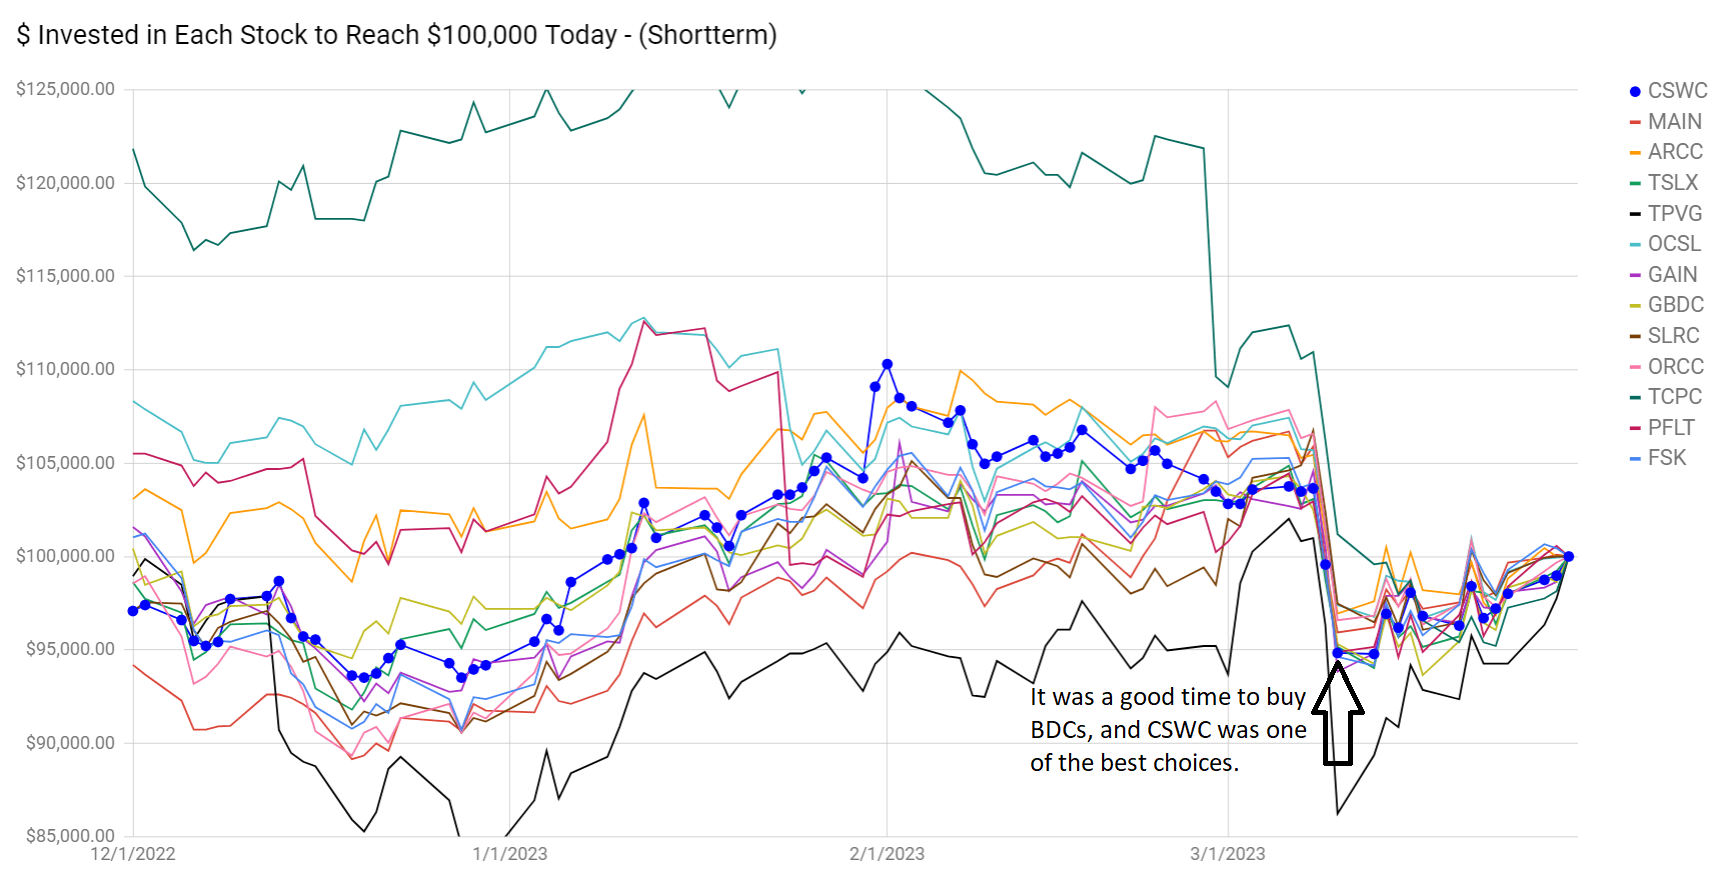
That's a nice performance. Now let's compare it with the performance for MFA Financial (MFA), MFA-B (MFA.PB), and MFA-C.
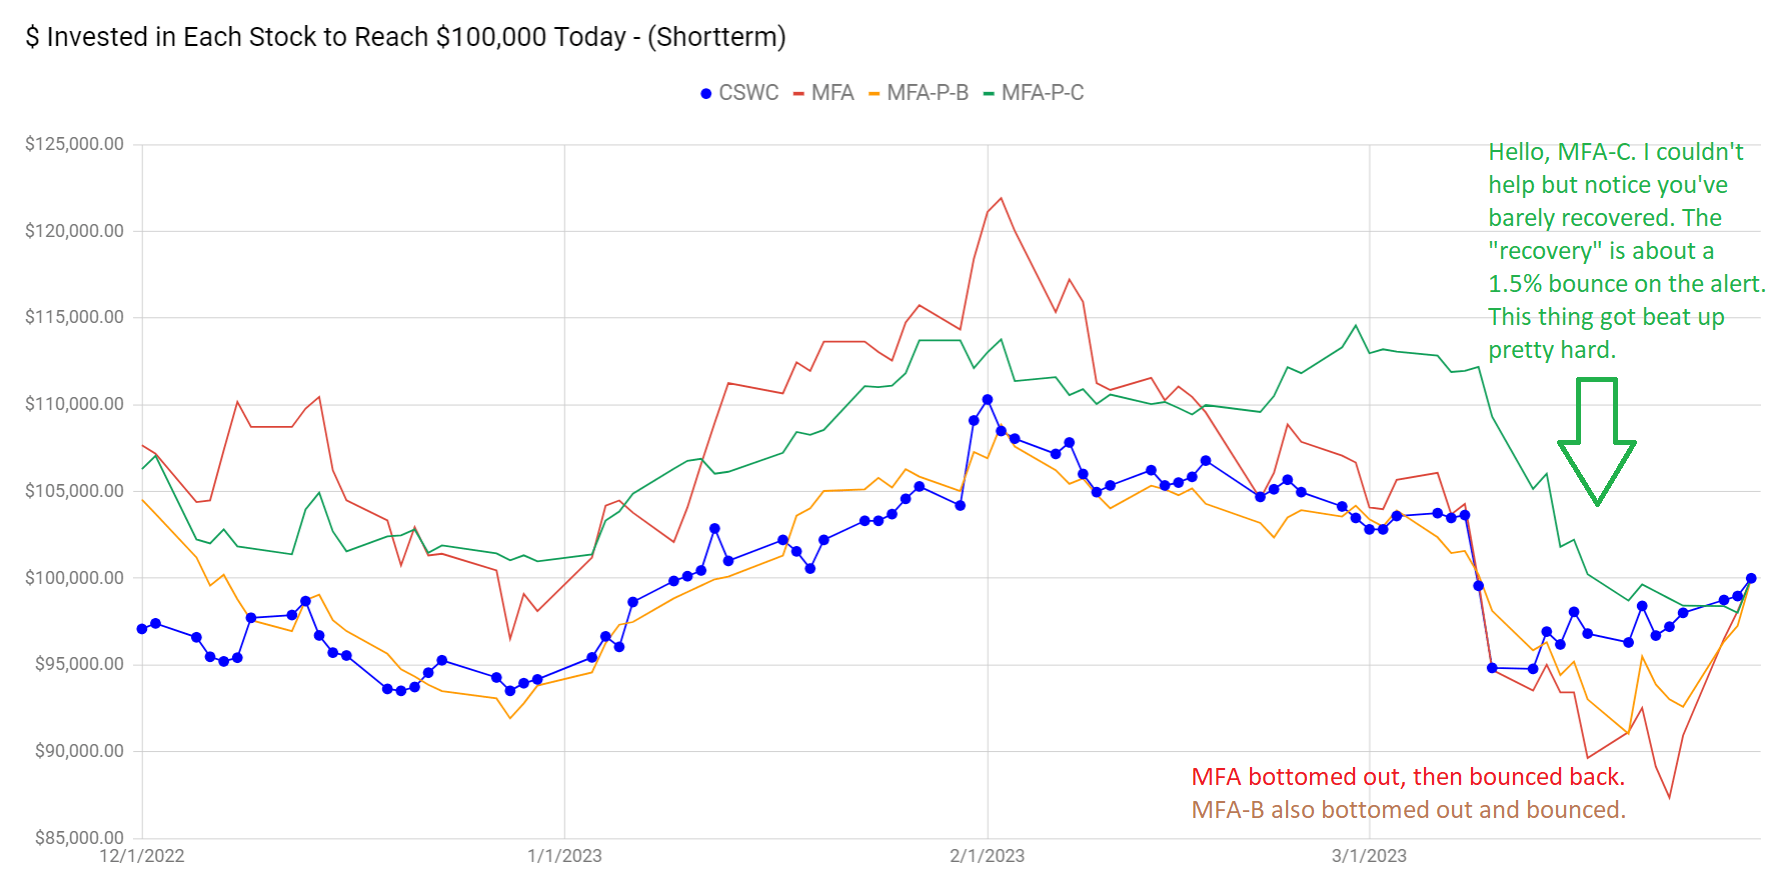
That's a big spread in performance. MFA-C is just thrown out. Sure, the 2-year rates are down. Yeah, that's better for MFA-B than MFA-C. However, this is still a big valuation gap. I expect rates to go lower over the next few years, but if they don't, then the dividend rate jumps up significantly. Not that a 9.59% stripped yield was bad, but if it were floating today, the stripped yield would be over 15%.
Conclusion
These trades are designed to enhance our position. We've often swapped back and forth between similar preferred shares to grow the total value of the position. Sometimes that involves recognizing a loss or recognizing a gain, but the emphasis is on relative values. We saw a favorable exchange rate, so we moved between positions.
For MFA-C, the shares have simply been beaten up too much. They took it worse than the sector. They took it worse than MFA-B. Depending on the starting date, they took it worse than MFA common shares. That created a nice opportunity to follow the sheet and allocate some capital into the shares. This isn't the first day for MFA-C being on sale, but it is a greater contrast because of the bounce in several other high-yielding securities.
Disclosure: We are long all shares in CWMF’s portfolio. That includes all the shares you see listed in the “Preferred Shares & Baby Bonds - Open Positions” image.
If you enjoy the free articles we’re providing here, subscribe and share a link with any investors you think might enjoy it. Your support in getting the word out is greatly appreciated.
Member discussion