
Trade Alert 2023-11-16
As I’ve discussed in our recent articles, some of the equity REITs have seen values diverging. The disparity in valuations is large enough that it was time to reallocate. When we evaluate the shares using our “price to buy” column, the gap is 1460 basis points (14.6%). Given such a large spread for REITs in the same sector, it makes sense to reallocate.
We allowed our reading of relative values to drive our initial allocation as well. That worked out quite well.
We closed out the entire position in the first REIT and reallocated a very similar dollar amount to the second REIT. Despite many REITs being pretty close to their 52-week lows, we’re actually pocketing gains on every batch of shares we closed. That’s pretty good, given the current environment.
To be clear, this sector has been suffering from significant weakness. We’re not trying to predict an immediate turnaround. However, the valuation looks solid. We’re tossing this position in the taxable account and collecting a solid dividend yield of around 4 and a half percent with a very reasonable payout ratio.
Trades Placed
- Sold 10 shares of ESS at $213.35.
- Sold 155 shares of ESS at $213.34
- Purchased 399 shares of CPT at $88.23.
Commentary
We initially entered Essex Property Trust (ESS) as a long-term position. They have good management and a strong record of dividend growth. We didn’t mind that the portfolio was all on the West Coast (mostly California with some Seattle). However, we’ve seen ESS materially outperform Camden Property Trust (CPT).
That’s not entirely surprising. We decided to buy ESS instead based on the same kind of research. Management in ESS was giving weak guidance for 2023 based on expectations for a recession. As the recession didn’t occur, ESS continued to perform better than expected.
On the other hand, investors are seeing cracks in rental rates for CPT. We’re expecting weak leasing spreads across the apartment REITs. However, we’re also looking at massive discounts to consensus Net Asset Value.
The market is recognizing the risk to sunbelt markets. We foreshadowed that well over a year in advance. I think the relative value swung too far.
Here’s the $100k chart showing how each apartment REIT has performed since 7/20/2020.
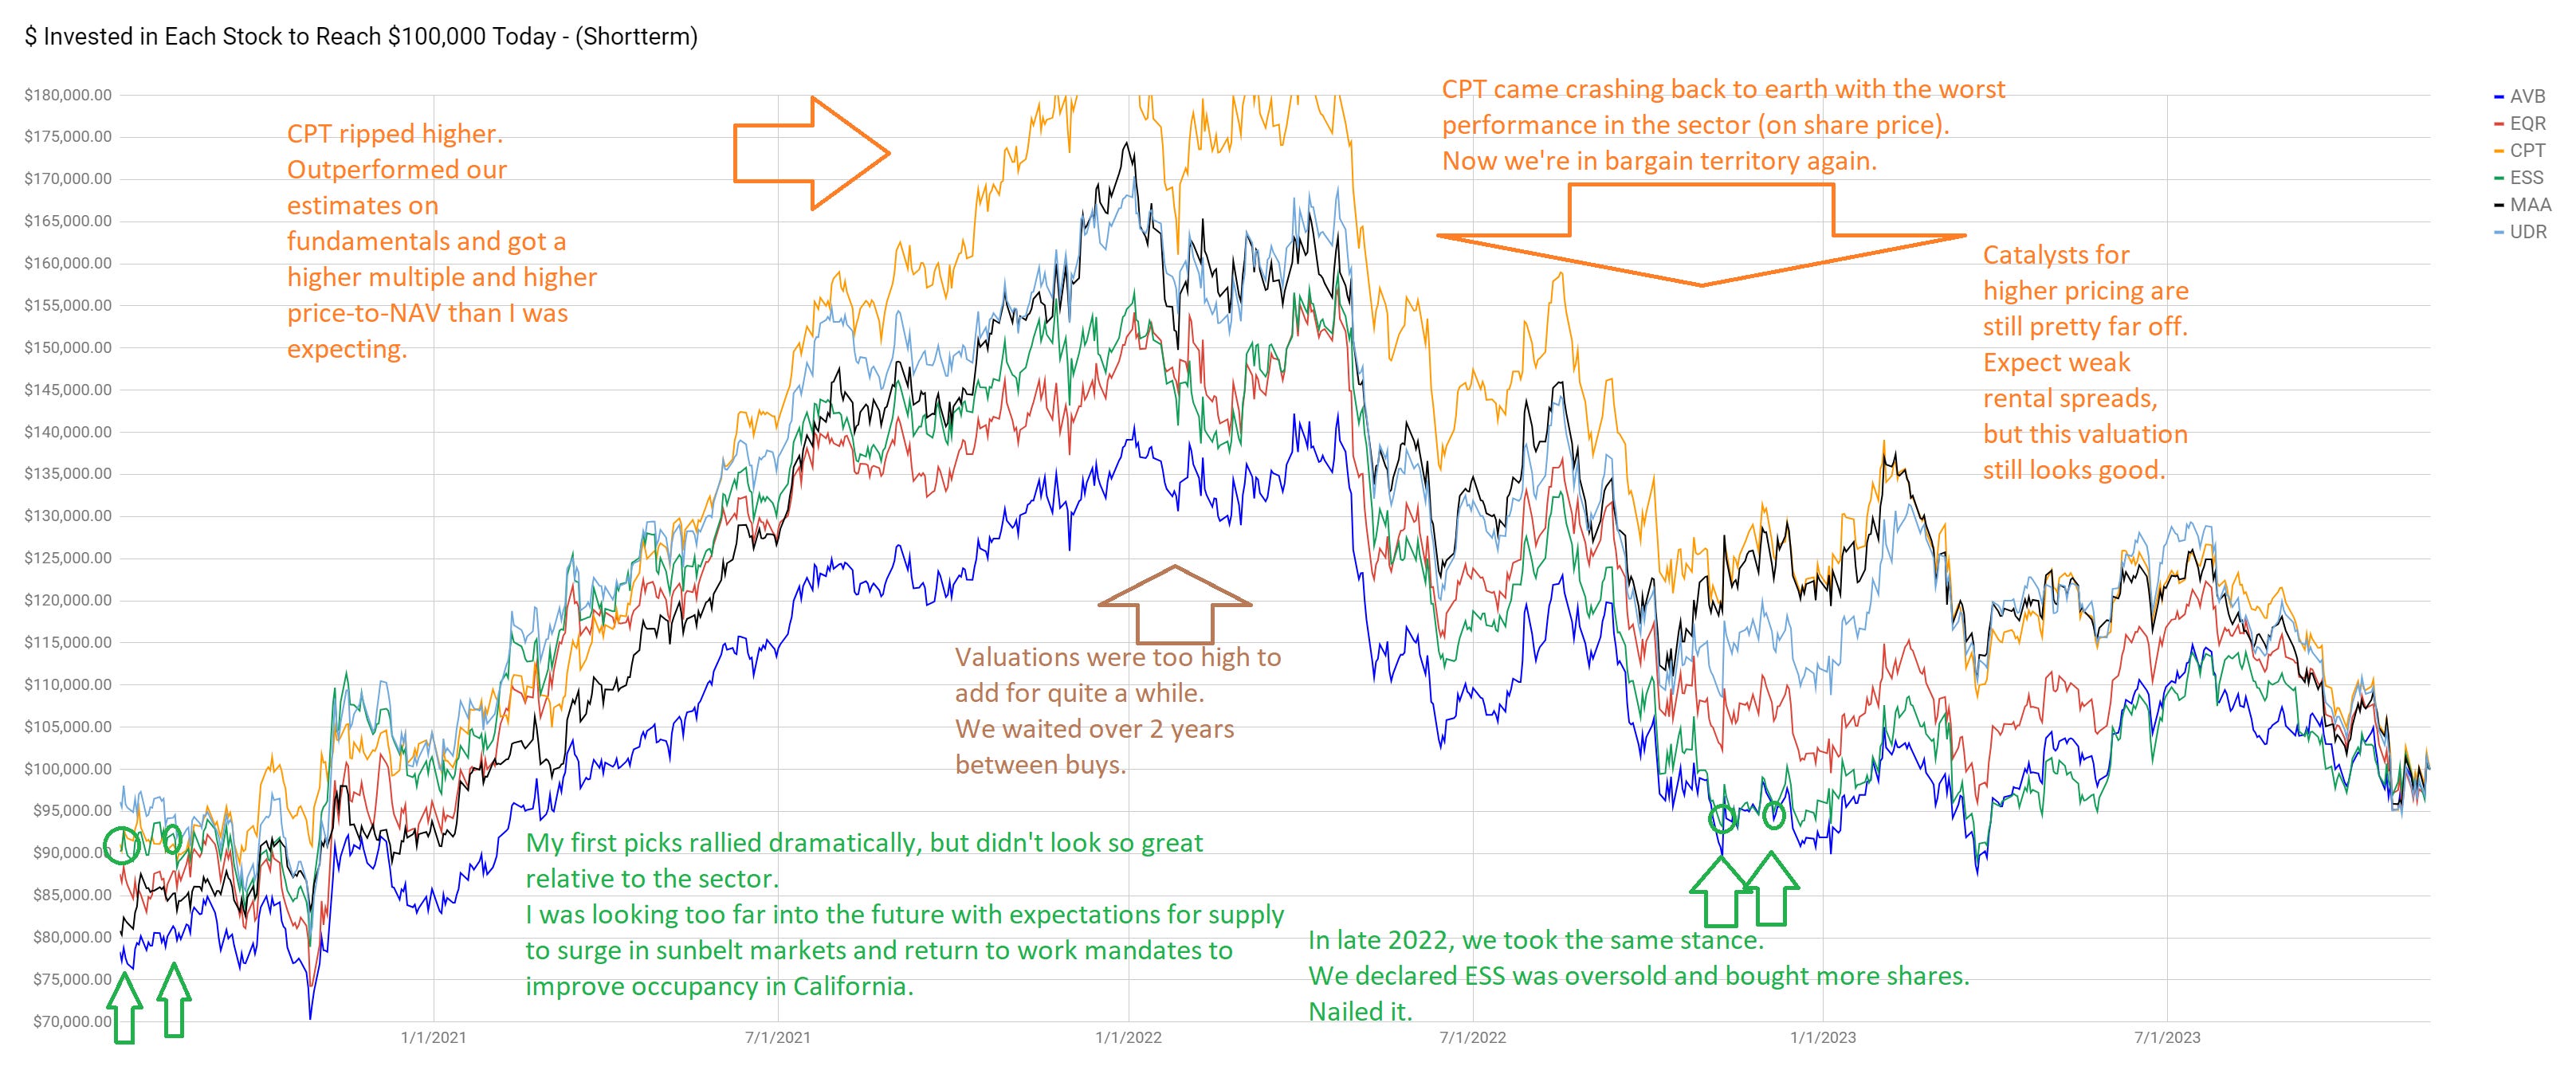
Sorry about any spelling issues in the chart. Limited time to double-check it with real-time alerts.
Account
This position goes into the taxable account. Most of the shares of ESS were already in the taxable account. A small portion was in my solo 401k. I had enough cash in the taxable account to pick up the extra shares there to maintain the same position size.
- Sale proceeds from 165 shares of ESS. were about $35,201.20.
- The purchase of 399 shares of CPT was $35,203.77.
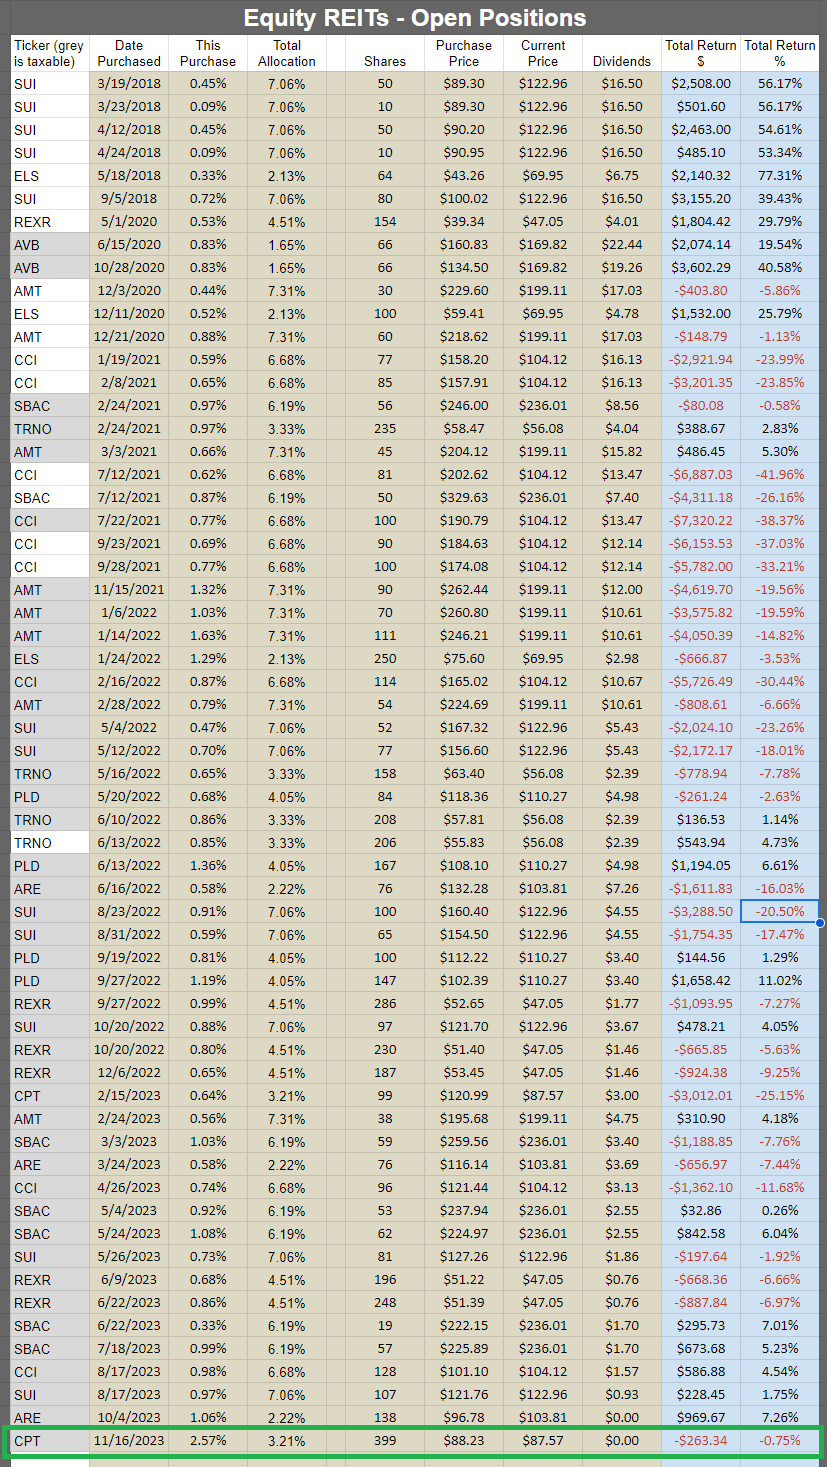
Returns for Open Positions
Returns for Closed Positions
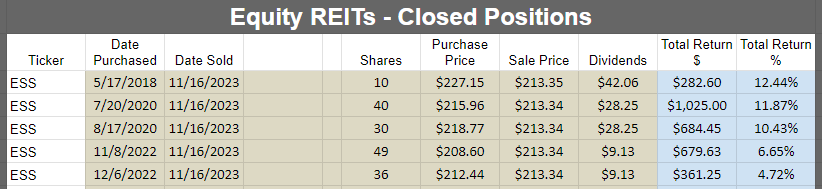
Not big gains for the length of time invested, but remember that this has been a tough period for REITs.
Execution Screenshots
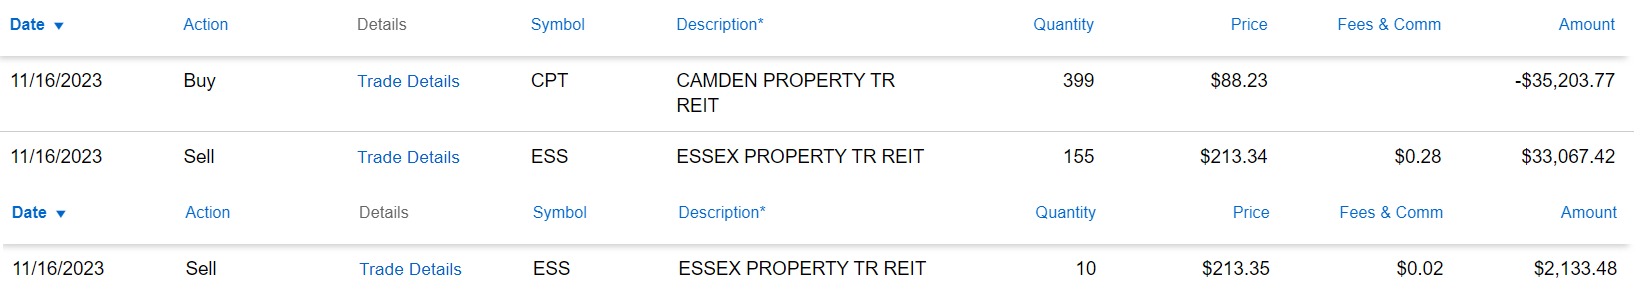
Source: Schwab
Member discussion