
The 67 Page Guide To Investing In Preferred Shares
Preferred Share Guide
If you just want the main points on preferred shares, our overview should suffice. If you want to gain a much deeper understanding of preferred shares, read on past the overview. Of course, we greatly appreciate questions. Please feel free to ask. Whether your question is about the overview or about the book that follows it, we’re happy to answer.
We refer to the long section as a book because the total article weighs in at 67 pages.

The most important step in understanding preferred shares is to know why investors want them. Preferred shares are very useful for both the buy-and-hold investor and the trader. We built a chart showing the benefits:
Our brief overview also covers:
- How to use our research
- Where to find our research/tools
- What factors we use in finding our price targets and why paying over $25 can be a great investment.
- How to enter orders for preferred shares and how to find the right ticker
How To Utilize Our Research
With several reasons to like preferred shares, we want to look at how our service ties into those benefits:

How can you find good entry opportunities? We communicate them to investors in four ways:
- Buy alerts specify the precise share and target price while the shares are on sale
- Portfolio Updates provide foreshadowing on opportunities we see developing.
- Other real-time articles provide insight into additional opportunities we're finding.
- Our Google Sheets track prices in real-time and provide immediate ratings based on our targets.
So what are the drawbacks and how can investors overcome them?

Accessing our tools
Subscribers to The REIT Forum are able to access our preferred share spreadsheet. This is a tool we heavily use in coming up with our ratings and price targets.
You’ll find it linked in the same article that has all REIT Forum Google Sheets.
Factors Influencing Price Targets
When we are setting price targets, we consider several factors including:
- Credit Risk
- Price Risk
- Stripped Yield
- Floating Yield on Price
- Call Risk
- Duration Risk
- Quality of management and transparency of accounting
Should Investors Ever Pay More than $25?
Yes. While some investors will refuse to ever pay a single penny over $25.00, there are times when it makes a great deal of sense. We evaluate each share individually, and we evaluate it compared to peers. Sometimes, a share is a great investment even though it trades above $25.00.
How do I Find a Ticker and Buy the Preferred Share?
Perhaps you’ve already been reading our articles and feel ready to purchase a preferred share. You go into your brokerage account, but how do you buy a preferred share? They trade like regular shares of stocks, but they are often a little less liquid. We handle the liquidity by using “limit-buy” and “limit-sell” prices. Those tell the broker that you have a maximum you’re willing to pay when buying and a minimum price you would accept when selling.
You’ll enter the trade on a screen that looks like this (using one of our Schwab accounts):

Your broker might not recognize the same ticker we’ve used in articles though. Each broker has their own system for naming preferred shares. You can scroll to the right on our preferred share tab to find the names used by each major broker.
That’s our brief overview. Is there something you would like to see covered within the brief overview, which isn’t yet? Let us know. We’re still working on ways to enhance the organization. The entire piece, after all, is over 60 pages in Google Documents.
If you want to expand your knowledge on preferred shares, read on through the guide. We’ll cover:
- Vocabulary - Most important terms
- Introduction to preferred shares
- Digging deep into examples of how preferred shares react to interest rates.
- Real examples of dividend captures, other profitable trades, and how we identified them in advance so subscribers could profit

To really understand and evaluate preferred shares, it helps to have a brief overview of the vocabulary we use and the metrics we track:

One final note: When we first prepared this guide, our research was only available on Seeking Alpha. Now it is also available right here, through our website.
Most images in this guide should zoom. If they aren’t zooming for you, try viewing the website version (if you’re reading this in your e-mail). If an image still doesn’t zoom, leave a comment on the article and I’ll look into it. Thank you!
Preferred Share Guide Summary Ends, Full Version Begins

Many investors are looking for a steady stream of total returns or income. One of the best ways to accomplish these goals is with high-yield investments. However, many high-yield common shares are also high-risk. Those exceptionally high yields are often there to compensate investors for huge amounts of risk. When we’re building an income portfolio, the last thing we want to see is a dividend reduction. Preferred shares are a much better tool to fill in the high-yield portion of the portfolio.
The Economic Myth
Many investors believe a terrible myth about investing. They believe that returns improve with additional risk. Every entry-level discussion of finance or economics references the idea of efficient markets. It suggests that investors who take on more risk will get more returns. The idea is complete rubbish, but it is repeated without any critical thinking. Think about this:
If higher risk always leads to higher returns, what is the risk?
There wouldn’t be any risk. It would just be a measure of the investor's ability to withstand a temporary decline. Every decline would be a buying opportunity. What happens in bankruptcy? Common shareholders generally get wiped out. Preferred shareholders can often get nearly wiped out also.
Consider the ultimate high-risk venture: the lottery
Millions of people buy lottery tickets every week. There is a high probability of complete loss, but a tiny possibility of an insanely large gain. Since this is an extremely high-risk scenario, it “should” deliver the highest returns. Instead, the lottery takes in far more than it pays out. For extreme levels of risk, the expected return can turn negative.
If you want long-term outperformance, focus on reducing risk. The key to investing is to very rarely lose money. No investor is perfect. All investments carry risk. However, many of the lower-risk investments carry a much better risk/reward profile.
High-yield common stocks can carry a significant amount of risk and cause the investor to lose sleep at night.

That is why I’ve created a guide to walk you through a relatively safe way to invest in high yields.
As Vince Lombardi began every football season, “Gentlemen, this is a football.”

Investors, this is a preferred share…
Dear investors
This is an introduction to investing in preferred shares. In this guide, I will introduce you to the basic concepts of preferred shares, how to understand and evaluate a preferred share, and how to invest profitably and trade with confidence.
- Each segment of this guide will help explain preferred shares.
- Take your time to study this guide. It is fair to say that sometimes even experienced investors fail to understand the details of preferred shares. By learning the basics outlined in the guide, you will be prepared to invest in one of the most interesting segments of the economy – preferred shares.
A Guide to Investing in Preferred Shares
(Please note this guide will cover the vast majority of situations. There are some rare exceptions.)
Before you invest in preferred shares, there are a few things you should know to maximize your effectiveness. By paying attention to a few details you will feel more confident about your trades and you will have a stronger grasp of the dynamics of this exciting part of the market.
As a trader and investor, I spent years learning the strategies of investing in preferred shares. About four years ago I realized I wanted to share my knowledge with other investors. Thereafter, I started writing public articles and later created The REIT Forum.
Whether you are a trader or a long-term investor, a novice or an old-timer, let’s take some time to review the basic elements of successful investing in preferred shares.
We’re going to follow an outline since the guide is long enough to be a book. You can use the “find” command and enter “part 1”, “part 2” or any other part to jump to that section.
Outline
- What is a preferred share?
- Total return
- Buying a preferred share
- Risk factors for preferred shares
- Preferred share stability
- Benefits of lower volatility
- Exposure to interest rates
- Dividend capture examples
- Dividend capture FAQ
PART 1: What is a preferred share?

A share of preferred stock is a share of a company that is a cross between a bond and a common stock.
- Preferred shares are called “preferred” because these shares have dividend preference over common shares.
- Because preferred shares have a dividend preference over the common and because the price of the shares tends to be stable, many people think of preferred shares as having minimal risk.
- Preferred shares of stock are issued with a prospectus, like common shares. A prospectus is a contract between the company and the investors. In the prospectus you will find the issue price, the call price, the date the shares are eligible to be called, and, of course, the dividend amount. These elements form the basic contract between you and the issuing company.
Compared to a stock
- Like common stock, a preferred share’s price moves up and down due to supply and demand in the market.
- Unlike common stock, a preferred share can be called back by the issuing company at a fixed price (after call protection ends) - normally $25.
- Like many common stocks, a preferred stock pays a dividend, fixed by a contract known as a prospectus. Most preferred stocks pay a fixed dividend. This causes many people to compare them to bonds which also pay a fixed dividend.
- Unlike common stock, the dividend usually remains constant throughout the life of the preferred share. Because the dividend is fixed, they are compared to bonds, which also are fixed.
- Note: Some preferred shares have an FTF (fixed-to-floating) feature. This means after call protection ends they cease having a fixed dividend rate and go to a floating rate.
Compared to a bond
- Like some bonds, a preferred share has a “call date”. The issuing company may or may not call the preferred shares on the call date. If the share is called, the company gives the agreed amount (usually $25) to the investors and then retires the shares.
- After the call date, the company can call the preferred shares at any point with a 30-day notice.
- Unlike a bond, the preferred shares do not have a maturity date.
Which shares do we focus on?
There are hundreds of preferred shares on the market. I limit most of my research to REIT (Real Estate Investment Trust) preferred shares. Each REIT has its own style and focus. I focus on REITs and their preferred shares because I find this a profitable niche in the market.
I have focused my energy on the REIT market for my own portfolio and The REIT Forum. I developed highly-accurate modeling techniques and have a successful track record of investing and anticipating price moves in the REIT market.
I hope you will join me. With care and patience, you also can find this a rewarding portion of your investment portfolio. Many of my readers tell me they sleep better at night because they are in the safer preferred shares.

It is my job, as a researcher, to keep you posted on the best opportunities in the REIT universe and to identify troubled companies – to steer you clear of those investment companies.
Part 2: Total Return

You invest for a purpose: to make money. Whether you are investing in common stocks, preferred shares, commodities or tulip bulbs, the measure of your investing success is the total returns.
The returns come to preferred share investors in two ways:
- Dividends paid on a regular basis
- Capital gains when they sell the shares at a profit
If you bought and sold a series of preferred stock, all that will matter at the end of the day is the total return achieved on the position. After a position is ended, it is possible to know precisely what the values are by answering the following two questions:
- What is the difference between the starting value and the ending value?
- How long did it take to get there?
Preferred shares have the advantage of allowing the patient investor to benefit from both dividends and capital gains. Preferred shares, like every other investment, are vehicles for turning your initial capital investment into a profitable investment with the best total return. Preferred stocks are particularly appealing because they routinely sport a high dividend and a relatively stable price.
REITs, my niche, are even more interesting because their dividends rates are higher than most, making it easier to turn your initial investment into a higher total return.
My goal is to increase your total return in three ways:
- Help you find the best entry points.
- Help you find the best/safest opportunities for steady long-term income.
- For investors interested in trading, the best exit price.
Every 2 weeks, for subscribers to The REIT Forum, I break-down the prices of each of the preferred shares I follow. There are four price ranges:
- Strong buy
- Buy
- Hold
- Overpriced
In each of those articles, I give my readers all four price ranges for all the preferred shares I follow.
Part 2.1 Total Return: When to measure your total returns
The time you measure your total return on a position is: after the sale of your position. On the day you close your position you can calculate your total return.
It is important to remember that preferred shares are less liquid than common shares. In some rare cases, only a few thousand shares trade each day. When a large investor, or mutual fund, purchases or sells a large position the price can suddenly move 2% to 4%.
As long as a preferred share is trading within its normal range, investors should not be overly concerned.
Part 2.2 Total Return: Entry price is extremely important
Like common stocks, preferred shares rise and fall in price. One goal of diligent research is to find the best entry point. Even if you choose to hold your shares for a long period, you want to purchase them at the lowest price. The lowest price gets you the maximum shares for your investment and nets you the greatest dividend over time.
If you are a trader you want to purchase your preferred shares at a discount and sell them at a premium, just as you would a common stock.
Part 2.3 Total Returns: The importance of the callable value of a preferred stock
Preferred shares can be called by the issuing company at a fixed price (the call price) at any time after call protection ends. Usually, the call price is $25.00.
Because preferred shares have a built-in call value of $25, there is a strong tendency for the stock price to oscillate around $25.
For various reasons, such as a low dividend, some preferred shares trade at a discount most of the time. Others, with a high dividend, may trade at a premium to their call price.
As a researcher, I consider the trading range of preferred stocks that I follow. The trading range assists us in identifying the best entry and exit points for subscribers.
Part 3: Buying a preferred share

- Limit Orders Only
Due to poor liquidity, it is important to only use limit orders. Whether buying or selling, you don't want to be the poor sucker that ends up with a transaction 2% to 3% away from the average price.
- No Stop Loss - Ever
Stop-loss orders on illiquid securities are the worst. Don't use stop-loss orders. They are dreadful. I love it when the other party is using a stop-loss order because it can be a major factor in finding that 2% to 3% discount on entry.
- When Are Prices Most Absurd?
Monday morning and Friday afternoon have historically been my best bet to catch prices deviating materially from their normal ranges.
- Benefits of Limit-Sell Orders
I've had some great success with these orders. I place my limit-buy orders low and the limit-sell orders high. When I see either has executed, I'm happy because I know I got a price where I feel great about the transaction.
When I'm looking for preferred shares, I still want to look at total returns. Don't overreact to a price spike in the closing few minutes, but total returns are great. I can usually find at least one nice bargain available and sometimes several. Therefore, I want to be ready to sell my position if someone sends the price soaring. Once you have established an approximate value for the security, it often makes sense to leave a limit-sell order open above that range. Unlike common stock, the value of a preferred share can be nailed down to a much smaller range in many cases. For instance, if the security is already callable at $25.00 and you love it at $24.50, you might still want a limit-sell in place by $25.75 or $26.00. Why would you give up your shares? Because the company has the right to call them away from you anyway and only give you $25.00 plus accrued dividends. There should be a better option available.
Part 3.1 Buying a preferred share: Beware your own liquidity needs
While prices rarely move dramatically for long, investors should still beware of the impact of terrible liquidity. If you need access to the capital, don't lock it up in the preferred shares.
Getting a great low price on entry and a great high price on selling means the investor often doesn't know the time frame of their investment. They can guess and they can set goals, but the market doesn't always cooperate.
Part 3.2 Buying a preferred share: Dividend accrual & stripped price
- Dividend accrual happens during the period from one ex-dividend date to the next. The ex-dividend date is when you are owed the dividend. The actual payment date is usually 2 to 4 weeks later. You must be holding shares before pre-market trading begins on the ex-dividend date.
- Purchasing shares on the ex-dividend date doesn’t count, even in pre-market trading.
- The stripped price is the current price minus the dividend accrual.
The simple premise is that you would rather pay $25.00 the day before an ex-dividend of $.50 than pay $24.90 on the ex-dividend date.
The buyer gets the full dividend amount - even if they bought it the day before the ex-dividend date. They are essentially getting a rebate on their purchase price by getting more dividends than they would have "earned" from the period they owned shares.
For my purposes, I always assume the preferred shares are traded in an IRA so the effective tax rate is assumed to be 0%. Therefore, paying $25.00 the day before ex-dividend or paying $24.50 the day after ex-dividend is essentially the same. Consequently, immediately before the ex-dividend, I would recognize a " stripped price" of $24.50 with a regular market price of $25. In my experience, this has been by far the most effective way to evaluate comparable shares and predict when the risk/reward is separating from peers.
Part 4: Risk factors for preferred shares

Note: I monitor all of these risk factors
Some of these will apply to all kinds of preferred shares, but I’m going to narrow in on things that matter more to mortgage REITs.
- Risk Factor - Default
This is rarely an issue but is arguably the biggest risk factor. Without this possibility, investors would simply aim for whatever had the highest yield.
- Risk Factor - Enron
The first way to buy a preferred share and end up with a huge loss is to simply get “Enron-ed”. No matter how hard you work on your due diligence, accounting fraud is still difficult to detect without inside information. I combat these risk factors by investing in companies or preferred shares with high-quality accounting. I can identify which companies have higher or lower levels of Enron-risk.
- Risk Factor - Credit Risk
Credit risk comes from investing in a mortgage REIT that holds a portfolio of very credit-sensitive assets. If a huge portion of those assets go bad, the company could go under. This is a case where losses in their assets could turn into losses for the investor. Due diligence should be a huge factor in assessing the level of risk here.
One example of this kind of risk comes from Apollo Commercial Real Estate Finance (ARI). If we hit a major recession and the value of the collateral tanked, investors would expect the loans to go bad and ARI could suffer horribly. That doesn’t mean there is anything fundamentally wrong with their company today.
- Risk Factor - Spread Risk
Spread risk comes from the risk that a mortgage REIT’s assets and hedges won’t offset effectively and the equity value would be destroyed. When this happens the immediate impact is a large decline in book value per share, but theoretically, if it were bad enough, the common could be wiped out and the preferred could suffer material losses.
While I do see substantial risk to the value of portfolios, I don’t see much risk to the preferred shareholder from this factor. It could happen, but it would be a huge surprise.
- Risk Factor - Duration Risk
This is the risk that the mortgage REIT is taking on too much duration exposure to try to pump up their net interest spread. In this scenario, a huge movement in rates going in the wrong direction could decimate the value of the portfolio.
While I do see substantial risk to the value of portfolios, I don’t see much risk to the preferred shareholder from this factor. It could happen, but it would be a huge surprise.
- Risk Factor - Yield Movements
This is not the same as the risk of a default caused by rapid movements in yields. This is the risk that even though the mREIT remains fine, a substantial movement higher in Treasury yields and bond yields leads to a corresponding movement in preferred share yields. In that case, the fair value could decline. As of my writing this, the yield spread between Treasuries and the preferred shares remains large by long-term historical standards, even if it seems low relative to the last couple of years.
Rapid movements in interest rates will often have a temporary negative impact on preferred share prices. If rates go back to moving gradually, the preferred shares usually bounce back.
- Risk Factor - Call Risk
The risk of a call creates a soft ceiling on prices. Sometimes transactions will go materially above that on a price spike, but generally speaking the potential for a call limits the appreciation preferred shares can enjoy.
There are two major forms of protection from call risk. One is “calendar protection”. This applies when the shares are not eligible for calling yet. The second is “price protection”. This is where you buy the security at a material discount to the call value. That way, if a call happens while you’re still holding the shares it creates a capital gain on the position rather than a loss.
Allow me to point out that companies very rarely call securities trading under call value. They can simply buy those securities back in the open market. There is no reason for them to issue a call and pay a premium to the market price. This is an area many investors struggle with. Companies rarely don’t call their preferred shares unless they are trading at a premium. Usually, they would do it when they think they can issue new shares at a materially lower rate.
Investors wanting to see examples of this can look at Realty Income Corporation (O), National Retail Properties (NNN), or Gladstone Commercial Corporation (GOOD). These are all equity REITs, but they each have experience calling preferred shares while issuing new ones at lower rates.
- Risk Factor – Keyboard to Chair
A poor decision emanating from somewhere between the keyboard and the chair can still lead an investor to buy high and sell low. This is different from selling at a lower price with a tiny loss because the fundamentals changed. That would fall under factors like “Credit risk”. This is simply the risk of a poor decision.
- Which Factors Can Investors Influence?
Pretty much everything else here falls under doing proper due diligence. The risks cannot be completely wiped out, but they can be minimized by doing the necessary research before the first transaction.
Part 5: Preferred Share Stability

The reason I'm steering investors towards preferred equity is the certainty of the dividend, relatively stable price, and their perfectly stable call values.
The preferred shares dividend takes priority over the common dividend. For it to be reduced even a penny, the common dividend must be canceled entirely.
In bankruptcy, the preferred shareholders would expect to get screwed. However, the mortgage REITs holding only agency mortgages are unlikely to ever find themselves in that situation. In an orderly liquidation of assets, those preferred shares should either get their call value or get transferred to a new company buying the husk of the mortgage REIT. Either way, they wouldn't be doing too poorly.
Some of the mortgage REITs take on substantial credit risk, but it is my duty to assess that before making a recommendation.
For traders, it always comes down to assessing relative valuations to find the opportunity to exploit. I still often favor the preferred shares because I can establish relative valuations in a tighter range. The tighter range gives us confidence the price should correct before the fundamentals change.
For buy-and-hold investors, the preferred shares are generally the superior tool. These investors simply need to find the securities that match their needs and an attractive entry point. For instance, NLY-C, NLY-D, and NLY-E were all excellent buy-and-hold candidates over the 2016-2017 winter when investors could acquire them for around $24. The buy-and-hold investor stepping in at that point knew they were grabbing a great yield and if a call eventually happened it would mean adding about $1.00 in capital gains to the solid yield. For investors in NLY-E, that is precisely what happened.
Part 6: Benefits of lower volatility

Preferred shares have come into fashion for many retail investors over the last several years. During a period where Treasury rates were exceptionally low, many investors began looking for alternative sources for yield. Unfortunately, the easiest option hasn't been remotely close to the best.
Preferred Share ETFs
Many investors turned to preferred share ETFs like the iShares U.S. Preferred Stock ETF (PFF). That technique has delivered some yield for the investors, but it delivered much weaker returns than picking individual shares. We explained this concept at great length in Preferred Shares Week 147.
Within that article, we charted total returns for PFF and included MFA-B (MFA.PB), DX-B (DX.PB), and CMO-E (CMO.PE). We use a unique charting technique for this purpose. Instead of calculating returns from one singular date, we chart based on current values. We want to answer the question:
"To have $100,000 in these shares today, how much would I have needed to invest (with dividend reinvestment) on any prior day?"
By phrasing our question that way, we can view thousands of potential starting dates and prices at once. Here is the chart:

The chart is designed so that all the final points must line up at precisely $100,000. Most charts show returns only from one starting date, but our chart shows returns based on any starting date. That means we don’t need to draw a new chart every time we want to look at a different date.
You can tell at a glance that an investor who bought DX-B, CMO-E, or MFA-B on any day between 7/1/2016 and 1/1/2018 was significantly outperforming PFF. You know that because throughout that period the highest line (worst performance going forward) came from PFF’s green line.
You also can see that these preferred shares usually correlate very well together. Small breaks in the valuation can appear for a few months, but the longer-term correlation is extremely strong. This is why we monitor prices so closely. We’re watching for those opportunities as they occur.
The next thing you may notice is the volatility. The preferred share lines (blue, gold, and red) are not showing materially more volatility than the ETF. They are climbing much faster, but the change from one period to another is not more volatile. This is important because it reflects the difference in risk. Since the ETF is diversified, it “should” be far less volatile than the preferred shares.
Why isn’t the Diversification Working?
Diversifying between several mediocre investments doesn’t create a great investment. PFF’s holdings include too many shares with excessive credit risk (terrible balance sheets) or excessive interest rate risk (yields are too low).
The Concept of Diversification is Excellent.
We encourage investors to diversify among several good investments. However, diversification by itself does not protect investors from including poor investments in their portfolio. PFF’s long-term performance is hampered by the inclusion of several poor investments. Diversification reduces the impact of a single bad investment but it doesn’t replace doing due diligence.
Other Mortgage REIT Preferred Shares
We put together the chart with AGNCB (AGNCB), NLY-D (NLY.PD), and ANH-C (ANH.PC) as well:

Why do these individual shares perform so well? None of them are going under or falling dramatically. There's also no expense ratio on the individual preferred shares. Finally, they offer fairly high yields relative to their risk.
The cumulative returns are primarily built on the dividend income, though sudden dips or rallies shown in the chart reflect a temporary movement in the share price.
How about an example? Despite a pretty large rally in the mortgage REIT preferred share space, we saw a nice opportunity in NLY-F during April.
Afternoon Sale on NLY-F
We witnessed a surprising sale on the afternoon of 4/16/2019. Shares of NLY-F (NLY.PF) were down nearly 1% on the day (from $25.70 to $25.45, though it bumped back to $25.50 while writing a buy alert). This sudden decline brought NLY-F back into our target buy range.
We issued a buy alert in real-time:

Within that alert, we wrote:
NLY-F carries a risk rating of 1. We see this as a very viable opportunity for buy-and-hold investors as well as traders.
The last few weeks saw materially higher stripped prices for NLY-F and created less favorable opportunities for purchasing. While our other preferred share picks rallied early today, the sudden weakness in NLY-F is providing investors with a new opportunity.
This is a sale that's only appearing over the last couple of hours:

Comparing the recent price to the historical range, we can see that this is just a tiny bit above the average valuations for the last year:

Note: Even with the stronger liquidity of NLY-F relative to most preferred shares (over 100,000 shares traded hands today), there's occasionally a slight bump if large orders are entered.
Investors should never use "market" orders for trading preferred shares. It's wise for investors to stick to using "limit" orders for any preferred share trade.
Our actual “buy under” target price was $25.60, but at the time of this alert, the price was at $25.50.
What is Your Outlook on PFF?
It isn't worth having a "bearish" outlook, so we just remain neutral. We expect PFF to deliver mediocre returns. It could quite easily be +5% or minus -5% over the next year. Analysts don't want to take any rating besides "neutral" if they expect returns to be flat. It reduces the average performance on their ratings, so they tend to avoid it.
That's a bit unfortunate for investors, who may not like the prospect of taking on the risks of the ETF for relative meager returns. They could buy an ETF filled with very short-duration Treasuries and earn a moderate rate of return. However, if you wanted returns similar to a savings account or a bank CD, you wouldn't be here. So let's take a look at the process for finding bargains.
How Can You Find Bargains?
The most important step is to have a grasp of the underlying fundamentals. Investors should understand the financial condition of the company. By understanding the fundamentals, you'll have an easier time evaluating how much risk a specific share carries.
The second factor is to monitor several preferred shares to see when they are not moving in unison. Occasionally we will see preferred shares from a single REIT deliver dramatically different returns. That can be a big deal! If you find a large change in the relative value of two preferred shares, you may have a great opportunity to swap between investments.
Example of Swapping
During the second period of fear (December 2018), we swapped one fixed-to-floating share for a fixed-rate share. The shares in question were TWO-A (TWO.PA) and TWO-E (TWO.PE).
We bought shares of TWO-A on 9/12/2018. By 12/21/2018, their price had fallen by about 3.6%, but they had also paid out one dividend. We were down 1.7% on the position, but we had an opportunity to swap for shares of TWO-E. Here is the chart covering that period:
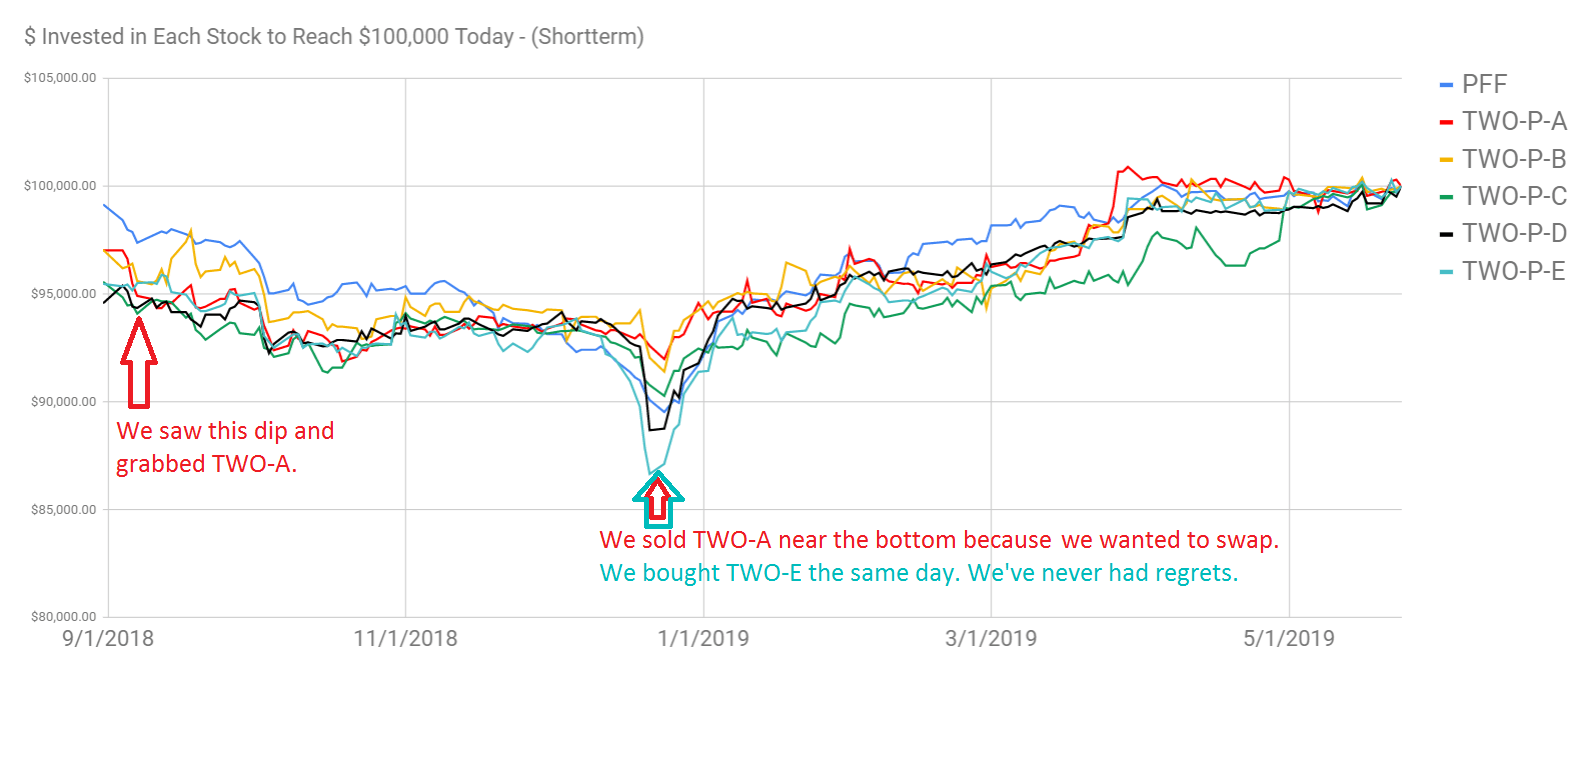
We dropped shares of TWO-A to free up cash so we could cover our order to buy shares of TWO-E. It's unusual to get such a great opportunity to swap between two preferred shares from the same REIT, but the market offered that opportunity. The three shares that fell the least were TWO-A, TWO-B, and TWO-C, each has a floating rate. Shares of TWO-D and TWO-E each had a fixed rate, yet they went on the better sale.
That becomes pretty easy to understand when you look at a quick comparison:

Shares of TWO-A carried an annual payment of $2.03 compared to the $1.88 for TWO-E.
An initial investment of $26,450 on 9/12/2018 would have generated $2,031.25 in dividend income annually. An investor allocating $26,450 would have been choosing between 1,000 shares of TWO-A and 1,056.3 shares (pretend they can buy fractional shares) of TWO-E.
On 12/21/2018, 1,000 shares of TWO-A were only valued at $25,500 rather than $26,450. By swapping into TWO-E at this point, an investor could trade out their 1,000 shares of TWO-A and acquire 1,143.5 shares of TWO-E.
Note: We had purchased shares of TWO-A on 9/12/2018, sold them on 12/21/2018, and immediately used the cash to cover our purchase of TWO-E on 12/21/2018. The example above isn’t abstract, it was a trade we made and communicated to subscribers throughout the process. We’ve rounded to using 1,000 shares for the example to make the math easier.
We sent a buy alert to subscribers at the same time:

Such swapping isn’t necessary, but it can work very well to enhance total income on the portfolio and total returns over time.
The investor wouldn’t even necessarily take a hit on taxes. While we like to use preferred shares within tax-advantaged accounts, an investor selling the share at a loss would be recording a taxable loss to purchase a different investment. If they remained in the second position, they would be recording the taxable loss from the first sale but not recording the taxable gain on the other side (unrealized gain). This technique is called “loss harvesting.”
Lessons from Lower Volatility
Investors looking for superior returns in preferred shares should look to cut out the ETFs. By picking individual preferred shares they can eliminate the expense ratio. They also can carefully monitor against call risk. While this technique can reduce diversification, it has not demonstrated increased volatility. Even though the diversification is lower, the average quality of the shares can be materially higher.
Beyond picking individual shares, investors can also monitor their positions relative to other preferred shares from the same REIT. A sudden change in relative prices can create incredible opportunities. We demonstrated this in practice during December 2018 by swapping shares of TWO-A for shares of TWO-E. Even though the price was down for our investment in TWO-A, we were able to acquire far more shares of TWO-E than before. Such opportunities are often short-lived, so investors need to be ready. We monitor the market on a consistent basis to spot those opportunities, but any investor can do that. You'll just need to know the relative quality of many preferred shares and be able to check valuations each day. Alternatively, you could find someone to assist in the process. That’s a service we regularly provide for our subscribers. You have plenty of other things to do.
Part 7: Exposure to interest rates

Many investors who are new to preferred shares may be concerned by the potential for preferred share prices to drop if interest rates increase. While that risk exists, it is actually a much smaller risk than investors think.
If the 10-year Treasury yields 1.5%, would you rather have a steady 7% dividend yield? Most of us would.
If the 10-year Treasury yields 2.5%, is that enough to replace your steady 7%? No, it isn’t.
Even if the 10-year Treasury climbs past 3%, would that replace your steady 7%? No, it still wouldn’t.
Let’s take a look at a period where interest rates became extremely volatile.
In May of 2013, we had the Taper Tantrum. Ben Bernanke made a few comments regarding the possibility of reducing the rate at which the Federal Reserve was buying bonds. Now we have members of the Federal Reserve talking about their plan to wind down the balance sheet but the movement in rates isn't so substantial.
So what happened to AGNC Investment Corp. (AGNC) in a mere two months? From 04/30/2013 to 07/01/2013 the share price collapsed from $33.31 down to $22.80. See the charts below:

Second chart:

Fair values collapsed by nearly 33% in two months and the ending price for that measurement of $22.80 is materially better than the 52-week high of $20.43.
If you were a buy and hold investor that bought on April 30th thinking shares were on sale simply because they were down around 6% since their previous high in 2012, how would those returns look?
Using dividend-adjusted close, we can easily simulate the returns for an investor reinvesting all their dividends. That close of $33.31 is $19.49 in dividend-adjusted close. Or in other words, the investor earned 3% in total return, assuming no taxes, as their reward for nearly 4 years. To earn their investment back after the loss, they needed to achieve a 48% total return. If they were counting on the dividend to return that capital, the multiple cuts that followed were a huge problem.
I am quite confident there were some analysts at that point still reinforcing the view that "these are just paper losses".
Analysis Near Taper Tantrum (Note: Tantrum Begins 5/22/2013 and takes off 6/19/2013)
In late April 2013, we have an "analyst" touting AGNC as "A Good Safe Haven Choice"
"AGNC had a book value at the end of Q4 2012 of $31.64. The stock price as of the close on April 16, 2013 was $32.34. This is close enough to the book value for AGNC to still be a good buy."
Ouch, that piece was encouraging lambs right into the slaughter. No position in the stock for the analyst. To the analyst's credit, he didn't tell them to sell at a huge loss after he was wrong. On the other hand, being stuck in a bullish mode 100% of the time isn't a remarkable achievement either.
Here is another highlight leading up to the taper tantrum: "Do Not Panic Out of American Capital Agency"
"I'd caution people not to over-react after a single quarter from this company. The shares had been trading at a premium to BV, and likely should never have traded as close to $37 as they did. However, if shares are to trade at a more reasonable 1.1x book, the stock gets back to $31.90, yielding almost 16%. Not a bad investment, given the low rate environment."
That was May 6th. On May 7th, shares closed at $30.89. Hey, they were within about a buck of his target price and a 1.1x ratio for trailing book.
It isn't just those two analysts. Coverage was overwhelmingly bullish. The shares traded at a material premium and investors felt they were getting a great bargain on a safe investment despite high leverage and low hedges.
Compare That With AGNCP
The preferred series of AGNCP was the one AGNC already had outstanding. History for AGNCB isn't long enough for this analysis.
Leading into the taper tantrum, AGNCP traded at $26.70. That was a big premium to call value, so it should've been decimated right?

We take a look at the next chart and see the decimation wasn't there:

Shares fell by about 5.5% (less than 4% after adjusting for the dividend). Scary? By early 2014 we were seeing price spikes touching similar values and by 2015 shares were regularly hitting in the middle of the $26 to $27 range again. So the investor in the preferred stock ends up seeing a full price recovery (lower prices today reflect the lack of call protection) while collecting a yield of nearly 8%.
How can that happen?
When interest rates increase rapidly, traders often dump their shares in preparation for a larger decline. As rates stabilize, it becomes clear that the shares still offer a very compelling yield.
If the 10-year Treasury offered a 7% yield, that would make the 7% preferred shares less attractive. For some investors, the lower tax rate on REIT dividends relative to interest would still be appealing. Others may prefer to have the Treasury. Realistically, the odds of 7% on the 10-year Treasury within the next decade are extremely small. If investors want to hedge against rising rates, the FTF (fixed-to-floating rate) preferred shares are an excellent tool.
Part 8: Dividend Captures

Dividend capture techniques end up confusing many investors. There are simply too many misconceptions about how dividend captures work. It is time to clear up those misconceptions!
Fundamentally, a dividend capture has 3 steps:
- Buy the shares before the ex-dividend date.
- Hold the shares at least until the morning of the ex-dividend date.
- Sell the shares for a price similar to the purchase price.
While the concept is three straightforward steps, many investors struggle to execute the technique. Since every dividend capture can be a little bit different, it helps to run through several examples. All of these examples will use preferred shares. We’ve found common share prices are too volatile and thus require too much luck. We don’t want to depend on luck, so we need shares with less volatility, but they still need to have high dividend amounts. Preferred shares can fit this description perfectly.
There are four main factors that can come into play during a dividend capture:
- Everything goes perfectly.
- The delayed exit
- The early entry
- The sector decline (can bust the play)
We will run through examples of each scenario from our own trading history.
Perfect Execution
These can be quite rare, but they do happen. In perfect execution:
- We buy shares shortly before the ex-dividend date.
- The shares go ex-dividend.
- We sell the shares either on the ex-dividend date or within a few days after that date.
To demonstrate how these trade worked, we will use charts whenever possible. Let’s get familiar with the table:

You’ll see the ticker on the left-hand side.
Next to it (in the blue box), you’ll see our transaction dates. In the first example, we only held the shares for four days. This is quite rare. Many examples will last 20 to 40 days.
On the right-hand side (in the red box), you’ll see:
- The price we paid (labeled cost)
- The price when we sold shares (labeled sale price)
- The dividends we earned (labeled dividends)
- The total return in dollars and cents (labeled Total Return $)
- The total return in percentage terms (labeled Total Return %)
We have 5 examples of dividend captures going perfectly:

In each of these 5 cases were able to buy the shares within 30 days of the ex-dividend date and sell them very promptly. These are the ideal scenarios.
Example 1: NLY-D
Shares of NLY-D (NLY.PD) were available for $25.27 just prior to the ex-dividend date. We expected them to trade above $25.00 following the ex-dividend, so we entered into a position. When we sold shares for $25.10, we had already locked in the dividend of $.47.
Because we gained $.47 from the dividend but lost $.17 in the share price, we had a total return of $.30.
This is a good time to point out that a very quick dividend capture will usually involve a small loss on the share price. That is okay. We measure success by looking at the total returns and the time period. A return of 1.18% in 4 days is outstanding.
This is an important aspect in “risk-adjusted returns”. We are usually using securities with low volatility and we have shorter holding periods. We want to earn a high annualized rate of return, but we don’t want to take much risk in the process.
To help readers get a deeper understanding, we will be pulling out price charts for several of these trades. We find the images can help investors see what factors were going into an individual trade.
This is the price chart or NLY-D from 11/15/2018 through 12/04/2018 and includes commentary to help investors understand the symbols:

Example 2: NYMTN
NYMTN (NYMTN) went perfectly, though it carried more risk than the example with NLY-D. We were able to achieve an excellent return of 3.99% in only 22 days because we captured the dividend and an increase in the share price.

We didn’t get the absolute best prices on purchasing or selling, but we did quite well. When a great dividend capture has played out, we don’t want to be greedy. We take the gains and move on.
Example 3: ANH-C
ANH-C (ANH.PC) lasted only 24 days and was similar to NLY-D. The price declined from $25.19 to $25.08, but we earned a dividend of $.48. The net result was a gain of $.37 per share. Some investors will think $.37 per share isn’t enough, but that depends on how many shares you’re able to trade. If the investor can move 1,000 shares, the profit would be $370.00.

Example 4 and 5: ARI-A
ARI-A shows up twice.
We purchased shares on 5/30/2017 at $25.66.
A week later, we decided to buy additional shares at $25.76. Shares climbed higher before the ex-dividend date, but we expected at least a 1% decline on the morning shares were ex-dividend. Instead, we had an opportunity to sell the shares in the $25.96 to $25.97 range.
We jumped on the opportunity.
We can’t pull up a price chart for ARI-A today because the shares were called. However, we published an article for subscribers on 6/29/2017:

In that article, we wrote:
“Shares of ARI-A were a great option for quite a while. I highlighted them week after week saying investors should look to enter despite the premium to call value. This was going to be a great play leading into the ex-dividend date.”
We included the following chart:

Shares went ex-dividend but were still trading right around $26.00. That was a great opportunity to close out the dividend capture and we pulled the trigger.
The Delayed Exit
One of the frequent modifications to make in the dividend capture is to delay the exit. When the market is not offering us a high enough price immediately after the shares go ex-dividend, we simply hold on for a bit.
Let’s review 4 examples of the delayed exit:

In each of these instances, we bought shares within 30 days of their next ex-dividend date. However, each time we ended up staying in the shares for a little longer.
Example 6: AGNCP
Shares of AGNCP (AGNCP) were purchased at $25.97 and sold at $25.92. The small decline of $.05 in the share price was more than offset by the $.50 from the dividend. These shares went ex-dividend at the end of September, but we held for about 3 more weeks looking for an improved price.
Example 7: NLY-F
Shares of NLY-F (NLY.PF) have been in our portfolio frequently. We entered this position at $25.06 which we felt was a great price. We would normally expect NLY-F to trade above $25.00. At this point, it also carried nearly 2 months of dividend accrual.
Shares of NLY-F usually go ex-dividend at the end of the second month in each quarter. That means February, May, August, and November.
Some investors refuse to ever pay more than $25.00 for a preferred share. We support being very careful about entry prices, but there are times when it makes great sense to pay a slight premium. This was one of those times.
After shares went ex-dividend at the end of February, we decided to hold onto them a little longer. By the time we closed the position, shares were up to $25.35 and we had one dividend secured. That was 2.89% for 55 days. It’s longer than the typical dividend capture, but the returns justified it.
As you can see in the chart below, we continued to hold this position after the ex-dividend date. For the first week or so, the price was too low to close out the trade:

Example 8: NLY-E
We bought NLY-E (NLY.PE) with less than 2 weeks to go before the ex-dividend date. We paid a significant premium at $25.63 but expected the shares would continue to trade at a significant premium after the ex-dividend date. We delayed our exit for several weeks and were able to sell the shares at $25.76. That represents a gain of $.14 on the price to go along with $.48 in dividends. Thanks to the impact of rounding, it came out to $.61 rather than $.62. The return was 2.37%, but it took 63 days. That’s longer than we expect a dividend capture to take and it dragged down the annualized rate of return to 13.7%.
Example 9: DX-A
We entered DX-A (DX.PA) about a week before the ex-dividend date. The price wasn’t great, but we were confident shares would continue to exhibit strong pricing. After shares went ex-dividend, we felt we could still get a little more upside. We hung onto the shares and saw that rally come through. We sold into strength and got a solid exit price:

The Early Entry
Sometimes the best dividend capture opportunities develop further in advance. While it is nice to purchase shares very shortly before the ex-dividend date, we still want to keep our eyes open during the other months. In these examples, we purchased shares more than a month before the ex-dividend date.

Both examples took 77 days, but that is merely a coincidence. We’re using examples of shares we purchased early and held for one dividend, so the trades being similar isn’t much of a surprise.
In each case, we entered early due to prices we considered excellent. We didn’t know for sure if they be dividend captures, but we knew we liked the prices. This is often how the “Early Entry” opportunities develop.
After shares went ex-dividend and saw a healthy increase in the share price, we closed out the positions.
Example 10: NLY-C
These shares were sold very shortly after their ex-dividend date to free up some capital for other opportunities. We found them quite attractive at $23.87, but the opportunity to sell at $24.78 immediately after the ex-dividend date was enough for us to take the gains and walk away.

Example 11: DX-A
DX-A (DX.PA) was trading at a nice discount to call value and carried a higher yield than the risk level justified. We bought shares because they were simply a great deal. After the shares went ex-dividend, we decided to hold on a little longer to see if the price would rally. We waited about 2 weeks before selling. If we had waited longer, we would’ve earned more. However, we were happy with the returns and decided to close out the position:

The Sector Decline (Busted Plays)
For any investor, there will be times when the sector declines. Every sector declines at some point. What happens when a sector decline occurs while we are in the middle of a dividend capture?
We have two examples where that happened:

Investors looking at the prices on these shares might think the plays became “busted” because we paid too large of a premium to call value. That isn’t the reason.
What happened? The equity market was declining and preferred share indexes sold off hard. During that same period, the iShares U.S. Preferred Stock ETF (PFF) saw their price decline dramatically between September of 2018 and late December of 2018:

Example 12: AGNCB
AGNCB (AGNCB) was purchased just before the ex-dividend date. We expected to be in and out quickly but were waiting for a slightly better exit price. Instead, we saw a sector decline intensify. We closed out the position in December for a positive return of only .13%.
During that same time period, PFF declined from $37.06 to $33.58, only partially offset by $.73 in dividends.
The total return on PFF during this period was negative 7.42%. Of course, an investor in PFF could’ve chosen not to sell on that day to avoid the loss. However, they still faced a substantial opportunity cost. Their capital was already invested. By avoiding a loss in the share price, we were in a dramatically better position to reinvest:

We could’ve simply stayed in the shares, collected another dividend, and continued to hold on. However, we were witnessing several investments go on exceptional sales. We closed out the position because we wanted to reinvest the cash in cheaper securities.
Because we picked a preferred share with a lower risk level and a reasonable entry price, we performed much better than the sector during a major decline. That left us free to reinvest. An investor holding PFF would’ve been stuck either eating a substantial loss or holding on and missing out on other opportunities.
Example 13: TWO-A
We paid a significant premium to call value for TWO-A (TWO.PA). The shares have call protection on the calendar for several years, a high yield, and they switch over to a floating rate after call protection ends. Despite the large premium to call value, we decided to go for it.
We could’ve exited this play right after the shares went ex-dividend, but decided to stay in and look for a slightly higher price. Instead, we saw prices falling lower.
The fundamental issue was precisely the same. It is no coincidence that these two busted plays happened across the same period. When the sector hits a decline, that is when busted plays are most common. However, both AGNCB and TWO-A fell by far less than the index ETF. That is one of the advantages of using higher-quality (lower-risk) preferred shares for these opportunities. They are usually less exposed to a sector decline.

As you’ll see in the next section, we placed that sale to enable a transition into TWO-E.
When to Close Out a Busted Trade
If you’re open to dividend captures, by definition you must also be willing to place some trades. Investors willing to place a few trades should be interested in evaluating several similar preferred shares issued by similar REITs. They should also be considering each series of preferred share against the other series.
When we closed out our position in TWO-A, we were also acquiring a large position in TWO-E (TWO.PE). TWO-E was on an exceptional sale.
We utilized the same chart again for TWO-A, but this time we’ve turned it into a comparison chart. The blue line still tracks TWO-A, but we’ve added a black line to track shares of TWO-E:

TWO-A had certainly sold off, but it was a tiny decline compared to a massive sale appearing in shares of TWO-E. We are huge proponents of relative value. We were comfortable owning preferred equity in Two Harbors (TWO). However, we wanted to monitor the values across each of their preferred shares. When we bought TWO-A, we liked the relative value. When we sold shares, they were significantly less attractive than TWO-E.
We highlighted this same trade much earlier in the guide. We won’t ask you to recall it, you’re about 50 pages into the guide already (depending on font).
Let’s recap how we described it:
“We dropped shares of TWO-A to free up cash so we could cover our order to buy shares of TWO-E. It's unusual to get such a great opportunity to swap between two preferred shares from the same REIT, but the market offered that opportunity. The three shares that fell the least were TWO-A, TWO-B, and TWO-C, each has a floating rate. Shares of TWO-D and TWO-E each had a fixed rate, yet they went on the better sale.
That becomes pretty easy to understand when you look at a quick comparison:

Shares of TWO-A carried an annual payment of $2.03 compared to the $1.88 for TWO-E.
An initial investment of $26,450 on 9/12/2018 would have generated $2,031.25 in dividend income annually. An investor allocating $26,450 would have been choosing between 1,000 shares of TWO-A and 1,056.3 shares (pretend they can buy fractional shares) of TWO-E.
On 12/21/2018, 1,000 shares of TWO-A were only valued at $25,500 rather than $26,450. By swapping into TWO-E at this point, an investor could trade out their 1,000 shares of TWO-A and acquire 1,143.5 shares of TWO-E.”
Example 14: TWO-E
When the preferred share sector bounced back, we enjoyed a substantial gain on shares of TWO-E:

We had a loss of 1.67% in shares of TWO-A, but we enjoyed a 10.49% rebound through shares of TWO-E.
The idea in closing out a busted play is to monitor similar investments. Frequently ask yourself:
“Is there a similar alternative that offers a superior value?”
That is the question which caused us to pick TWO-E instead. We issued a buy alert for TWO-E:

The chart below demonstrates the purchase and sale of TWO-E:

Two Ways to Evaluate a Trade
There are two major methods to evaluate the performance of a trade:
- Absolute Performance - which evaluates one trade in isolation.
- Relative Performance - which evaluates a trade compared to the sector.
Both methods are important and investors should be familiar with both. Looking only at one or the other is leaving very important information on the table. We always look at both sides, but so far we’ve been focusing only on the “Absolute Performance”.
Absolute Performance
Each of the trades was measured using absolute performance because it is the first method investors should know. Investors need to be able to calculate total returns. In dividend captures, our primary focus is on Absolute Returns. We want to slip in and out with a very high annualized rate of return.
Relative Performance
While our primary goal is measured in Absolute Returns, we still want to keep an eye on the sector. As the “Busted Trades” section demonstrated, we were willing to close out our positions because the indexes had plunged. One of the metrics we regularly use to evaluate our trades is the performance of PFF. We want to know if our idea is outperforming PFF.
PFF as a Benchmark
PFF is a viable benchmark because it is filled with preferred shares, the price and dividend are easily identified, and many investors choose to invest in it. We want to know if our choices are performing better than an investor who simply buys shares of PFF on the same day. When returns are measured against PFF, it can change the perspective on which trades were best.
In the following chart, you’ll see the 14 trades we’ve discussed so far (for the dividend capture section):

Trades 12 and 13, AGNCB and TWO-A, had the lowest total returns out of the 14 trades. However, they demonstrated the greatest level of outperformance relative to PFF. Despite their weak total return performance, they were sheltering investors from a storm in asset prices. The sector, as well as the entire stock market, was declining rapidly.
By contrast, in Trade 14 we saw the largest total return at 10.49%. That was an exceptional return for a trade that lasted under a quarter. However, it only outperformed PFF by 1.36%.
Part 9: Dividend Capture FAQ

What Other Major Concepts do Investors Need to Know?
If an investor wants to engage in dividend captures, there are a few important concepts to know:
- What does “Stripped Price” and “Stripped Yield” mean?
- How do you minimize tax factors?
- What is the role of cash in a portfolio?
- What connection is there between common shares and preferred shares?
- What impact do interest rates have on preferred shares?
- What is wrong with paying high expense ratios?
- How do you cover trading commissions?
- Why don’t you just focus on yield and ignore prices?
- How should you evaluate price movements?
- How close to the ex-dividend date do you put in a buy offer?
- How many bids do you submit and how do you decide on the price?
- How often has this worked?
- How much of the dividend do you aim to capture?
- Are the volumes high enough for readers to trade?
- Is there enough volume to sell after shares go ex-dividend?
- How often do such opportunities occur?
- How do you select dividend capture opportunities?
- How can anyone ever track all those factors?
- How do you share that research?
Stripped Price and Stripped Yield
The stripped price is simply the share price minus the dividend accrual. For instance, if the shares trade for $25.25 but carry $.45 of dividend accrual, then the stripped price is $24.80.
There are a few ways to calculate stripped yields, but we advocate for the simplest one. Dividend the current dividend rate by the stripped price.
For instance, if a share pays $2.00 in dividends per year and costs $25.25 the regular yield is 7.92%. However, if the stripped price is $24.80, the stripped yield is 8.06%.
How do You Minimize Tax Factors?
Many investors following this kind of strategy choose to use their IRAs or 401k accounts. These tax-advantaged accounts will generally eliminate the potential for tax issues. We avoid any preferred share whose dividend isn’t “IRA friendly”. There are plenty of options we can pick where the dividend is safe inside tax-advantaged accounts like the IRA or 401k. There is no need to pick shares that don’t benefit from these types of accounts.
What is the Role of Cash in a Portfolio?
When investors are performing dividend captures, they will often have a higher average cash balance in their accounts. That isn’t inherently a problem. We can utilize that cash to leave some low-ball limit-buy orders open. Having cash in the portfolio also tends to smooth out the value over time as it reduces total volatility. Our portfolio often includes a cash balance between 3% and 9%.
What Connection is There Between Common and Preferred Shares?
Great preferred share analysis requires an understanding of the company. The most important aspect to understand is their credit quality. We want to evaluate the risk within the shares. Investors who refuse to pay any attention to the common stock often end up lacking knowledge about the level of risk in the preferred shares. However, the correlation between preferred shares and common shares usually isn’t too high.
What Impact do Interest Rates have on Preferred Shares?
We’ve found a rapid increase in Treasury yields will push preferred share prices lower. That isn’t too surprising since most preferred shares don’t have a maturity date. If you could get a higher coupon rate on a Treasury than the preferred share, why would an investor want the preferred share?
Treasury yields would have to rise dramatically for them to be remotely close to the yields offered on the preferred shares we cover. Most of the preferred shares we’re watching have yields between 6.8% and 8.2%. Whether the 30-year Treasury rate is 2.6% or 3.0%, the spread between that Treasury yield and the preferred share yield is huge.
It is critical for investors to understand this concept. If Treasury yields are rising rapidly, we expect temporary pressure on preferred share prices. If the momentum stops, we’ve found the preferred share prices usually recover over the subsequent months.
30-Year Treasury yields at 3% wouldn’t justify much weakness in preferred share prices. However, a rapid increase from 2.6% to 3% could scare investors because of the momentum. We want to monitor these factors on a frequent basis so we can update our outlook and issue an alert to subscribers if we see the tide turning.
What is Wrong With Paying High Expense Ratios?
This is one of the most common questions. It seems strange to us, but it comes up frequently. Why shouldn’t an investor just pick an ETF with a high expense ratio and trust the managers to cover a high yield? Why wouldn’t they want to bet their retirement on that?
For a fund to have a high yield and a high expense ratio, it needs to take on a substantial amount of credit risk. When expense ratios are low, they have a fairly minor impact. However, higher expense ratios can create a major drag on performance. Either the portfolio managers will have to take on more risk or pay a lower yield. In our experience, it is more common to see investors piling in for high yields with no grasp of the risk involved.
We included a chart showing how PFF performed over the same periods. We pick individual securities because we’ve found that we can usually reach superior returns that way. There is no guarantee that we will achieve superior returns in the future, but we’ve done it quite consistently in the past.
How do you Cover Trading Commissions?
We put several of these trades through while paying commissions. However, most brokers will process trades with no commission today.
Why Don’t You Just Focus on Yield and Ignore Prices?
Our goal is to generate superior total returns. Whether we generate returns through the dividend or the change in price, we want to keep driving up the total value. With these positions frequently going to cash, we have the opportunity to invest frequently. Investors who only look at the yield have a tendency to buy securities that go down in price. In some cases, they become so blinded by yield that they ignore warning signs. When their dividend gets cut, it is too late.
Both of these options are wrong:
- Focus on yield while completely ignoring the change in price caused by a change in fundamentals.
- Focus on the share price every day when you have no intent to place a trade.
Instead, we want to evaluate both the yield and share price over time with a constant eye on the relative values. Remember that relative values were at the heart of our decision to trade TWO-A for TWO-E.
Investors who want to grab shares with a 10% yield and ignore the price movements are not going to care for our service. They will often end up buying poor quality and hanging on with a desperate hope for improving fundamentals. They are taking on extremely high levels of risk. We don’t like risk. Our disdain for risk is one reason we like the dividend capture strategy. When we are holding cash for a bit, we are taking on less risk.
How Should You Evaluate Price Movements?
Chart the performance of the share relative to other investments. Include other preferred shares from the same REIT, preferred shares from similar REITs, and PFF. The goal is to generate positive returns, but we should never ignore the rest of the market. If we’re looking at a small loss while the rest of the market is getting creamed, we should be thankful for the outperformance. It gives us an opportunity to reevaluate and decide if we would rather be in a different share.
The best example here is to go back to the example of TWO-A and TWO-E.
On 9/12/2018 an investor could purchase 1000 shares of TWO-A for $26,450. Alternatively, they could invest that same amount to acquire 1,056 shares of TWO-E.
When we went back to the trade and swapped the positions on 12/21/2018 the relative values had changed dramatically. The market would allow an investor to trade 1,000 shares of TWO-A for 1,143 shares of TWO-E.
We would rather have 1000 shares of TWO-A than 1,056 shares of TWO-E. However, when we can swap for 1,143 shares of TWO-E, that’s a very different scenario:

Even for the investor focused on generating income, this was a huge swing in relative values. 1,000 shares of TWO-A would still pay $2,031 in annual dividend income. However, the market was offering investors a much better opportunity in TWO-E at this point.
We still don’t want to focus exclusively on dividend income, but income investors should still heed the lesson here. Because we picked TWO-A instead of TWO-E in September, we had an opportunity to swap in December. If we had picked TWO-E in September, we would’ve locked in a weaker yield.
Even though we were looking for opportunities to gain on the share price, this difference in the income levels was very important. It was part of our reasoning for why shares of TWO-E were likely to spike higher in price over the coming months.
How Close to the Ex-Dividend Date Do You Put In a Buy Offer?
We may attempt to buy the security up until the evening prior to the ex-dividend date. If shares open extremely weak after the ex-dividend date, we would be fine stepping in to buy.
How Many Bids Do You Submit and How Do You Decide On The Price?
The number of bids can vary. We use the fundamental factors to establish an attractive price range for the share. To nail down my exact bid price, we will incorporate the recent trading history. We find the data on recent trading on history can help us to nail down the lowest prices where we would still have a reasonable chance at execution.
How Often Has This Worked?
Dividend captures are inherently a play in inefficient markets. Theoretically, the success rate should be low. In practice, my success rate has been extremely high. Success rates are going to be different from one investor to the next. If we rate success by a $0.05 gain per share on a dividend capture then my success rate is near perfect. Personally, I look for a 1% gain when looking at dividend captures. If we rate success by 1%, then my success rate is still excellent, but not perfect.
It is important to point out that each investor will have different results. Many investors who choose to “go it alone” (without the help of any analyst) have reported poor results. It is clear to us that investors who pick blindly are unlikely to create an excellent record. We’re not successful 100% of the time either, yet we’ve succeeded the vast majority of the time.
How Much of the Dividend Do You Aim to Capture?
Generally, we are looking to capture about half of the dividend amount. The other half can be used to offset the decline in the share price. On a $.50 dividend, we are looking for a high probability to capture at least $.25. If shares are $25.00, that would represent a target of at least 1%.
Are Volumes High Enough for Readers to Trade?
Investors should stick to limit orders. Occasionally, I have seen a bump following the public release. It’s not a consistent impact, but it might happen when more investors find out about a solid opportunity.
Is There Enough Volume to Sell After Shares Go Ex-dividend?
Volume following the ex-dividend date can vary dramatically between securities. Occasionally, I need to hold the position for an extra week or two while the price normalizes. If you’re choosing different shares, you’ll need to check on the volume yourself.
How Often Do Such Opportunities Occur?
I usually find at least 1 to 2 dividend opportunities in a quarter. Sometimes there are materially more. Most of the preferred shares will either go ex-dividend at the end of the second month in the quarter or the end of the third month in the quarter. Consequently, there can be some overlap between the opportunities.
How Do You Select Dividend Capture Opportunities?
I follow a large group of preferred shares. We don’t use this technique with common shares. The liquidity is much higher on common shares and the volume is much higher along with it. If these techniques worked on common shares, the hedge funds would eliminate them. The preferred shares are a much smaller niche and it is much more difficult for a large hedge fund to come into the sector.
Most of the preferred shares are issued by companies within the same niche (mortgage REITs). I consider the prices history along with several fundamental factors relating to the securities' risks. For example:
- Where is a normal price range for the preferred share to trade?
- How much call protection does it have?
- What do I think of the underlying portfolio?
- What are the stripped yields and yield to call?
- What is the current macroeconomic environment and how does it affect bond prices?
- How much of the company is financed through the preferred equity?
- Do I believe the security is primed for a dividend capture?
The answers to those questions depend on the individual security and the price at the time we are asking the questions.
How Can Anyone Track All Those Factors?
Another objection we occasionally hear is that it would take an inhuman amount of time to comb through the securities and watch for these opportunities. We agree entirely. For most retail investors, this simply wouldn’t be viable. Yet we do it on a consistent basis.
There are major economies of scale at work here. We can afford the time to research these factors because we use them regularly and because we provide a subscription research service. Researching REITs (both common shares and preferred shares) is our full-time job. We find opportunities and highlight them for subscribers. This is the only way to get a sufficient scale on the immense amount of time required.
Conclusion
The intent of this article was to give investors a bigger picture of preferred shares and baby bonds. I've had great success with these two securities. I proactively follow dozens of preferred shares and baby bonds for subscribers. My price targets change regularly based on the underlying companies and macroeconomic changes. It's my job to find the best deal for subscribers.
If you have a question about preferred shares, please leave a comment. It’s an opportunity for us to answer the question for several readers. Surely there are some topics we will have glossed over too quickly. After all, this guide is only 67 pages long so far (depending on font).
Member discussion