
Scott Kennedy’s mREIT And BDC Earnings Series: Assessing Rithm Capital’s And Ares Capital’s Performance For Q4 2023
Introduction section by Colorado Wealth Management Fund.
Article section by Scott Kennedy.
Bringing More of Scott’s Work to Our Website
The REIT Forum is a service produced by Michael Vanloon (better known as Colorado Wealth Management Fund) and Scott Kennedy. After intense consideration, I decided to launch our service through Substack. Since then, we’ve seen great success. Substack enables us to give readers real-time alerts with entire articles delivered directly to their inboxes.
If you appreciate our research and are new to the website, please sign up for alerts when we publish articles. It’s the only way to know when we provide new analysis through our website.
Finding Our Positions
I posted a subscriber-exclusive article with links to our Google Sheets. You can always access our positions there. Scott’s positions are updated each week. CWMF’s positions are usually updated on the same day as the trade.
Disclosures
Related to the stocks in this article:
CWMF is long: RITM-D, GPMT-A, DX-C, EFC-A, RITM-C, EFC-B, PMT-C, AGNCP, CIM-D, RITM-B, RITM, SLRC, GPMT, RC.
Scott Kennedy is long: RITM, RC, SLRC, GPMT, ARCC, GBDC, RITM-D, MITT-B, MITT-C, GAINL, ECCC.
The rest of this post is from Scott Kennedy.
Summary
- This 9th earnings assessment article reviews RITM’s and ARCC’s BV/NAV and adjusted core earnings/core earnings performance during Q4 2023.
- RITM’s BV was a minor-modest outperformance while its adjusted core earnings matched my/our expectations. ARCC’s NAV matched my/our expectations while its core earnings was a minor outperformance.
- RITM reported a less severe decline in BV versus my expectations. Apparently, with today's sell-off, the market did not understand that RITM was going to report a quarterly BV decrease.
- ARCC reported another good quarter and continues to maintain notable undistributed taxable income. I was a bit disappointed RITM did not provide any definitive updates/timeline regarding the likely upcoming spin-off.
- No change in RITM’s and ARCC’s percentage recommendation ranges or risk rating. RITM is currently deemed undervalued (BUY). ARCC is currently deemed appropriately valued (HOLD).
Introduction:
Hi subscribers. For new members, my name is Scott Kennedy and currently I fully cover 20 mortgage real estate investment trust (mREIT) and 15 business development company (“BDC”) common stocks within this Investing Group regarding research/data, subscriber questions, weekly projected book values/net asset values (BV/NAV), and common stock recommendation ranges. Colorado (“CO”) Wealth Management handles the mREIT preferred stocks and he and his team handles all other applicable REIT sectors outside the mREIT sector. CO also provides some mREIT common stock and BDC articles from time-to-time which are more of an “overview/introduction” discussion; typically based either on my or our combined research/data. This also includes some macroeconomic trends and data. My name is always attached to all Investing Group articles I personally wrote so there is no confusion for subscribers.
This REIT Forum article is part of a series of articles over a span of 6-7 weeks which will analyze my previously projected BV/NAV and core earnings (or core earnings equivalent)/net investment income (“NII”) figures and compare these metrics to each mREIT’s and BDC’s actual reported results, respectively. For readers who are familiar with my public mREIT and/or BDC articles, these types of articles are beneficial to readers who desire to pursue a more active investing strategy and/or want more “real time” thoughts/analysis.
I hope my services/contributions ultimately help enhance a subscriber’s total investment returns or minimize their total investment losses within the mREIT and BDC sectors. At the very least, I hope subscribers will gain more insight into the mREIT and BDC sectors by reading my/our exclusive REIT Forum articles.
1) RITM’s BV and Adjusted Core Earnings Q4 2023 Performance (Projected Versus Actual Results):
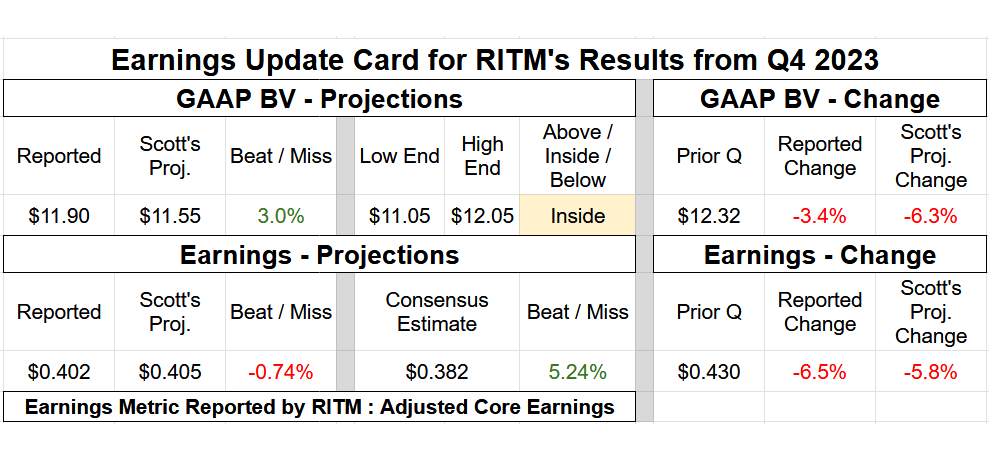
On 2/7/2024, Rithm Capital Corp. (RITM) reported the company’s earnings results for the fourth quarter of 2023. Table 1 below provides RITM’s BV and earnings summary.
Table 1 – RITM Q4 2023 BV and Earnings Summary
Source: Taken Directly from the REIT Forum’s © Analytical Spreadsheets/Data
I provided the following commentary in regards to RITM’s results for the fourth quarter of 2023:
“Hi subscribers. I was able to review RITM’s Q4 2023 earnings results. RITM reported a BV as of 12/31/2023 of $11.90 per common share (3.4% decrease) versus my prior projection of $11.55 per common share (6.2% decrease). I consider this a minor - modest (at or greater than a 2.5% but less than a 5.0%) outperformance and was within my $11.05 - $12.05 per common share range (towards the top end). As such, when compared to my expectations, a good quarter for RITM regarding quarterly BV fluctuations (less severe decrease). Let us discuss RITM’s BV outperformance versus my expectations.
Going over each income statement account/sub-portfolio, RITM’s minor - modest BV outperformance was scattered amongst gains within the company’s originations platform, valuation fluctuations within its mortgage servicing rights (“MSR”) and agency mortgage-backed securities (“MBS”)/non-agency MBS/residential whole loans/commercial sub-portfolios, and more enhanced accretive impacts of the Sculptor Capital Management (SCU) acquisition. Along with reconciling RITM’s quarterly BV outperformance, let us discuss some metrics within some of the company’s underlying sub-portfolios.
First, as correctly anticipated, RITM’s originations sub-portfolio had a minor decrease in quarterly volume when compared to the prior quarter. That said, I still believe RITM’s late 2022 – early 2023 quarterly originations volume was the company’s trough/low point. RITM reported funded loan originations of $11.1 billion during the third quarter of 2023. RITM previously guided for funded loan originations of $7.0 - $9.0 billion during the fourth quarter of 2023. In actuality, RITM reported funded loan originations of $8.9 billion during the fourth quarter of 2023. When calculated, this was a quarterly decrease of ($2.2) billion or (20%). In comparison, I projected quarterly funded loan originations of $8.0 billion (using RITM’s prior mean guidance).
RITM basically maintained the company’s gain-on-sale (“GOS”) margins during the fourth quarter of 2023. RITM reported a GOS margin of 1.61%, 1.26%, 1.24%, and 1.23% during the first, second, third, and fourth quarter of 2023, respectively. When calculated, this was a quarterly GOS margin decrease of (1) basis point (“bp”) during the fourth quarter of 2023. In comparison, I anticipated a quarterly GOS margin of 1.05% - 1.25% (mean of 1.15%). So, when combining the slightly higher-than-anticipated quarterly originations volume and the slightly higher GOS margin, along with continued strong (albeit lower) loan originations within Genesis Capital, this ultimately resulted in RITM reporting a gain on originated mortgage loans of $98 million during the fourth quarter of 2023. In comparison, I projected RITM would report a gain on originated mortgage loans of $80 million. When calculated, this $18 million variance directly led to a BV outperformance of $0.04 per common share when compared to my expectations.
Second, along with a relatively unchanged sub-portfolio size and slight prepayment speed (technically called conditional/constant prepayment rate [CPR]) decrease, the company reported a slightly outperforming quarter within its servicing sub-portfolio when compared to my expectations (nothing “alarming”/notable though). This was similar to what occurred with PMT this quarter. RITM’s net servicing fee revenue was $482 million during the fourth quarter of 2023 which was an increase of $39 million when compared to the prior quarter. In comparison, I projected a slightly smaller increase to $475 million. As a reminder, even with quarterly MSR acquisitions, one has to also consider ongoing portfolio run-off. Regarding quarterly valuation fluctuations, RITM’s combined MSR sub-portfolio gain was a slight outperformance when compared to my projection. RITM recorded a MSR fair market value (“FMV”) net decrease of ($466) million during the fourth quarter of 2023. In comparison, I projected a MSR FMV net decrease of ($495) million. When broken out, RITM recorded a “pure” MSR sub-portfolio valuation decrease of ($331) million while recording quarterly amortization of ($135) million. In comparison, I projected RITM would record a pure MSR sub-portfolio valuation decrease of ($355) million while recording quarterly amortization of ($140) million. When calculated, this combined $29 million variance directly led to a BV outperformance of $0.06 per common share when compared to my expectations.
Third, continuing a trend from the prior quarter, RITM slightly increased the company’s highly liquid agency MBS sub-portfolio and continued to periodically call deals within the company’s non-agency residential MBS sub-portfolio. The continued increase in RITM’s fixed-rate agency MBS sub-portfolio was a bit of a surprise and directly led to some more enhanced valuation gains when compared to my expectations. As noted in my/our agency mREIT sector earnings notes/articles, fixed-rate agency MBS experienced notable price increases during November – December 2023. As such, adding to this sub-portfolio was the correct strategy to implement during the fourth quarter of 2023. RITM allowed roll-off within the company’s recently acquired consumer loans sub-portfolio (previously owned by an affiliate of Goldman Sachs) and slightly increased its single-family rentals (“SFR”) sub-portfolio. RITM slightly decreased the company’s business purpose loans (“BPL”) sub-portfolio.
As such, RITM experienced a minor total investment portfolio size increase during the fourth quarter of 2023. As implied above, the key here is most originations/acquisitions/purchases were at attractive – very attractive pricing while RITM’s existing investment portfolio continued to experience very low delinquencies. RITM very likely continued to utilize a fairly large net (short) “to-be-announced” (“TBA”) MBS position regarding the company’s derivatives sub-portfolio but likely lowered this position some during the quarter. I will have to confirm this assumption once the 10-K is provided. I will also have to review the notional fluctuations regarding RITM’s interest rate lock commitments and interest rate payer swaps. When considering all the valuation fluctuations within RITM’s fixed-rate agency MBS, non-agency MBS, residential whole loans, BPL, consumer loans, SFR, commercial mortgage loans/real estate, and derivatives sub-portfolios, the company reported a net valuation gain of $71 million. In comparison, I projected RITM would record a net valuation gain of $45 million. When calculated, this $26 million variance directly led to a BV outperformance of $0.05 per common share when compared to my expectations.
When these 3 variances are combined, along with a remaining $0.09 per common share BV outperformance within all remaining sub-portfolios and equity accounts (mainly a more accretive impact/higher bargain purchase from the SCU acquisition) and a core earnings outperformance of $0.107 per common share (adjusted core earnings underperformance of ($0.003) per common share which will be discussed next), this directly calculates to RITM’s BV outperformance of $0.35 per common share when compared to my expectations.
Moving on, RITM reported core earnings/earnings available for distribution (“EAD”) of $0.512 per common share for the fourth quarter of 2023. However, when excluding a one-time benefit of $0.11 per common share in direct relation to the sale of capital assets (including excess MSR) during the quarter, RITM reported adjusted core earnings/EAD of $0.402 per common share for the fourth quarter of 2023. Regarding excess MSR sales, these transactions are currently fully reversed out of taxable income and deferred back into taxable income over the remaining life of the applicable investments. In comparison, I previously projected RITM would report adjusted core earnings/EAD of $0.405 per common share. RITM’s adjusted core earnings/EAD was $0.430 per common share for the third quarter of 2023. As such, I projected a quarterly adjusted core earnings/EAD decrease of ($0.025) per common share. In actuality, RITM reported a quarterly adjusted core earnings/EAD decrease of ($0.028) per common share. The institutional analysts’ consensus average was adjusted core earnings/EAD of $0.382 per common share. Simply put, an “as expected” quarter for RITM on adjusted core earnings/EAD.
Overall, RITM’s minor decrease in quarterly adjusted core earnings/EAD was mainly due to the company’s minor increase in investment portfolio size (while continuing to keep credit risk “in check”) which was “trumped” by a decrease in net spread income (lower-yielding assets) and an increase in operational expenses (even outside one-time expenses in relation the SCU acquisition). For example, RITM reported general and administrative (G&A) expenses of $167, $182, $190, and $192 million for the first, second, third, and fourth quarter of 2023, respectively. In comparison, I projected G&A expenses of $190 million during the fourth quarter of 2023. When calculated, a $2 million outperformance. However, RITM reported employee-related expenses of $189, $190, $186, and $222 million for the first, second, third, and fourth quarter of 2023, respectively. This included transaction-related fees of ($22) million during the fourth quarter of 2023. In comparison, I projected employee-related expenses of $215 million during the fourth quarter of 2023. When calculated, a ($7) million underperformance. When both accounts are combined, this ($5) million variance directly led to an adjusted core earnings/EAD underperformance of ($0.009) per common share.
The remainder of RITM’s adjusted core earnings/EAD net outperformance of $0.006 per common share was scattered amongst the company’s remaining interest income, expense, and other reconciling accounts.
So, all-in-all, a minor - modest outperformance on RITM’s quarterly BV (variance of 2.8%) and basically an exact match on the company’s adjusted core earnings/EAD (variance of only $0.003 per common share). RITM continued to generate an attractive - very attractive adjusted core earnings/EAD during 2023. No other covered mREIT peer has accomplished this feat during this generalized rising interest rate environment. I would point out RITM’s adjusted core earnings/EAD continues to cover its quarterly dividend per share rate of $0.25 per common share (with a large “cushion”). That said, adjusted core earnings is NOT the same metric as estimated REIT taxable income (“ERTI”) which dictates annual minimum distribution requirements per the Internal Revenue Code (“IRC”). RITM’s ERTI remains lower than the company’s adjusted core earnings so that is an important notion to consider regarding its dividend per share rate (to remain non-bias). I continue to believe an unchanged dividend of $0.25 per common share is a “win” per se during the current environment.
Moving forward, the prior Caliber Homes and Genesis acquisitions should continue to benefit RITM as a whole. The same holds true regarding RITM’s more recent partial equity stake in GreenBarn, a subsidiary focused on investments in commercial real estate (again, thinking longer-term here). As such, RITM continues to diversify the business model into areas outside residential mortgages and mortgage-related investments. Regarding RITM’s recent acquisition of SCU, this is something that was extensively covered within this service. At this point, it remains a “broken record”. Simply put, RITM acquired assets at an attractive price (albeit at a less attractive price after a “bidding war”) and now has begun the company’s transition to also being an asset manager. SCU began contributing to the “bottom line” during the fourth quarter of 2023. RITM has provided some more details regarding SCU’s business operations/sub-portfolios which I will fully incorporate into the modeling in the near future (minor “tweaks” will likely occur). Regarding RITM’s definitive agreement to acquire an investment portfolio from Computershare Limited (Computershare), this is right in the company’s “ballpark” per se; MSRs and related assets (including an origination servicing business). As stated at the time this acquisition was first announced, I believe this was a smart decision by RITM. The Computershare acquisition equates to ~10% of RITM’s total shareholder’s equity as of 12/31/2023. The Computershare acquisition is projected to close during the first quarter of 2024.
Management remains in the process of “spinning-off” the mortgage origination/servicing business (including, but not necessarily limited to, NewRez/Caliber/Shellpoint). No new notable developments on this process were provided within RITM’s results/during the company’s earnings call this quarter. That said, this entire concept has been discussed, at length, in prior earnings notes. Subscribers can simply go back to my/our RITM (at the time NRZ) earnings notes and/or weekly subscriber articles during 2020 – 2021. The concept and impacts have not changed. The “value unlocking” of these sub-portfolios, by spinning off several subsidiaries, forming a new entity, and taking it public (current RITM shareholders would theoretically own shares in the newly-formed REIT public entity), would be a positive catalyst/trend. The parent will likely covert to a C-Corporation. This assumption has already been built into our bifurcated modeling for RITM (formerly NRZ) since 2019 (separate BVs kept private until finalized details regarding organizational hierarchy are provided). As such, this entire concept has already been taken into consideration regarding RITM’s percentage recommendation ranges and risk/performance rating. Additional RITM details/strategies/thoughts (including mentioning the spin-off) are provided in our weekly mREIT and BDC sector newsletter/article.
When taking RITM’s recent and projected performance into consideration, along with macroeconomic trends/events (mainly Fed monetary policy, the general projected movement of rates/yields, and projected economic performance over the foreseeable future), no change to my/our RITM percentage recommendation ranges (relative to CURRENT BV) or risk/performance rating (remains at a 3.5). That said, due to RITM’s minor-modest 12/31/2023 BV outperformance, I/we performed a CURRENT BV “true-up” adjustment which raised the company’s per share recommendation ranges by approximately $0.30 per share. This true-up CURRENT BV adjustment is already reflected in the Google subscriber spreadsheets.
I continue to believe RITM’s internalized management team is talented - highly talented. I do hold RITM to a “higher standard” when compared to some of the lower-rated mREITs. If RITM were to increase the company’s quarterly dividend of $0.25 per common share in the future, this would directly result in a minor – modest percentage recommendation range upgrade (though the company’s risk/performance rating would remain at a 3.5).
At a closing price as of 2/7/2024 of $10.18 per share, RITM is deemed to be UNDERVALUED/a BUY recommendation (price target of $12.60 per share). As a reminder, to remain non-bias, RITM will not have the same type of BV increases the fixed-rate agency mREIT peers typically experience when there is a decline in interest rates (when spread/basis risk is not elevated). However, RITM can quickly take the company’s hedges on-and-off as interest rates/yields fluctuate (more so than your typical agency mREIT) to minimize BV erosion in a decreasing interest rate environment. MSRs and MSR-related investment valuation declines will be mitigated by valuation gains within RITM’s fixed-rate agency MBS, non-agency MBS, and residential whole loans, (as long as credit risk remains subdued; risk remains fairly tame on the residential side but is continuously monitored/modeled). In addition, I continue to believe RITM will continue to outperform in a “higher-for-longer” interest rate environment. Just something to quickly note/highlight here…”
2) ARCC’s NAV and Core Earnings Q4 2023 Performance (Projected Versus Actual Results):
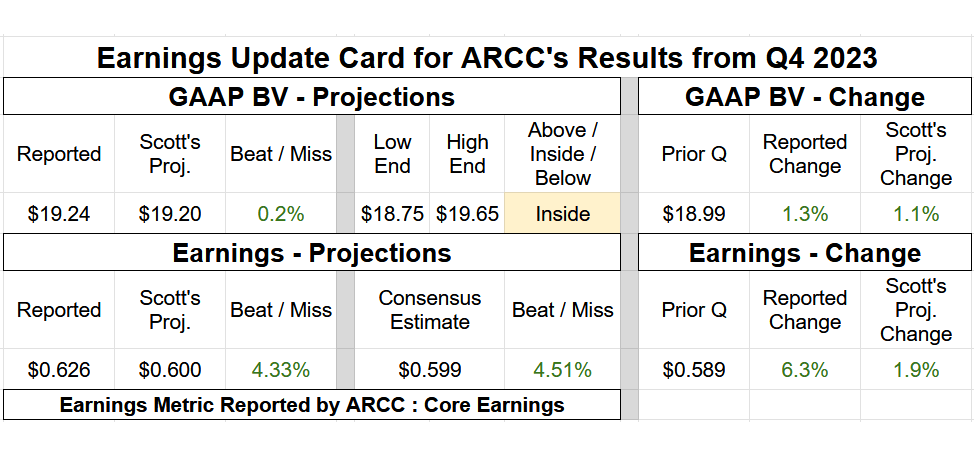
On 2/7/2024, Ares Capital Corp. (ARCC) reported the company’s earnings results for the fourth quarter of 2023. Table 2 below provides ARCC’s NAV and earnings summary.
Table 2 – ARCC Q4 2023 NAV and Earnings Summary
Source: Taken Directly from the REIT Forum’s © Analytical Spreadsheets/Data
I provided the following commentary in regards to ARCC’s results for the fourth quarter of 2023:
“Hi subscribers. I was able to review ARCC’s Q4 2023 earnings results. ARCC’s Q4 2023 core earnings of $0.626 per share was a minor outperformance versus my projection of $0.600 per share (range $0.560 - $0.640 per share). ARCC’s core earnings was $0.589 per share for the third quarter of 2023. As such, I projected a core earnings increase of $0.011 per share. In actuality, ARCC reported a core earnings increase of $0.037 per share during the fourth quarter of 2023. The institutional analysts’ consensus average was core earnings of $0.599 per share. Let us review the underlying metrics that contributed to ARCC’s minor quarterly core earnings increase/outperformance.
First, let us take a look at ARCC’s recent quarterly loan activity. I correctly anticipated ARCC would experience a “pick up” in quarterly loan originations during the fourth quarter of 2023 while prepayments/repayments/restructurings would remain relatively flat. That said, the level of originations was even a bit higher versus my expectations. ARCC reported total loans funded at close and add-on investments of $2.4 billion while reporting total loan prepayments/repayments/restructurings of ($1.4) billion during the fourth quarter of 2023. When calculated, including the impact of quarterly FMV fluctuations, amortization, and principal paydowns, ARCC increased the company’s investment portfolio size by $0.9 billion or 4% during the fourth quarter of 2023. Just know some of this increase was directly in relation to equity investments that currently do not provide dividend income (but could in the future). In comparison, I projected a net portfolio increase of $0.5 – $0.7 billion (mean increase of $0.6 billion). When calculated, including the incentive fee offset from higher total pre-incentive fee income, this ultimately resulted in a core earnings outperformance of $0.022 per share when compared to my expectations.
Second, unlike most sector peers, ARCC continued to experience a rise in the company’s weighted average annualized yield during the fourth quarter of 2023 when compared to the prior quarter. Simply put, this was even with the recent “plateauing/leveling off” in LIBOR/SOFR/PRIME. That said, I correctly anticipated quarterly origination yields to continue to “outpace” exit yields. ARCC reported a weighted average annualized yield of 12.20%, 12.40%, and 12.50% for the second, third, and fourth quarter of 2023, respectively. When calculated, this was a quarterly increase of 0.2% and 0.1%, respectively. This past quarter, this matched my expectations. As stated last quarter, this metric will began to plateau towards the end of 2023. In addition, it should be noted the higher LIBOR/SOFR/PRIME rose (over 500 basis points [bps] in 1.5 years), the more underlying credit risk (non-accruals) needs to be respected (and monitored). This will have heightened importance as we head through 2024. When quantified, including the incentive fee offset from similar total pre-incentive fee income (not applicable in this specific case), this directly led to no/a de minimis core earnings variance when compared to my expectations.
When both factors above are combined, along with a $0.004 per share core earnings outperformance within ARCC’s remaining income and expense accounts (outside the incentive fee accrual; mainly due to higher-than-anticipated structural servicing fee income on higher originations partially offset by higher interest expense on a slightly larger investment portfolio size), this fully reconciles back to ARCC’s core earnings outperformance of $0.026 per share when compared to my expectations for the fourth quarter of 2023.
Moving on, ARCC reported a NAV as of 12/31/2023 of $19.24 per share (1.3% increase) versus my projection of $19.20 per share (1.1% increase). I consider this basically an exact match (at or within a 0.5% variance) and was well within my $18.75 - $19.65 per share range. With broader market stabilization, including the fact spreads continued to slightly tighten within high-yield/speculative-grade credit (regarding lower risk underlying portfolio companies), an NAV increase during the fourth quarter of 2023 was correctly anticipated. When taking a quick “run through” of ARCC’s entire investment portfolio, there were a handful of minor valuation surprises but nothing “alarming”. ARCC had 505 portfolio companies as of 12/31/2023 so it will take some time to fully reconcile the entire investment portfolio regarding quarterly valuation fluctuations.
Regarding non-accruals, ARCC added 1 portfolio company, Kellermeyer Bergensons Services LLC (Kellermeyer), to the company’s list of non-accruals during the fourth quarter of 2023 (as indicated in our weekly mREIT/BDC article series; credit section). ARCC placed 1 first lien debt investment with Kellermeyer on non-accrual status which had a principal balance of $30.9 million as of 12/31/2023. In addition, 0 portfolio companies were taken off non-accrual status and/or were exited/written-off/restructured during the quarter. As of 12/31/2023, ARCC had 12 portfolio companies on non-accrual status (an increase of 1 when compared to 9/30/2023). When calculated, non-accruals accounted for 1.3% and 0.6% of ARCC’s investment portfolio as of 12/31/2023 when based on amortized cost basis and FMV, respectively. Both percentages were relatively unchanged when compared to 9/30/2023 and will very likely remain slightly - modestly below sector averages as of 12/31/2023. A slight uptick in non-accruals will likely continue/persist throughout 2024. This opinion has not changed (nor expected to change over the foreseeable future). At the peak of this recessionary/credit cycle (during 2024), I believe ARCC’s non-accrual rate will climb to 2.0% - 4.0% of total investments (unless some current non-accruals are quickly written-off/restructured; thus lowering this percentage a bit [case-in-point 2 portfolio companies were restructured/written-off during the second quarter of 2023]).
So, all-in-all, a minor outperformance on ARCC’s core earnings (variance of $0.026 per share) and basically an exact match on the company’s NAV (variance of only 0.2%). In my opinion, ARCC reported another good quarter overall. Underlying portfolio company interest coverage remains fairly strong and the average loan-to-value (“LTV”) ratio remains very attractive below 50%. ARCC’s payment-in-kind (“PIK”) rate, as a percentage of total investment income, very slightly increased during the quarter which is acceptable (though preferably I would like to see a modest decrease). Unlike some recent BDC peers, at least ARCC’s PIK percentage has not modestly – notably increased over the past year (warning sign of worsening underlying portfolio health).
Regarding ARCC’s dividend, management/the Board of Directors (“BoD”) continued to be very cautious regarding payouts for the first quarter of 2024. ARCC declared an unchanged $0.48 per share dividend and no special periodic dividend. This was at the low end of my/our $0.48 - $0.53 per share dividend range for the first quarter of 2024. This specific projection was provided in last quarter’s ARCC sector comparison article and within our weekly mREIT/BDC newsletter/article series. This is simply management being very cautious in case recessionary risk rises over the foreseeable future (which would likely cause a quicker/more severe decrease in the Federal [Fed] Funds Rate by the Federal Open Market Committee [FOMC]). I continue to believe there is extremely little risk ARCC needs to reduce the company’s current quarterly dividend per share rate through, at the least, the remainder of 2024. This even considers the “bearish” case a mild - modest recession is on the horizon. Very important to understand. ARCC continues to have a very large cumulative undistributed taxable income (“UTI”) balance. This figure is estimated to be $635 million or a ratio of 1.09 as of 12/31/2023 (likely will continue to be one of the largest out of the 15 BDC peers I/we currently cover). This very important, and positive catalyst, is one of the main reasons why I continue to own this particular BDC stock.
From these results, along with considering macroeconomic trends/events (mainly Fed monetary policy, the general projected movement of rates/yields, and projected economic performance over the foreseeable future), no change to my/our ARCC percentage recommendation ranges (relative to CURRENT NAV) or risk rating (will remain at a 3).
At a closing price as of 2/7/2024 of $20.19 per share, ARCC is deemed to be APPROPRIATELY VALUED/a HOLD recommendation (price target of $22.10 per share). However, ARCC is extremely close to the beginning of our UNDERVALUED/BUY recommendation range (starts at or below $20.15 per share). ARCC continues to be priced/valued at a slight premium to a majority of covered BDC peers. However, I continue to believe this premium is entirely justified (reasoning on this opinion has recently been extensively covered in my/our BDC sector comparison article series)…”
Conclusions Drawn + BUY, SELL, or HOLD Recommendation:
Readers have continued to request that I provide these types of “earnings assessment” articles showing how my previously disclosed quarterly projections “stacked-up” to each covered mREIT’s/BDC’s results. I believe the analysis above accomplishes this request for the REIT Forum subscribers.
In summary, here is how RITM and ARCC performed when compared to my expectations regarding the fourth quarter of 2023 (includes any risk rating and BUY, SELL, or HOLD recommendation range changes; as well as current recommendation):
1) RITM
BV: Minor-Modest Outperformance (Within Range; Towards Top End)
Adjusted Core Earnings: Basically an Exact Match (Well Within Range)
Percentage Recommendation Range (Relative to CURRENT BV): No Change (Reasoning Provided Above)
Risk Rating: No Change
Table 3 – RITM Notecard (As of 2/7/2024)
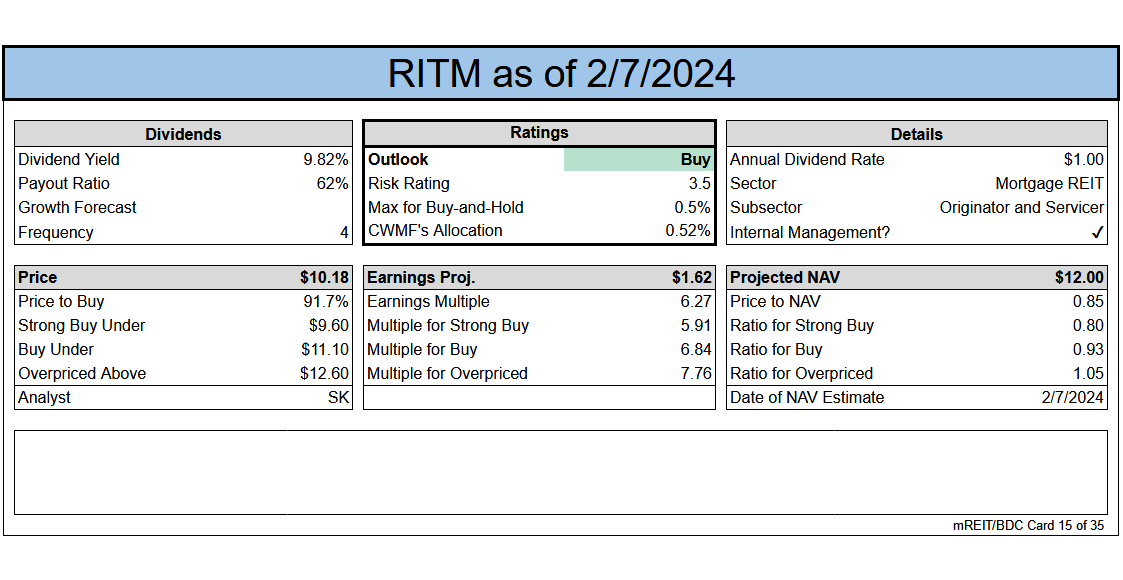
(Source: Taken Directly from the REIT Forum’s © Subscriber-Accessible Spreadsheets. Earnings Projection is Taken Directly from Either the Prior Quarter’s Actual Reported Figure or the Institutional Analysts’ Consensus Average and Annualized. At the End of Each Current Quarter, I Provide My Own Finalized Core Earnings/Core Earnings Equivalent or NII/Adjusted NII Metric Which Will Differ from the Estimate Provided Above.)
2) ARCC
NAV: Basically an Exact Match (Well Within Range)
Core Earnings: Minor Outperformance (Within Range)
Percentage Recommendation Range (Relative to CURRENT NAV): No Change (Reasoning Provided Above)
Risk Rating: No Change
Table 4 – ARCC Notecard (As of 2/7/2024)
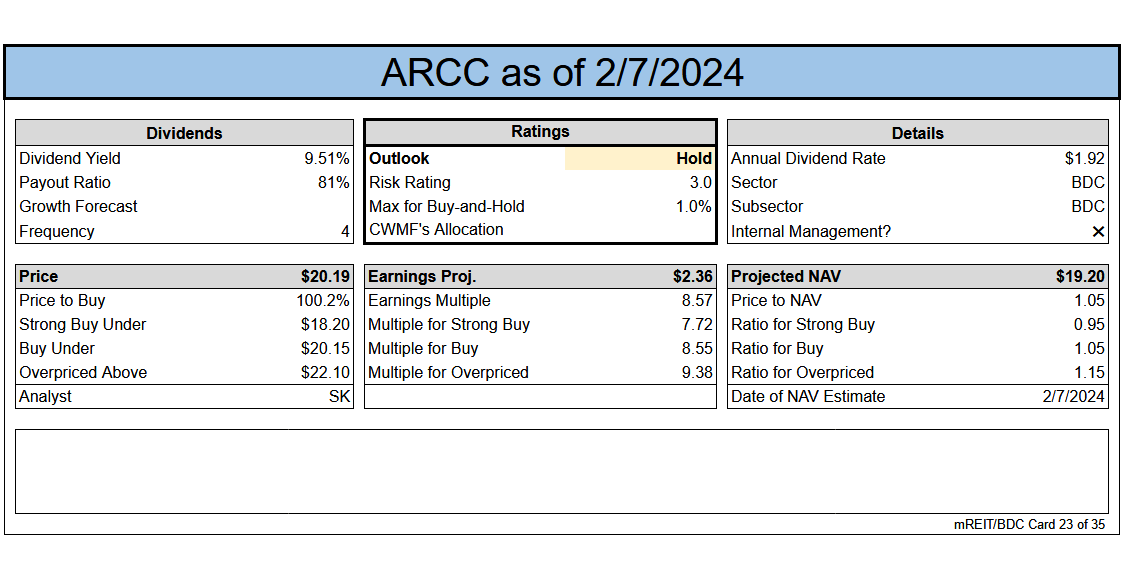
(Source: Taken Directly from the REIT Forum’s © Subscriber-Accessible Spreadsheets. Earnings Projection is Taken Directly from Either the Prior Quarter’s Actual Reported Figure or the Institutional Analysts’ Consensus Average and Annualized. At the End of Each Current Quarter, I Provide My Own Finalized Core Earnings/Core Earnings Equivalent or NII/Adjusted NII Metric Which Will Differ from the Estimate Provided Above.)
Important Note: As always, please check the Google shared spreadsheets when it comes to intra-week recommendations as stock prices fluctuate.
Along with the data presented within this article, these recommendations consider the following mREIT catalysts/factors: 1) projected future MBS/investment price movements; 2) projected future derivative valuations; and 3) projected near-term (up to 1-year) dividend per share rates. Along with the data presented within this article, this recommendation considers the following BDC catalysts/factors: 1) projected future high yield/speculative-grade credit spreads; 2) managerial expertise/underwriting due diligence (regarding credit risk); and 3) projected near-term (up to 1-year) dividend per share rates. These recommendations also consider the 8 Federal (“Fed”) Funds Rate increases by the FOMC during December 2016-2018 (a more hawkish tone/rhetoric when compared to 2014-2016), the three Fed Funds Rate decreases during 2019 due to the more dovish tone/rhetoric regarding overall monetary policy as a result of recent macroeconomic trends/events, and the very quick “plunge” in the Fed Funds Rate to near 0% in March 2020. This also considers the previous wind-down/decrease of the Fed Reserve’s balance sheet through gradual runoff/partial non-reinvestment (which began in October 2017 which increased spread/basis risk) and the prior “easing” of this wind-down that started in May 2019 regarding U.S. Treasuries and August 2019 regarding agency MBS (which partially reduced spread/basis risk when volatility remained subdued). This also considers the early Spring 2020 announcement of the start of another round of quantitative easing (“QE”) that includes the Fed specifically purchasing agency MBS (and “rolling over” all principal and interest payments into new agency MBS) which bolstered prices while keeping long-term/mortgage interest rates near historical lows (which lowered spread/basis risk for quite some time when volatility remained subdued). This also includes the recent “taper” of the Fed’s most recent QE program regarding its monthly purchases of $80 billion of U.S. Treasury securities and $40 billion of agency MBS. This taper began in November 2021 and market speculation around this future event caused a rise in spread/basis risk and during the summer of 2021 (as correctly previously anticipated) and the second half of the fourth quarter of 2021-October 2022. This includes the FOMC’s previously accelerated taper and the continued very quick rise in the Fed Funds Rate which began in March 2022. I/We continue to believe agency mREIT net interest margins began to flatten out during late 2023 and will gradually/slowly improve during 2024.
Each investor's BUY, SELL, or HOLD decision is based on one's risk tolerance, time horizon, and dividend income goals. My personal recommendation will not fit each reader’s current investing strategy. The factual information provided within this article is intended to help assist readers when it comes to investing strategies/decisions.
Understanding My Valuation Methodology Regarding mREIT Common and BDC Stocks:
The basic "premise" around my recommendations in the mREIT common and BDC sectors is value. Regarding operational performance over the long-term, there are above average, average, and below average mREIT and BDC stocks. That said, better-performing mREIT and BDC peers can be expensive to own, as well as being cheap. Just because a well-performing stock outperforms the company’s sector peers over the long-term, this does not mean this stock should be owned at any price. As with any stock, there is a price range where the valuation is cheap, a price where the valuation is expensive, and a price where the valuation is appropriate. The same holds true with all mREIT common and BDC peers. As such, regarding my investing methodology, each mREIT common and BDC peer has their own unique BUY, SELL, or HOLD recommendation range (relative to estimated CURRENT BV/NAV). The better-performing mREITs and BDCs typically have a recommendation range at a premium to BV/NAV (varying percentages based on overall outperformance) and vice versa with the average/underperforming mREITs and BDCs (typically at a discount to estimated CURRENT BV/NAV).
Each company’s recommendation range is "pegged" to estimated CURRENT BV/NAV because this way subscribers/readers can track when each mREIT and BDC peer moves within the assigned recommendation ranges (daily if desired). That said, the underlying reasoning why I/we place each mREIT and BDC recommendation range at a different premium or (discount) to estimated CURRENT BV/NAV is based on roughly 15-20 catalysts which include both macroeconomic catalysts/factors and company-specific catalysts/factors (both positive and negative). This investing strategy is not for all market participants. For instance, not likely a “good fit” for extremely passive investors. For example, investors holding a position in a particular stock, no matter the price, for say a period of 5+ years. However, as shown throughout my articles written here at Seeking Alpha since 2013, in the vast majority of instances I have been able to enhance my personal total returns and/or minimize my personal total losses from specifically implementing this particular investing valuation methodology. I hope this provides some added clarity/understanding for new subscribers/readers regarding my valuation methodology utilized in the mREIT common and BDC sectors. Please disregard any minor “cosmetic” typos if/when applicable.
Member discussion