
Preferred Share Comparison: RITM and PMT Dominate CHMI
We’re kicking it off today with a quick risk comparison. I won’t ask you to evaluate the entire portfolio structure, hedges, and leverage. Instead, I’ll give you some quick charts.
This chart is going to compare the price and book value between Rithm (RITM), PennyMac (PMT), and Cherry Hill (CHMI). However, to normalize the ending values and make it easier to see relative performance, we’re going to use .76 shares for PMT and use 1.98 shares for CHMI. This way all 3 investments end up with a book value of $12.00.
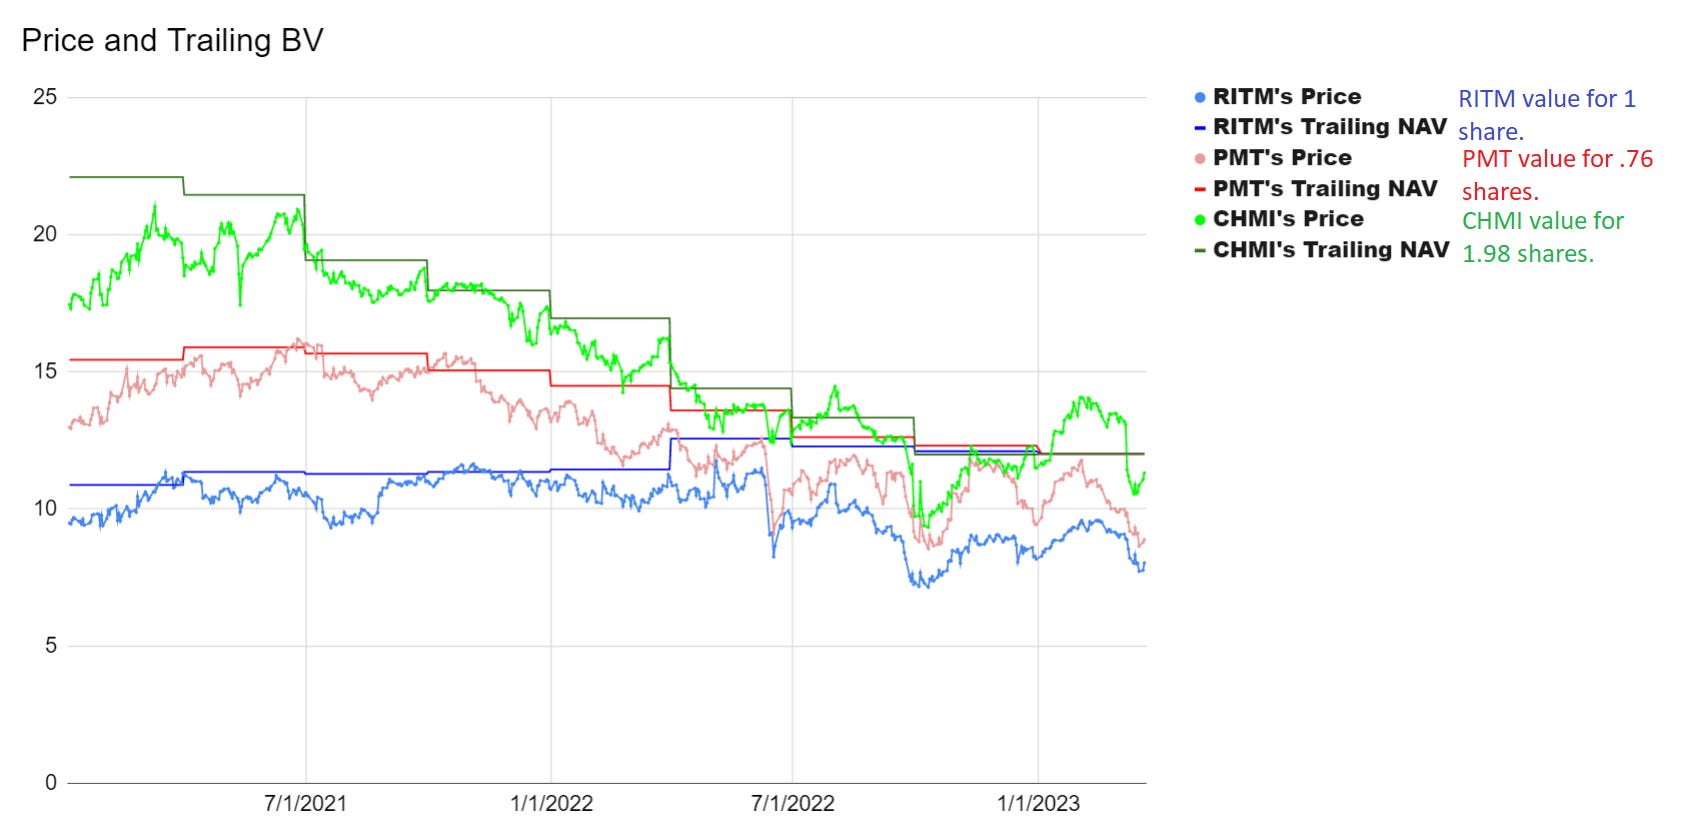
The normalization allow us to chart them closely together even though PMT actually had an ending book value per share of $15.78 CHMI had a Q4 2022 ending book value per share of $6.06. By using a different number of shares, we’re able to adjust the book value and share price proportionally to create a fair comparison.
If you’re familiar with the importance of book value, you would probably say that the green one appears to be riskier. It was clearly doing a much weaker job of protecting book value. But what happens if we zoom the chart out?
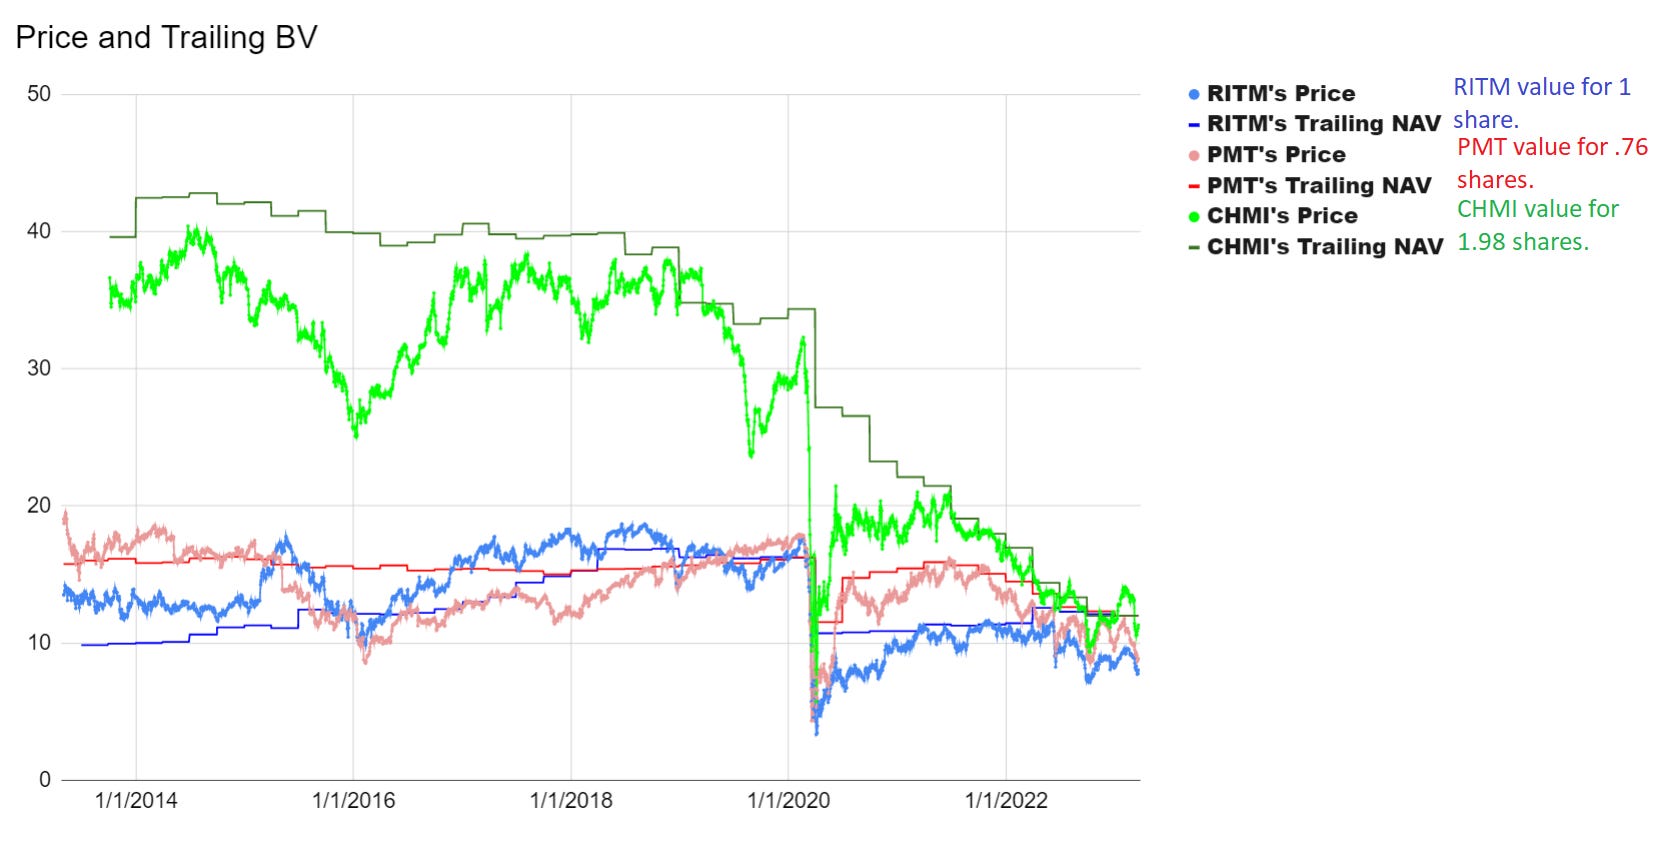
Didn’t change your mind, did it?
Well, since CHMI is the one that keeps destroying shareholder value, do you think their preferred shares are going to offer a higher or lower yield than the preferred shares for RITM and PMT?
If you figured it should be a higher yield, you were using logic. The market isn’t using logic lately. While mortgage REIT preferred shares got crushed, CHMI-A and CHMI-B held up remarkably well. Over the last 20 days CHMI-A is down about 6% and CHMI-B is down about 3.6%. RITM-B, RITM-C, and RITM-D are down 13.8% to 14.2% over the same period.
The difference in expected returns is significant:
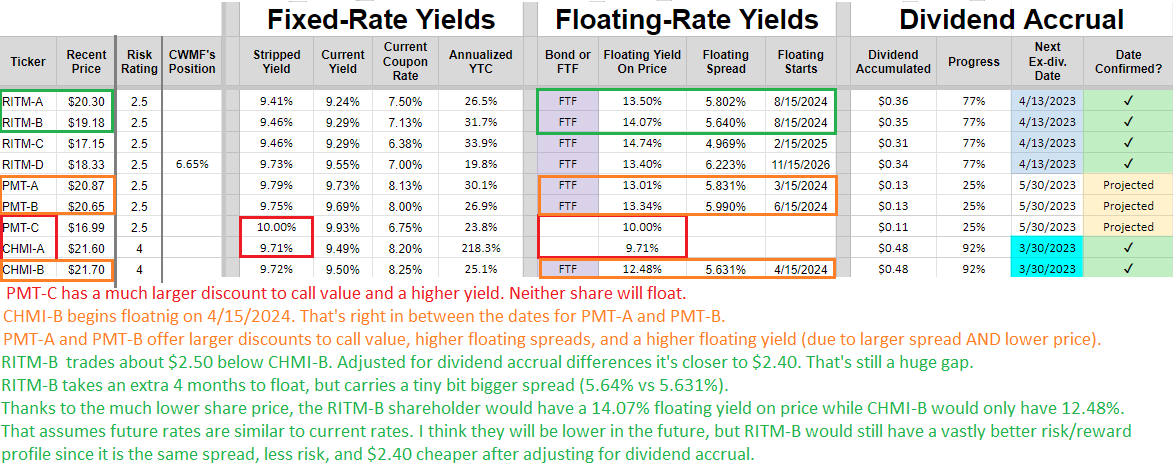
What’s the investment takeaway? Investors in the CHMI preferred shares should try to escape with their relatively small losses and swap that capital into the much more attractively valued preferred shares from RITM and PMT.
For my readers who regularly want our charts for sector comparison, I’ll be posting them here. Another article about a different topic relating to the sector will be posted to Seeking Alpha.
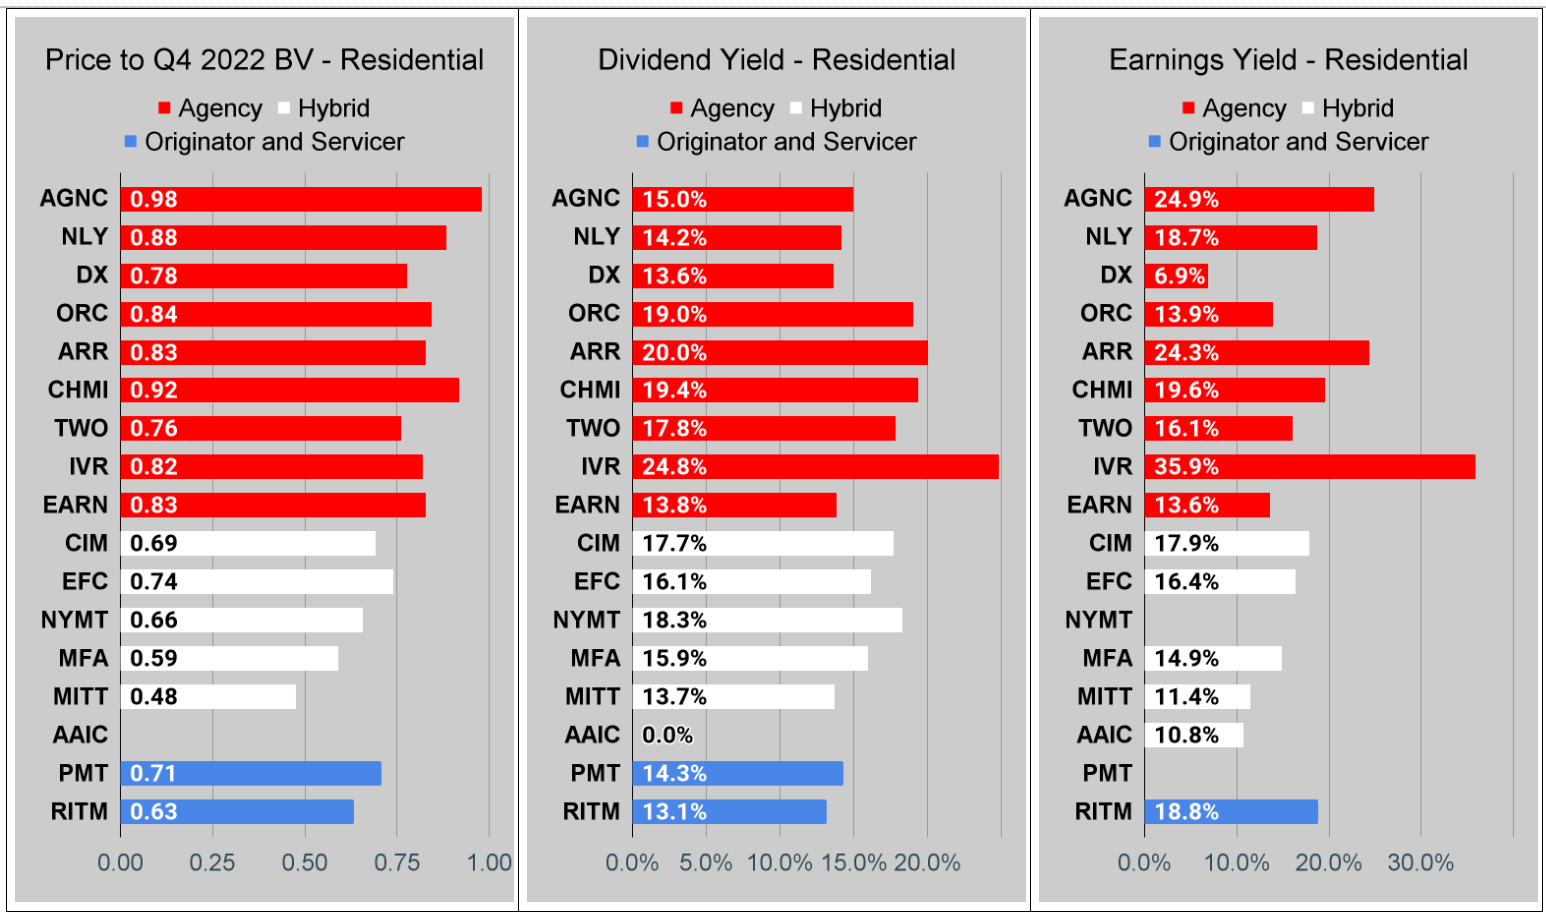
Residential Mortgage REIT Charts
Note: The chart for our public articles uses the book value per share from the latest earnings release.
The current estimated book value per share is used in reaching our targets and trading decisions. It is available in our service, but those estimates are not included in the charts below. PMT and NYMT are not showing an earnings yield metric as neither REIT provides a quarterly “Core EPS” metric.
Second Note: Due to the way historical amortized cost and hedging is factored into the earnings metrics, it is possible for two mortgage REITs with similar portfolios to post materially different metrics for earnings. I would be very cautious about putting much emphasis on the consensus analyst estimate (which is used to determine the earnings yield). In particular, throughout late 2022 the earnings metric became less comparable for many REITs. It remains far less relevant today. You can see this clearly by looking at the earnings yield for DX compared to AGNC and IVR. This is one of the weaknesses in how “Core EPS” metrics are designed.
You can click on any of these charts to zoom in. Due to some technical limitations, it has to zoom in all 3 charts for each sector at the same time.
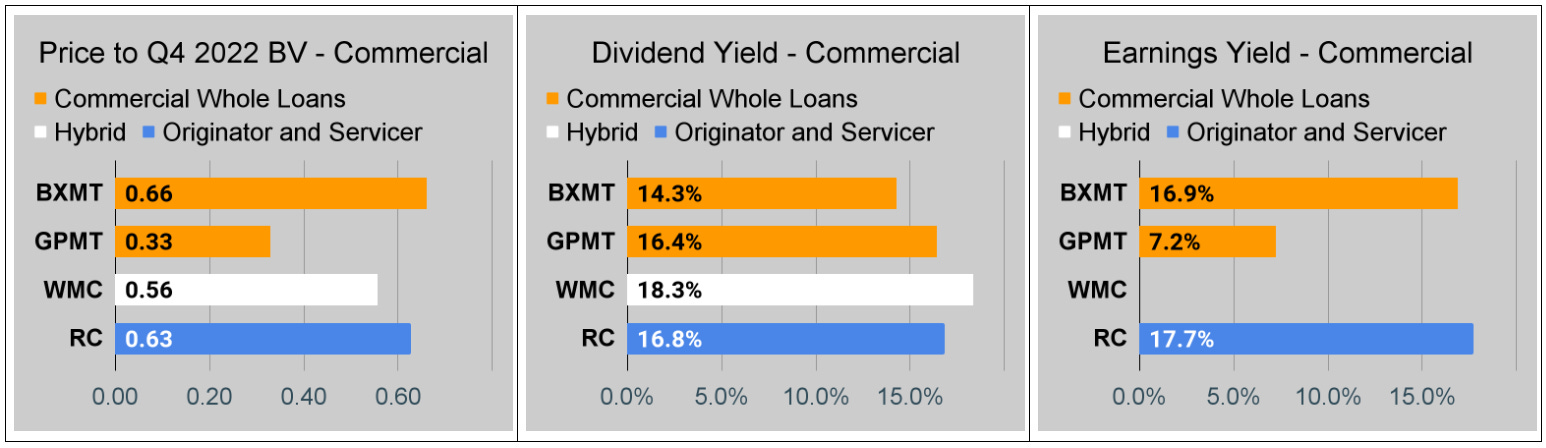
Commercial Mortgage REIT Charts
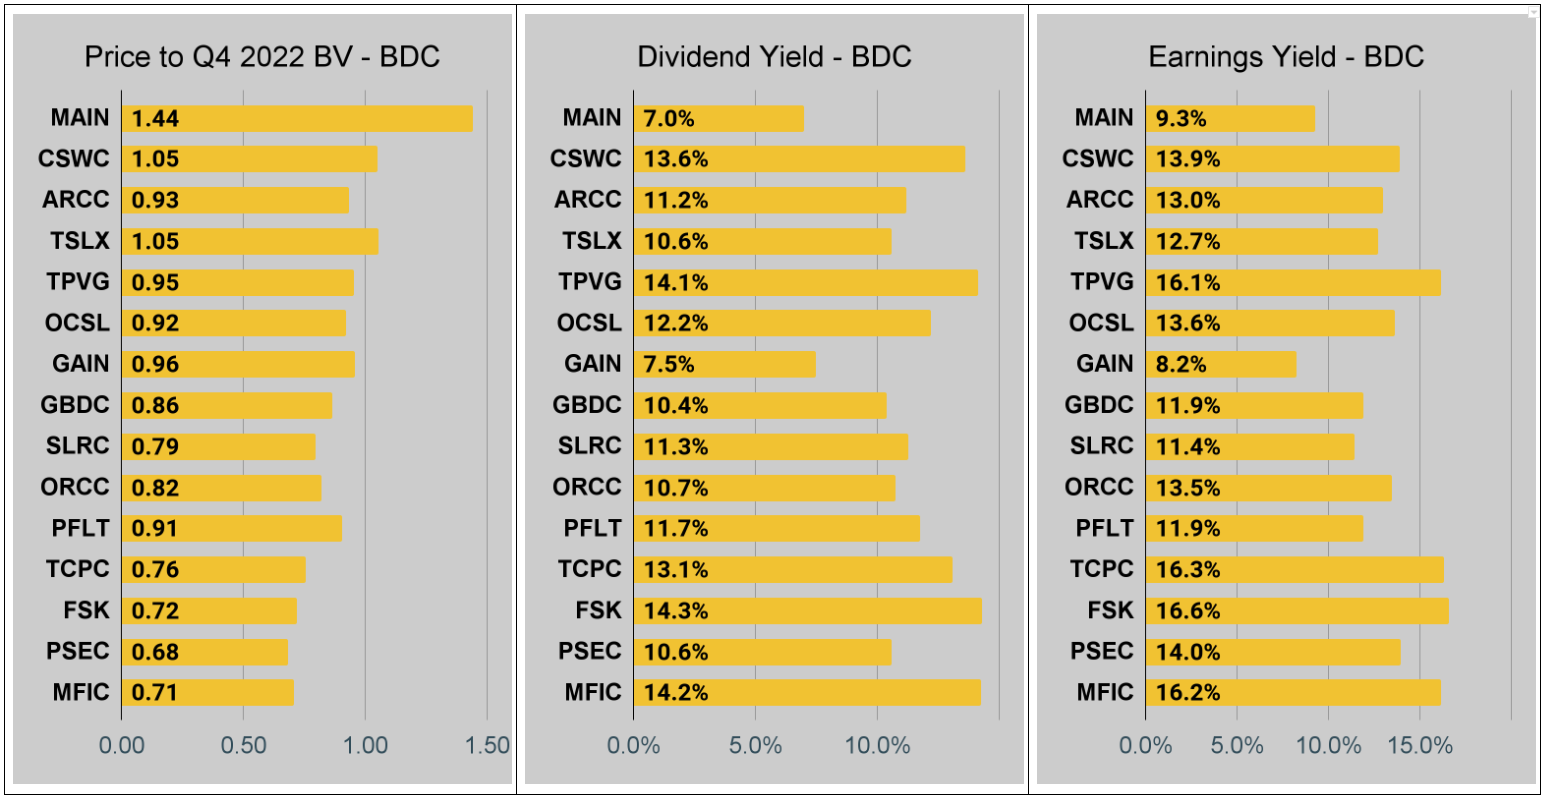
BDC Charts
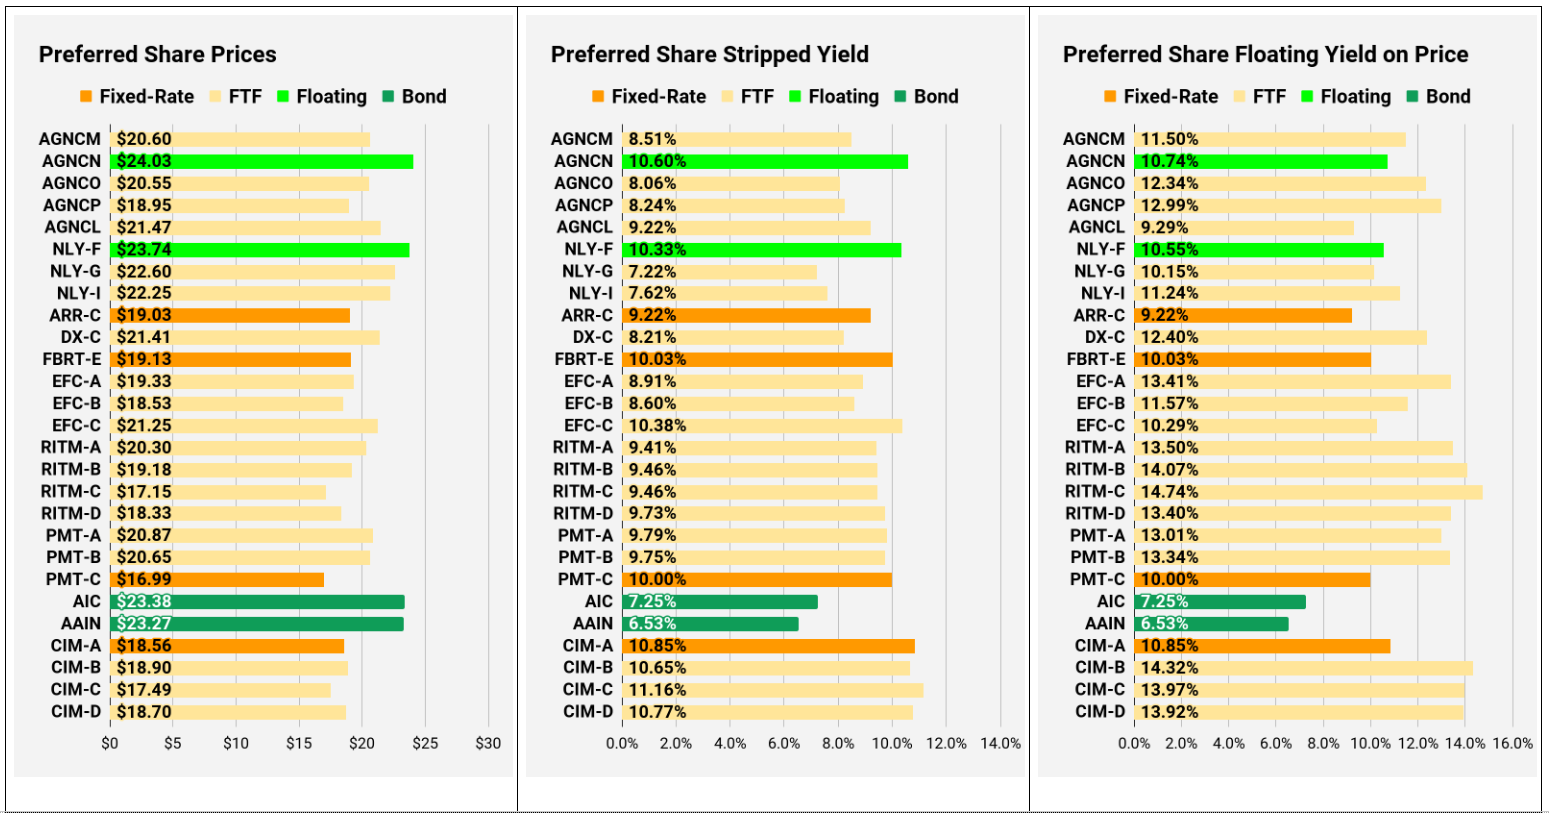
Preferred Share Charts
I changed the coloring a bit. We needed to adjust to include that the first fixed-to-floating shares have transitioned over to floating rates. When a share is already floating, the stripped yield may be different from the “Floating Yield on Price” due to changes in interest rates. For instance, NLY-F already has a floating rate. However, the rate is only reset once per 3 months. The stripped yield is calculated using the upcoming projected dividend payment and the “Floating Yield on Price” is based on where the dividend would be if the rate reset today. In my opinion, for these shares, the “Floating Yield on Price” is clearly the more important metric.

Conclusion
Whether investors are looking for a fixed-rate preferred share or a fixed-to-floating preferred share, PMT and RITM offer significantly better choices than CHMI.
Thank you for reading. The volume of articles on this site should increase significantly throughout the next few months. Please excuse any strange formatting, as it may take a few articles to get familiar with the updates to how this site works.
If you’re not following my website yet, please consider subscribing for free updates.
Member discussion