
Portfolio Update - September: First Cut Coming

Just a quick note to start: We’re skipping the Weekly Update article this weekend. It’s a holiday weekend and the adjustments were all minor.
The spreadsheets will still have updated estimates and targets for the mortgage REITs and BDCs. It’s just the article part we’re skipping.
August was a surprising month.
As the charts in the returns section show, we earned a solid return for the month. However, our performance fell relative to the ETFs.
That was surprising enough that I double-checked the math and then calculated out performance by segment.
I think the comparison will be instructive for investors, so I decided to write about it. We don’t usually break down performance by segment to compare against the ETFs.
Our comparison is against an equal mix of PFF, MORT, VNQ, and KBWY. That comes out to 25% preferred shares, 25% mortgage REITs, and 50% equity REITs (VNQ and KBWY are both equity REIT ETFs).
We usually have a bit of cash in the portfolio which can buffer downturns but also reduces performance during positive months.
Where Did Our Performance Differ?
We had some cash. We still have some cash. During rallies, cash reduces the rate of return. That’s just life. We usually have some cash and just accept it as part of investing.
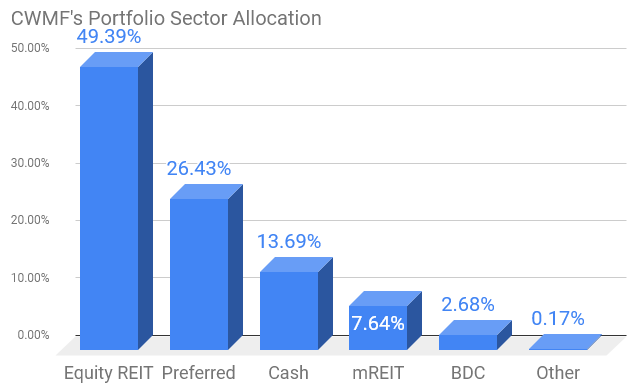
We had 48.33% of our portfolio in equity REITs. Our return on equity REITs was very slightly under the equity REIT index ETFs.
We had 34.2% in preferred shares and baby bonds. We came in behind the index ETF there. About 1.5% vs. 2.56%.
We had about 10.8% in mREITs and BDCs combined. However, the position was heavily concentrated with most of that allocation in RC (down 10.67%) and a moderate portion in SLRC (up 1.79%). The concentration in the positions can lead to a bigger variance. However, our strategy has worked over the long term. Often our trading positions in this sector have significantly enhanced our performance.
I found the gap in the preferred shares a bit interesting. Interest rates are a key factor here.
The index ETF has a dramatically higher proportion of fixed-rate securities. Consequently, when rates fell, it was a big tailwind. Our fixed-rate positions did very well. Our shares of PMT-C returned 6.75% for the month.
Our other big winner was PMT-B, which returned 4.45% for the month (leading up to our sale on Friday, with returns of about 8.1% to 8.5% overall).
GPMT-A was a bit disappointing. You may recall that in the potential trades section last month, I mentioned considering swapping out of GPMT-A. That would’ve helped results.
We also saw a slight dip with RCB (RCB) and DX-C (DX.PR.C).
Within equity REITs, there was a huge gap by the type of property.
We saw housing REITs performing very well. Our biggest performers were Camden Property Trust (CPT), AvalonBay (AVB), Sun Communities (SUI), and Equity Lifestyle (ELS).
SBA Communications (SBAC) came in at 3.69% for the month, which was pretty good.
Interest Rates
Interest rates appeared to be an important factor this month.
We saw rates continue to fall in early August, before leveling off over the last few weeks:
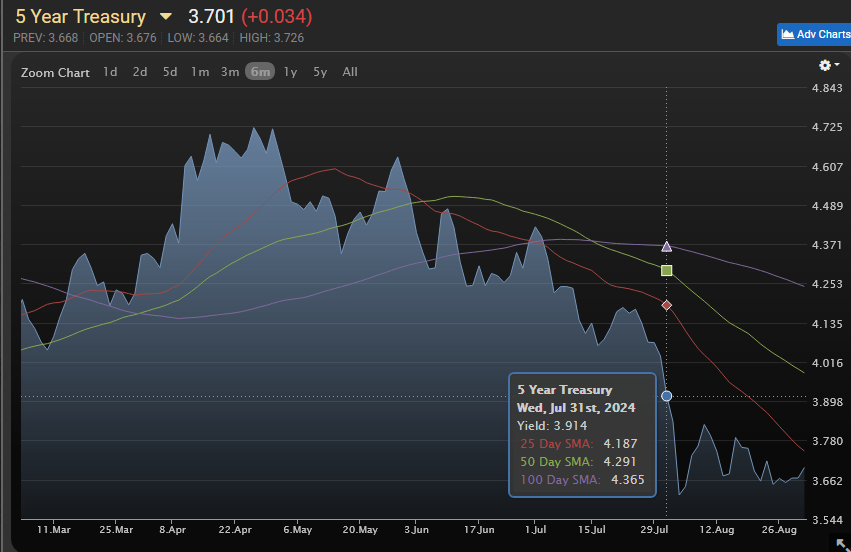
Source: MBSLive
The 2-year had a similar move:
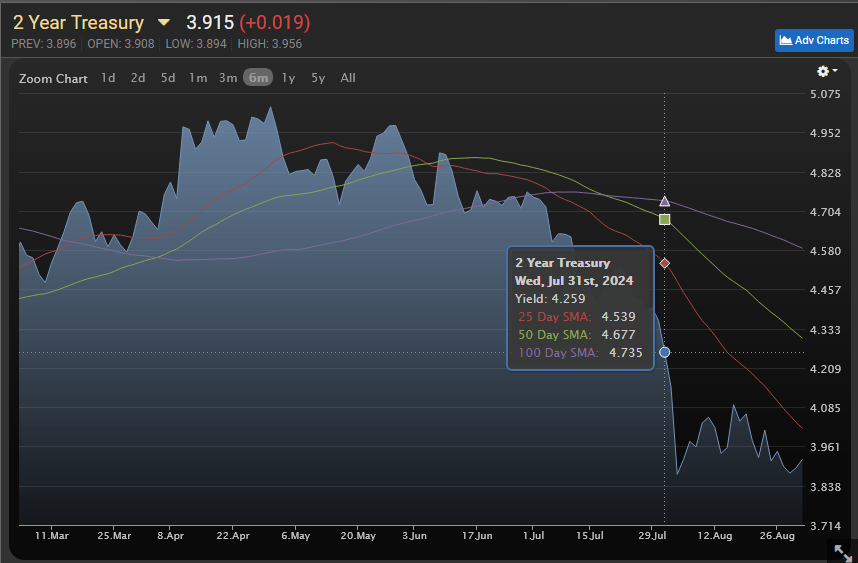
Source: MBSLive
The big move on the short end of the curve indicates that the investors are back to firmly expecting the Federal Reserve to take action on interest rates.
Inflation has been mild enough and elevated rates are adding trillions to the future compounded interest expense. Who wants to be stuck paying for that?
CME Group provides the excellent “Fed Funds Watch” tool, which is great for visualizing the implied future interest rates based on the pricing for derivatives:
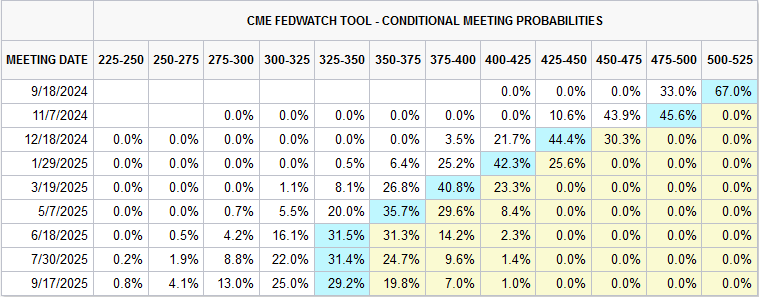
Source: CME Group
That chart may feel a bit hard to read at first. Just remember that dates are on the left and rates are on the right.
The next meeting has an implied probability of:
- 33% for 475 to 500
- 67% for 500 to 525
The market is forecasting cuts at every meeting until the middle of 2025.
This seems like a prudent time to address something about the futures market.
It often makes mistakes. The calculations are precise, but the huge institutions hedging their interest rate risk end up very surprised on occasion.
At the start of 2024, the market was forecasting far more cuts than it is today.
Did The Federal Reserve Tame Inflation?
No. When was the last time you saw a government appointee successfully steer the macroeconomic environment to avoid catastrophe?
That was actually a trick question. It was 2020. The Federal Reserve didn’t get everything right, but liquidity injections avoided a spiral in debt instruments that could’ve created a depression. The defaults that would’ve occurred (under mandatory lockdowns) would’ve been a bonanza for lawyers and a nightmare for business owners. As a rule of thumb, you don’t want anything that is good for lawyers and bad for small business.
Contrary to some opinions, the Federal Reserve’s actions there did NOT increase inflation. Liquidity does not create inflation. Many economists believed liquidity would create inflation following the Great Financial Crisis. They were proven categorically wrong.
There are two effective ways to create inflation:
- More dollars.
- Less stuff.
When the Federal Reserve dramatically increased liquidity, it did not create more dollars.
What happened?
- Congress established the government mandates for spending and taxation.
- Congress created the deficits.
- Deficits lead to more dollars.
- If dollars increase faster than stuff, that can drive inflation.
- What happened during the pandemic? The economy produced less stuff.
The reason I’ve been critical of the Federal Reserve is because the Federal Reserve has the largest impact on future interest expense.
Higher interest rates create a slight reduction in inflation today, but they cost trillions in future interest expense. That was a bad deal.
It’s like hiring an idiot to remodel your bathroom.
You might not pay much upfront, but you’ll pay dearly several years from now when water damage requires massive repairs.
Even if Congress had balanced the budget, there still would’ve been trillions in debt maturities rolling over to higher rates. Consequently, balancing the budget wouldn't have been enough to stop interest on the debt from surging higher.
Who Tamed Inflation?
Mostly the free market.
It was the combination of business owners and employees finding ways to increase production.
We could give Congress credit for “reducing” deficits, but given the current deficit, that sounds like a participation trophy:
“You were less bad than last time, though still worse than any point in history before this decade. Try harder.”
Article Starts
You can find prior installments of the Portfolio Updates on the Portfolio tab of our website.
Older editions of the Portfolio Update are unlocked for everyone. The newest release reserves the foreshadowing section for paid members.
Trade Alerts
We have a page on Substack to link all trade alert articles.
Here are The REIT Forum’s trade alerts.
Layout - Modified Order
To keep things simple for our investors, the rest of the portfolio update is divided into several segments. We run the same segments (with new content) each week.
We usually maintain the same order from month to month, but I revised the order to work better with free previews. Eventually, the order will be locked in again.
- Returns on Total Portfolio
- Sector Allocation
- Reminder About Cash
- Housekeeping
- Recently Closed Positions with Returns
- Recently Opened Positions with Returns
- All Open Positions by Sector with Returns
- Outlook
- Foreshadowing Potential Trades (paid section)
This layout maximizes transparency while keeping the foreshadowing of our potential trades within the paid section. It also loads the images together at the front, while putting the text-heavy sections together at the end.
Returns on Total Portfolio
Note: The presentation of the charts was modified slightly to enable running it through Google Sheets instead of Excel to reduce transferring data.
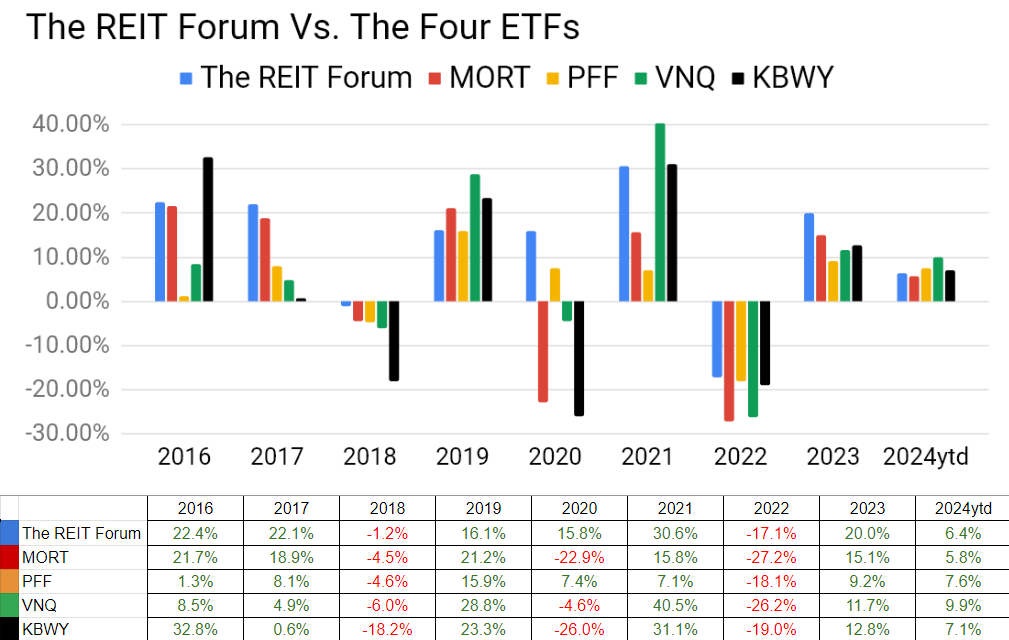
The chart below shows our performance since we began preparing for The REIT Forum at the start of 2016 through the end of the latest month:
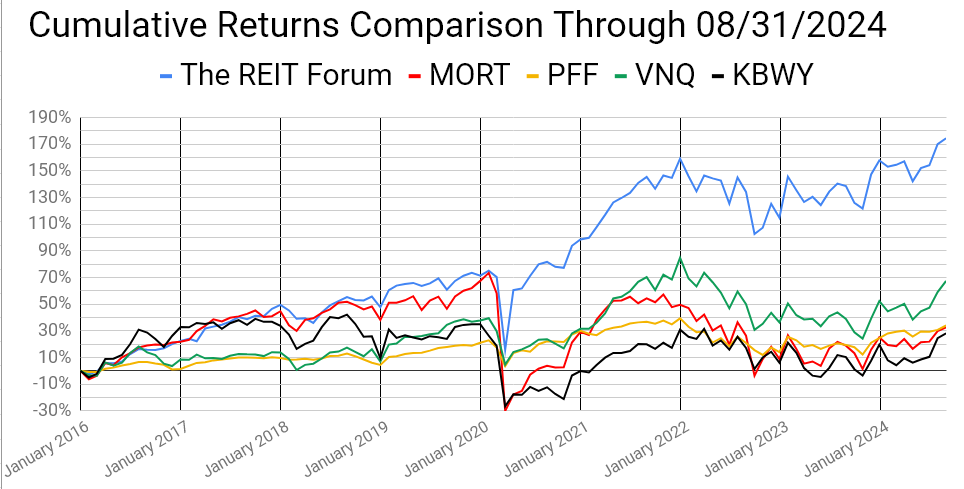
There are four major index ETFs we use for evaluating performance. They are:
- (MORT) $MORT - Major mortgage REIT ETF
- (PFF) $PFF - The largest preferred share ETF
- (VNQ) $VNQ - The largest equity REIT ETF
- (KBWY) $KBWY - The high-yield equity REIT ETF most retail investors follow
Annual comparison vs. each ETF:
Our performance vs. the average of the ETFs:

We evaluate alpha based on performance against the ETFs because it strips out the general change in our sectors.
We delivered a respectable gain in August, but the indexes took the lead. Trailing this late in the year has been a rare occurrence.
The next chart shows the change in the value of our portfolio from month to month. We strip out the impact from contributions made during the month because, obviously, contributions are not returns.
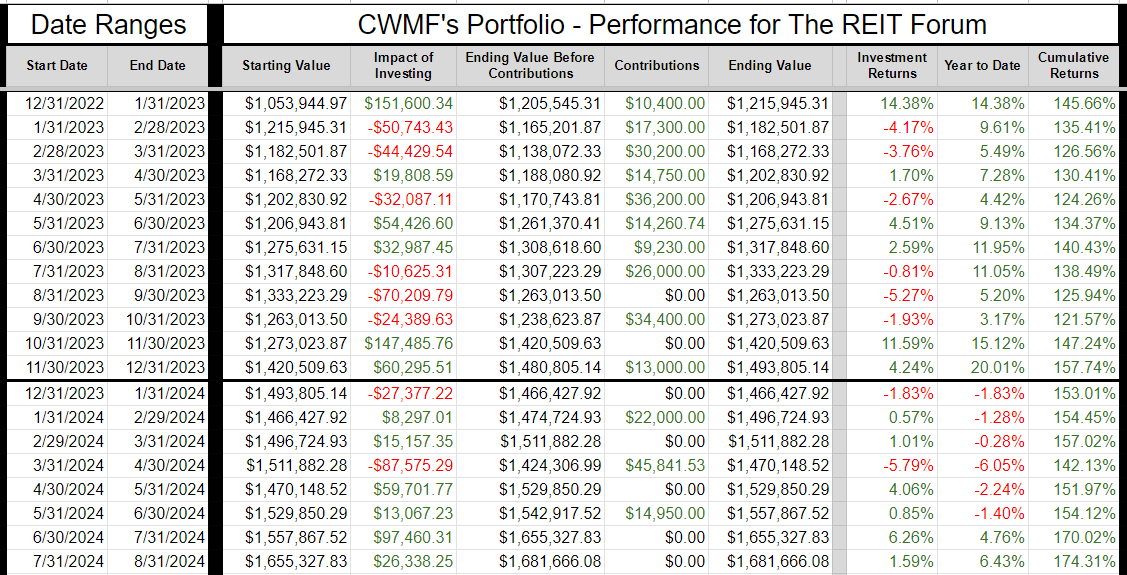
The prior year is included as well to help investors see how the calculations work.
If anyone is confused by these calculations, let me know. I believe this transparency is crucial, so I’ll include an example showing every calculation if I hear that readers have any difficulty following it.
Sector Allocation Chart -
The sector allocation chart helps to explain how we are thinking about risk and seeking returns:
Reminder About Cash (repeated)
I normally keep at least 6 months or more of living expenses in “cash”. If you normally keep around $40k to $50k in “cash”, the difference between getting paid 5% and 0.2% is around $2k per year.
I’m using (SGOV), (SHV), and (BIL) as my cash substitutes. These are short-term Treasury ETFs. Prices are extremely stable. Liquidity is excellent.
I use a Schwab business account that is not part of my portfolio. The only assets it holds are actual cash and cash substitutes (those 3 ETFs).
Nearly all my expenses go through my credit card already (paid off in full each month).
I still have my checking through USAA because of the long history on those credit cards. If I need cash, I can sell Treasury ETFs and transfer the funds to my USAA account.
It takes a few days, but that’s fine.
This is a pretty nice return for cash I was going to have there anyway.
Note: Some people think you don’t need a strong credit score after getting a mortgage. I disagree. The long history on those cards is extremely useful if I want to boost someone’s credit score. If I add someone to my card, their next update will show they have a card with 20 years of perfect history.
You can get scammed this way. You are liable for the bill. They can just charge the card and walk away. This doesn’t concern me because I keep a lower limit (such as $10k) on those cards and I’m only doing it for people I trust. If one of those people betrays me, I’ll count myself lucky that I found out for only $10k. For people who can’t afford to risk that money, this would be too dangerous.
Housekeeping
We used to have a repeated section on strategy, but I wanted to shorten the update.
I’ll be posting an article that covers our strategy in greater depth and just adding a link to that post.
We have a project underway to update our guides and improve the organization.
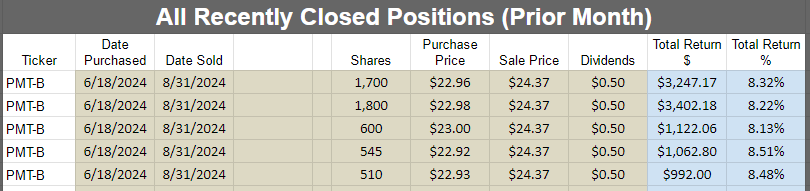
Recently Closed Positions with Returns
These are the positions closed during the prior calendar month. If you want to see positions that were closed before that, you can see the prior portfolio updates or use the Google Sheets.
If we didn’t close any positions for the sector during the month, then the image will be blank.
Note: By loading the Google Sheets, you can still see all of our closed positions. We only include the recently closed positions to reduce the size of the article:
Recently Opened Positions with Returns

All Open Positions by Sector with Returns
We will start with the open positions as of the end of the month. It often takes a few days to prepare this article, but the screenshots below are from the end of the prior month.
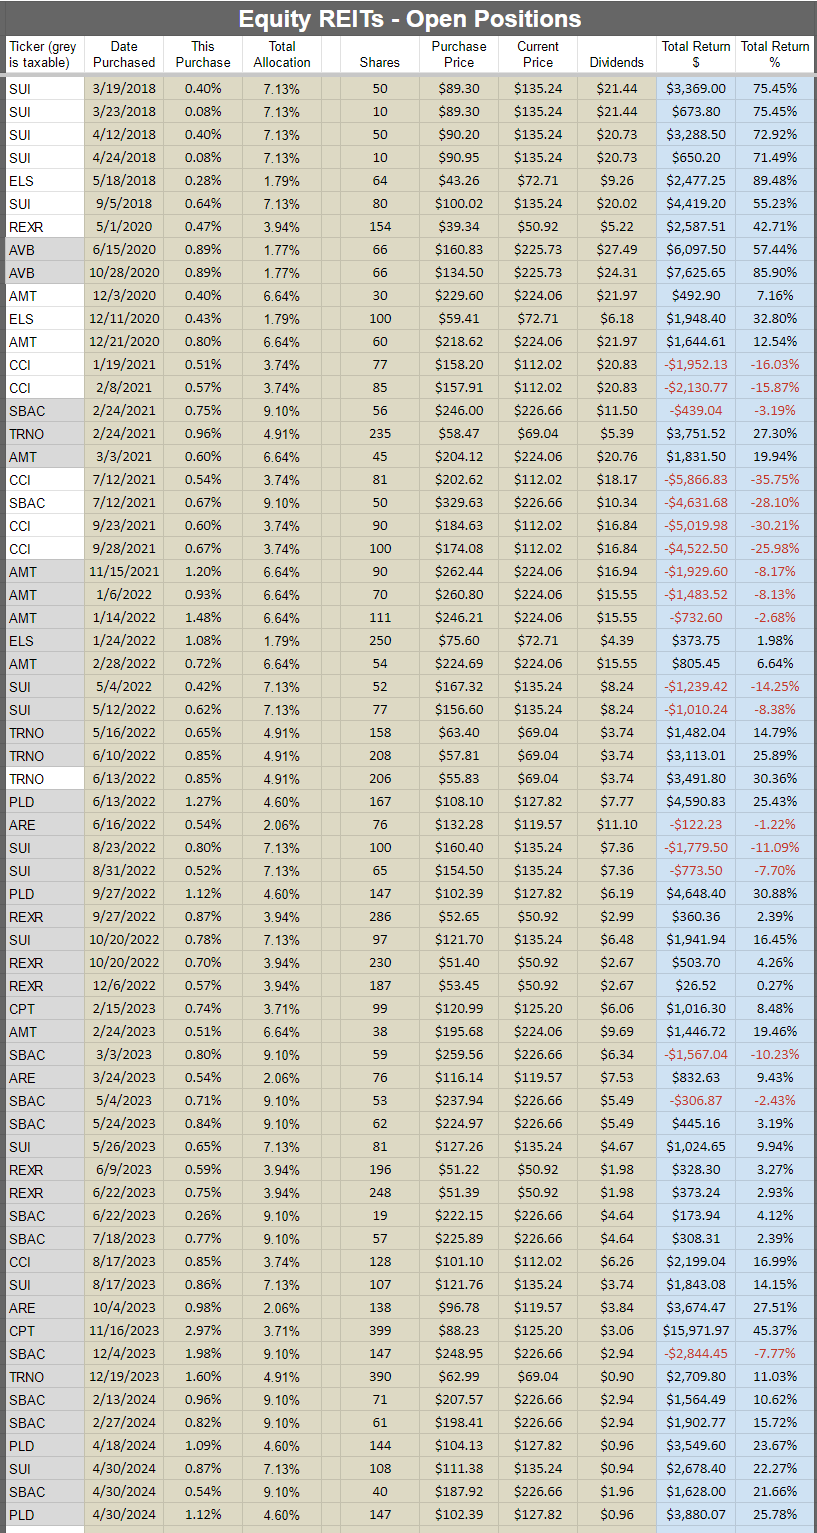
The cell with the ticker is grey if the position is in a taxable account. This was a request by a few members and there was no drawback to adding the information. All of the taxable positions are in equity REITs.
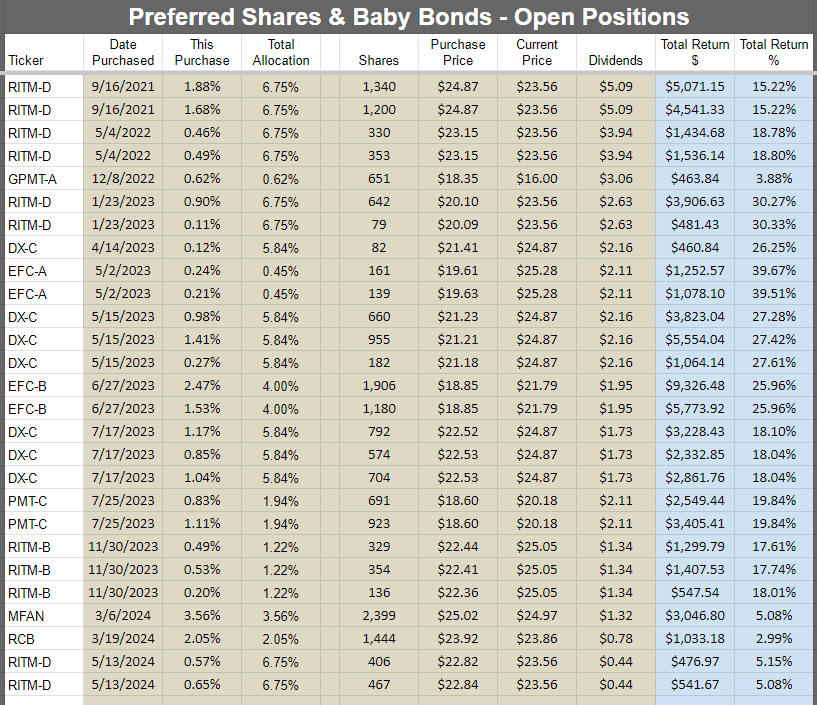
Preferred shares and baby bonds:
Equity REITs:
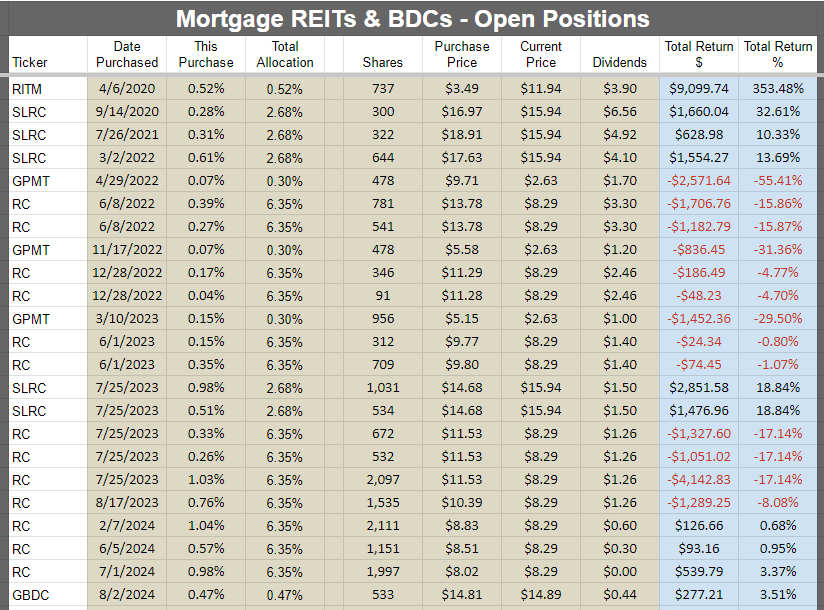
Mortgage REITs and BDCs:
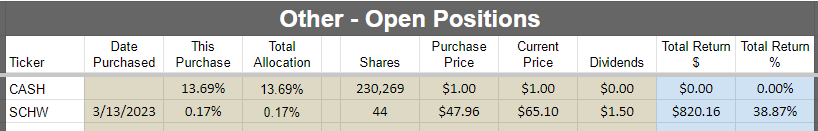
Other:
Subsequent Changes
None so far.
Outlook
The big dip in rates looks very favorable.
Foreshadowing Potential Trades
This section is usually prepared shortly before publishing. The goal is to quickly cover ideas for trades. We aim to foreshadow our trades here, though the market may move in surprising ways. While the article takes days to prepare and documents prices and performance from the end of the month, the potential trades section is written last to provide the most up-to-date pricing.
Based on the change in relative prices as of 08/31/2024 here are some of the trades on my radar.
Note: Prices are from the end of day.
Paid Section Begins
Following Friday’s sale of PMT-B, we have quite a bit more cash in the portfolio.
I’m interested in doing some more trading in the preferred share and baby bond space.
I’m still considering closing out GPMT-A (GPMT.PR.A) because the risk profile increased significantly during the time we’ve had shares. There’s huge potential upside, but management left a great deal to be desired. If you ever think the world is a meritocracy, try to explain how much those idiots got paid.
We're still in the shares due to the deep discounts, but I'm still evaluating my thoughts on this position.
The shares that are on my radar (for buying) presently include two baby bonds and four preferred shares:
Baby bonds:
- RCB (RCB) $23.86
- MFAN (MFAN) $24.97
Preferred shares:
- DX-C (DX.PR.C) $24.87
- AGNCO (AGNCO) $24.91
- RITM-A (RITM.PR.A) $25.15
- RITM-B (RITM.PR.B) $25.05
- RITM-D (RITM.PR.D) $23.56
Note: I’ll need to do some slight target adjustments for the shares that are not floating yet. They are now closer to their floating date, which should be favorable so long as rates don’t really plunge.
The baby bonds
RCB has a healthy discount to call value. If interest rates really fall, that’s all upside. I don’t see a scenario where RCB calls in this bond though when the coupon rate is only 6.2%. Maturity is 7/30/2026. The yield to maturity is around 9.47%. That seems like a reasonable spread. However, if I purchase shares, I would be perfectly fine dumping them on a modest rally. Since maturity is less than two years away, a modest change in the price can have a material impact on the yield to maturity.
For comparison, RCC has a lower coupon rate (5.75% vs. 6.20%), trades $.31 higher ($24.17 vs $23.86), and only matures about 5.5 months earlier (2/15/2026 vs 7/30/2026).
Looking at MFAN, I give it a very modest edge over MFAO. MFAN costs $.28 more than MFAO. I think the gap should be about $.15 rather than $.28. So I’ll keep MFAN on the radar also.
I already have positions in both of these baby bonds, but the cash flow profile looks attractive.
Preferred Shares
DX-C starts floating 4/15/2025. The spread is 5.461% + 3-month LIBOR, which means 5.461% + 0.26161% + 3-month SOFR. That looks like a pretty good spread for how careful DX management has been. Short-term rates may go lower, but let’s say they stop at 3%. That’s lower than the forward curve implies. In that scenario, the combined coupon rate would be 8.72%. That seems pretty good for DX. NLY-F (NLY.PR.F) and NLY-I (NLY.PR.I) trade at a negative yield-to-call and their spreads are both pretty close to 4.99%. I’m inclined to think DX-C might achieve a negative yield-to-call also when the floating-rate dividend starts.
AGNCO probably needs a slight boost to targets because shares are getting so close to floating. We’re already in the last fixed-rate dividend period. Should AGNCO ($24.91) really trade more than $.60 below AGNCN ($25.52)? Probably not. It’s only one dividend. When both shares float, the difference in the spread is 4.993% for AGNCO vs 5.111% for AGNCN. That is slightly bigger than a rounding error.
Investors in AGNCN would be better in AGNCO if they can clear $.60 in the exchange AND don’t get hit with any taxes.
RITM-D is already a significant position in my portfolio. The rate doesn’t reset until 11/15/2026, but the spread is pretty big at 6.223% over the 5-year Treasury rate. Absent a big recession or depression, I think those shares probably trade around $25.00 when the rate resets. Maybe higher. They will be callable, so probably not dramatically higher. A call wouldn’t be surprising. The yield to call is about 10.5%, which sounds like a nice return over that period.
RITM-A and RITM-B are a different situation. Shares are already floating and have about half of a dividend accrued. Adjusted for the dividend, the shares would be trading below call value. Given the big spread on shares, I find that a bit interesting. I would expect these to trade closer to call value or potentially even at a slightly negative yield to call. Shares have about $.36 to $.37 of dividend accrual. I’m expecting the next ex-dividend around the middle of October. So I would probably try to hold through the ex-dividend and then dump around $25.00. However, if share prices exceeded $25.00 plus dividend accrual, that could get me to pocket gains and walk away also.
Theoretically, if we hold through an ex-dividend and dump around $25.00, we would be looking for returns around 2%.
Yeah, it seems tiny. But it would be about 45 days. That would be around a 17% annualized rate. I’d be more than happy with that.
Conclusion
Thanks for reading. I hope you find the ideas in this article helpful as you navigate the markets.
I apologize in advance for any typos. With such a large document, having at least one or two is common. If you’re reading this more than a day after publication, check the comments section for any corrections.
Member discussion