
Portfolio Update - October: Bargain Hunting Gets Harder

Just a quick note to start: We skipped the Weekly Update last weekend because it was right before the end of the month. It makes more sense to focus on having the values projected for the end of the quarter since those are the values we will compare to the results when management announces them.
September included a cut in short-term rates and rates across the curve declined further. All around it should be positive. We saw a modest rally, but not much relative to the decline in rates.
I ended up taking profits on a few of our older positions, but our gains for the month were weaker than the indexes for our sectors. Despite having REITs that have historically been sensitive to interest rates and having interest rates fall, we just didn’t see the kind of rally we would have liked to see.
I ended the month with our portfolio positioned a bit more defensively after selling a few preferred shares right before the end of the month.
A Strange Disparity
We’re one of the very few services that provides a monthly update with comparisons of our performance to relevant index ETFs.
In September, we underperformed the indexes.
We win more often than we lose, but every service will have some months when they underperform.
I decided to break down the relative performance again. This isn’t a usual part of the series, but I did it last month and felt it was worth doing again.
Our comparison is against an equal mix of PFF, MORT, VNQ, and KBWY. That comes out to 25% preferred shares, 25% mortgage REITs, and 50% equity REITs (VNQ and KBWY are both equity REIT ETFs).
We usually have a bit of cash in the portfolio which can buffer downturns but also reduces performance during positive months.
Where Did Our Performance Differ?
The cash allocation was a material factor. We’re collecting short-term Treasury rates on most of the cash. That’s much better than not getting interest, but it still means the return on cash is only about 0.4% per month. If the market dips, that can be great. When the market climbs, it can drag on our performance. We started the month with 13.69% in cash. That was a factor, but not as big as it might seem. Had the portfolio been jumping higher, then the drag from cash would be more important.
Note: Dividends are included.
For preferred shares, our gains were only slightly behind the index (about 2.96% vs. 3.19%). That’s fine. The index has a bunch of lower-coupon fixed-rate shares. Consequently, it had more to gain from rates falling. The majority of our allocation is in fixed-to-floating preferred shares or fixed-to-reset preferred shares.
For equity REITs the spread was wider. The average of the index ETFs was up 3.64% while our equity REITs were up 1.66%. Our equity REIT allocations are pretty concentrated. We’re primarily invested in cell tower REITs, industrial, and housing (primarily MH park). The cell tower REITs were great on the month with gains from 3.79% to 7.3%.
Despite Blue Orca attacking Sun Communities (SUI), SUI only dropped 0.07% on the month. That was better than any of the other positions in housing REITs or industrial REITs. We also have a small position in Alexandria (ARE), which was down slightly on the month.
The mortgage REITs and BDCs section was also challenging. Granite Point Mortgage Trust (GPMT) finally produced a positive month with a gain of about 20%. However, my primary (larger) allocations for the sector are Ready Capital (RC) and SLR Investment Corp (SLRC). The sector ETF was up 1.34%, which was a smaller gain but it was painful because we were down about 3.41%. Ready Capital was down 4.95% and SLRC was down 3.01%. Those outweighed the gains in GPMT and GBDC.
Interest Rates
Treasury rates moved lower during September across the yield curve. The 10-year rate is still trending down, though it broke the 25-day moving average:
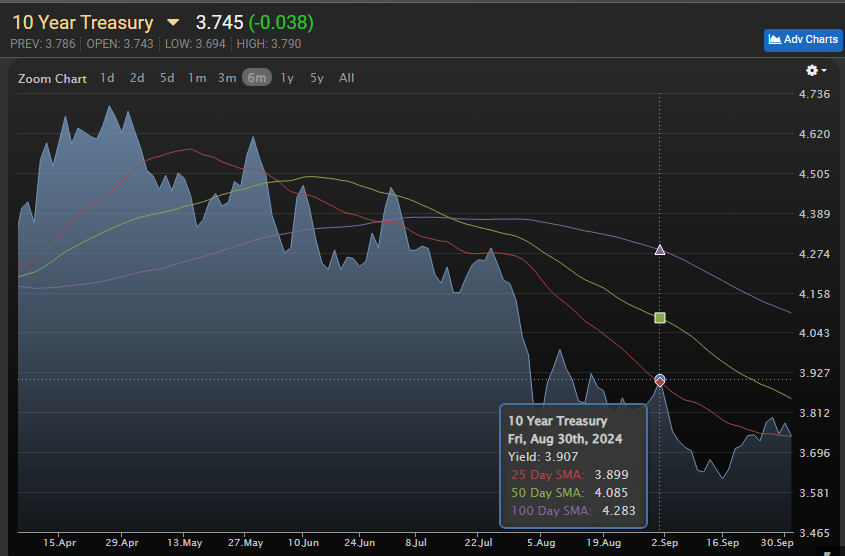
Source: MBSLive
The 2-year Treasury rate is still moving lower and still slightly below the moving average:
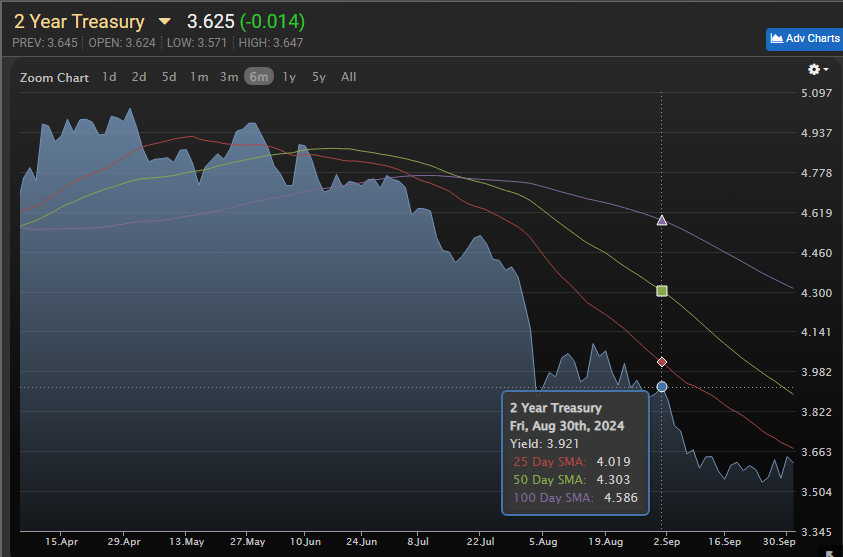
Source: MBSLive
Portfolio Updates
You can find prior installments of the Portfolio Updates on the Portfolio tab of our website.
Older editions of the Portfolio Update are unlocked for everyone. The newest release reserves the foreshadowing section for paid members.
Trade Alerts
We have a page on our REIT Forum website to link all trade alert articles.
Here are The REIT Forum’s trade alerts.
Layout - Modified Order
To keep things simple for our investors, the rest of the portfolio update is divided into several segments. We run the same segments (with new content) each week.
We usually maintain the same order from month to month, but I revised the order to work better with free previews. Eventually, the order will be locked in again.
- Returns on Total Portfolio
- Sector Allocation
- Reminder About Cash
- Housekeeping
- Recently Closed Positions with Returns
- Recently Opened Positions with Returns
- All Open Positions by Sector with Returns
- Outlook
- Foreshadowing Potential Trades (paid section)
This layout maximizes transparency while keeping the foreshadowing of our potential trades within the paid section. It also loads the images together at the front, while putting the text-heavy sections together at the end.
Returns on Total Portfolio for Colorado Wealth Management Fund
Note: The presentation of the charts was modified slightly to enable running it through Google Sheets instead of Excel to reduce transferring data.
The chart below shows our performance since we began preparing for The REIT Forum at the start of 2016 through the end of the latest month:

There are four major index ETFs we use for evaluating performance. They are:
- (MORT) $MORT - Major mortgage REIT ETF
- (PFF) $PFF - The largest preferred share ETF
- (VNQ) $VNQ - The largest equity REIT ETF
- (KBWY) $KBWY - The high-yield equity REIT ETF most retail investors follow
Annual comparison vs. each ETF:

Our performance vs. the average of the ETFs:
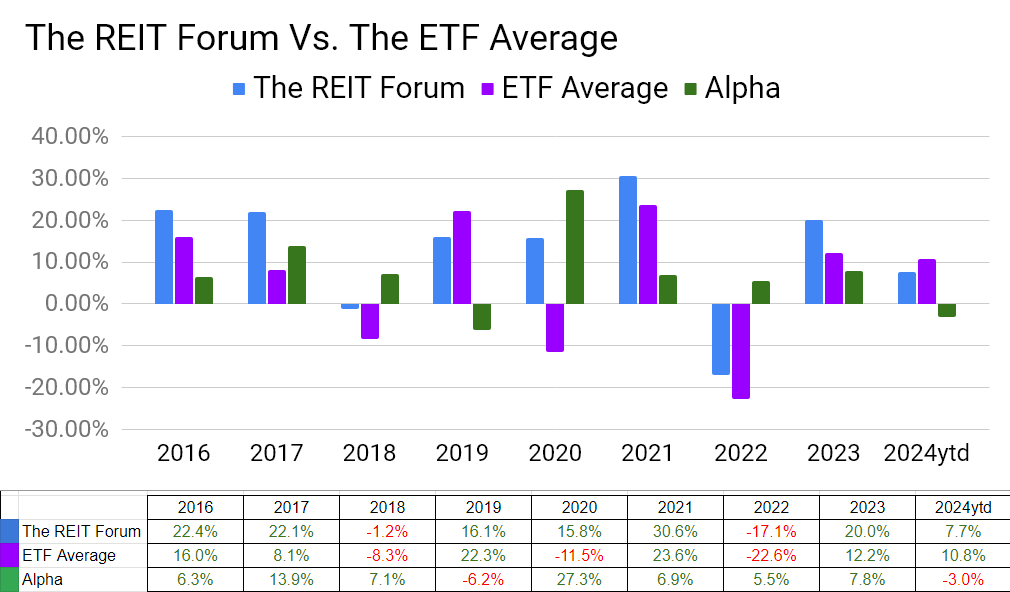
We evaluate alpha based on performance against the ETFs because it strips out the general change in our sectors.
We delivered a respectable gain in August, but the indexes took the lead. Trailing this late in the year has been a rare occurrence.
The next chart shows the change in the value of our portfolio from month to month. We strip out the impact from contributions made during the month because, obviously, contributions are not returns.
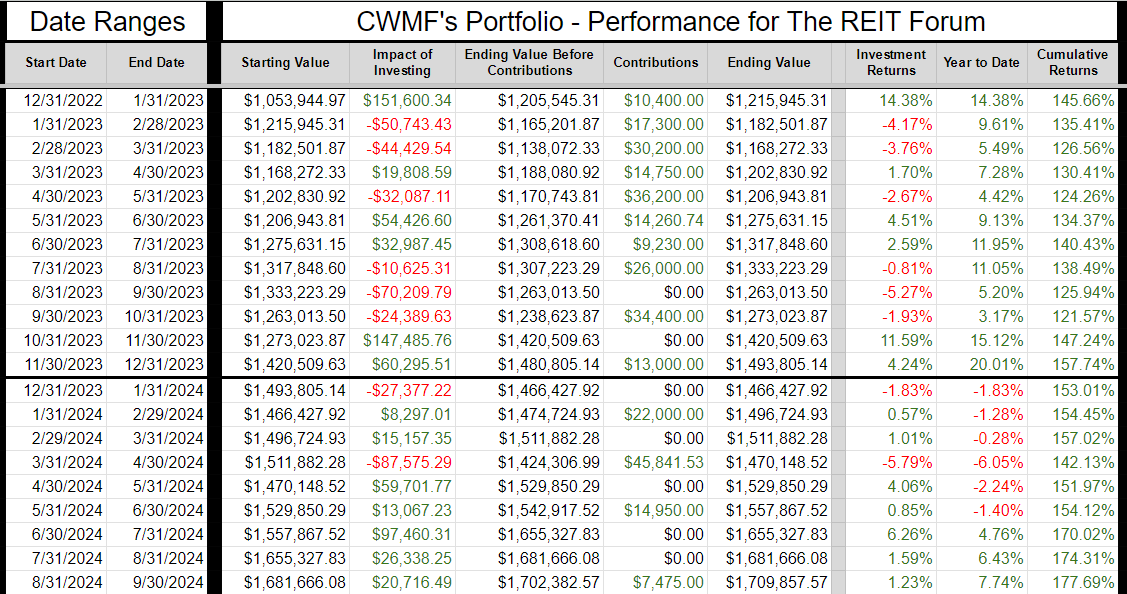
The prior year is included as well to help investors see how the calculations work.
If anyone is confused by these calculations, let me know. I believe this transparency is crucial, so I’ll include an example showing every calculation if I hear that readers have any difficulty following it.
Sector Allocation Chart
The sector allocation chart helps to explain how we are thinking about risk and seeking returns:

Reminder About Cash (repeated)
I normally keep at least 6 months or more of living expenses in “cash”. If you normally keep around $40k to $50k in “cash”, the difference between getting paid 5% and 0.2% is around $2k per year.
I’m using (SGOV), (SHV), and (BIL) as my cash substitutes. These are short-term Treasury ETFs. Prices are extremely stable. Liquidity is excellent.
I use a Schwab business account that is not part of my portfolio. The only assets it holds are actual cash and cash substitutes (those 3 ETFs).
Nearly all my expenses go through my credit card already (paid off in full each month).
I still have my checking through USAA because of the long history on those credit cards. If I need cash, I can sell Treasury ETFs and transfer the funds to my USAA account.
It takes a few days, but that’s fine.
This is a pretty nice return for cash I was going to have there anyway.
Note: Some people think you don’t need a strong credit score after getting a mortgage. I disagree. The long history on those cards is extremely useful if I want to boost someone’s credit score. If I add someone to my card, their next update will show they have a card with 20 years of perfect history.
You can get scammed this way. You are liable for the bill. They can just charge the card and walk away. This doesn’t concern me because I keep a lower limit (such as $10k) on those cards and I’m only doing it for people I trust. If one of those people betrays me, I’ll count myself lucky that I found out for only $10k. For people who can’t afford to risk that money, this would be too dangerous.
Housekeeping
We used to have a repeated section on strategy, but I wanted to shorten the update.
I’ll be posting an article that covers our strategy in greater depth and just adding a link to that post.
We have a project underway to update our guides and improve the organization.
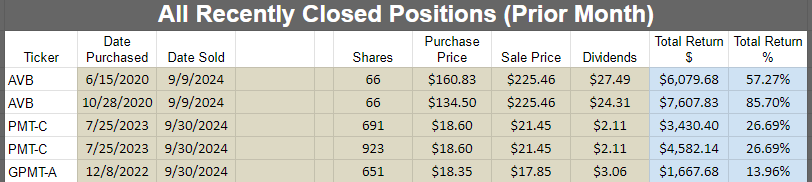
Recently Closed Positions with Returns for Colorado Wealth Management Fund
These are the positions closed during the prior calendar month. If you want to see positions that were closed before that, you can see the prior portfolio updates or use the Google Sheets.
If we didn’t close any positions for the sector during the month, then the image will be blank.
Note: By loading the Google Sheets, you can still see all of our closed positions. We only include the recently closed positions to reduce the size of the article:
Recently Opened Positions with Returns

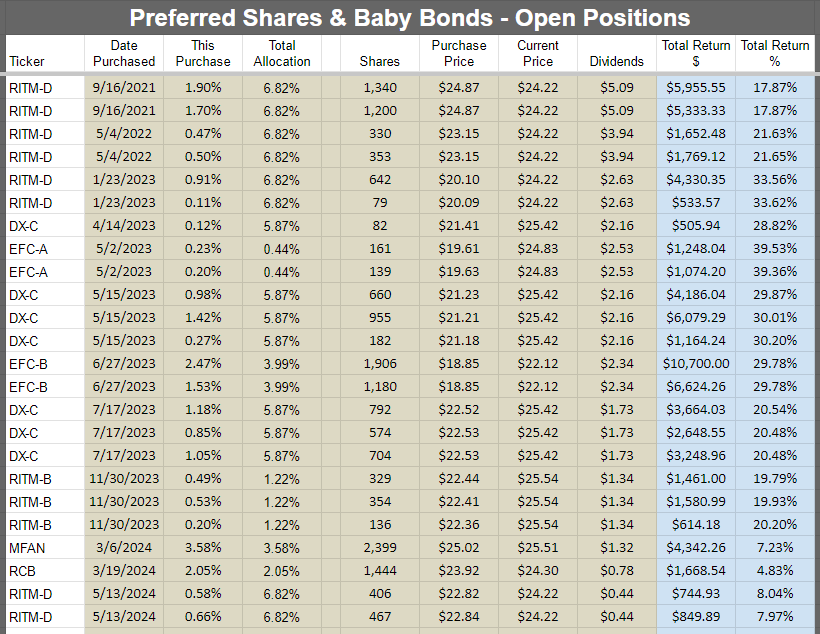
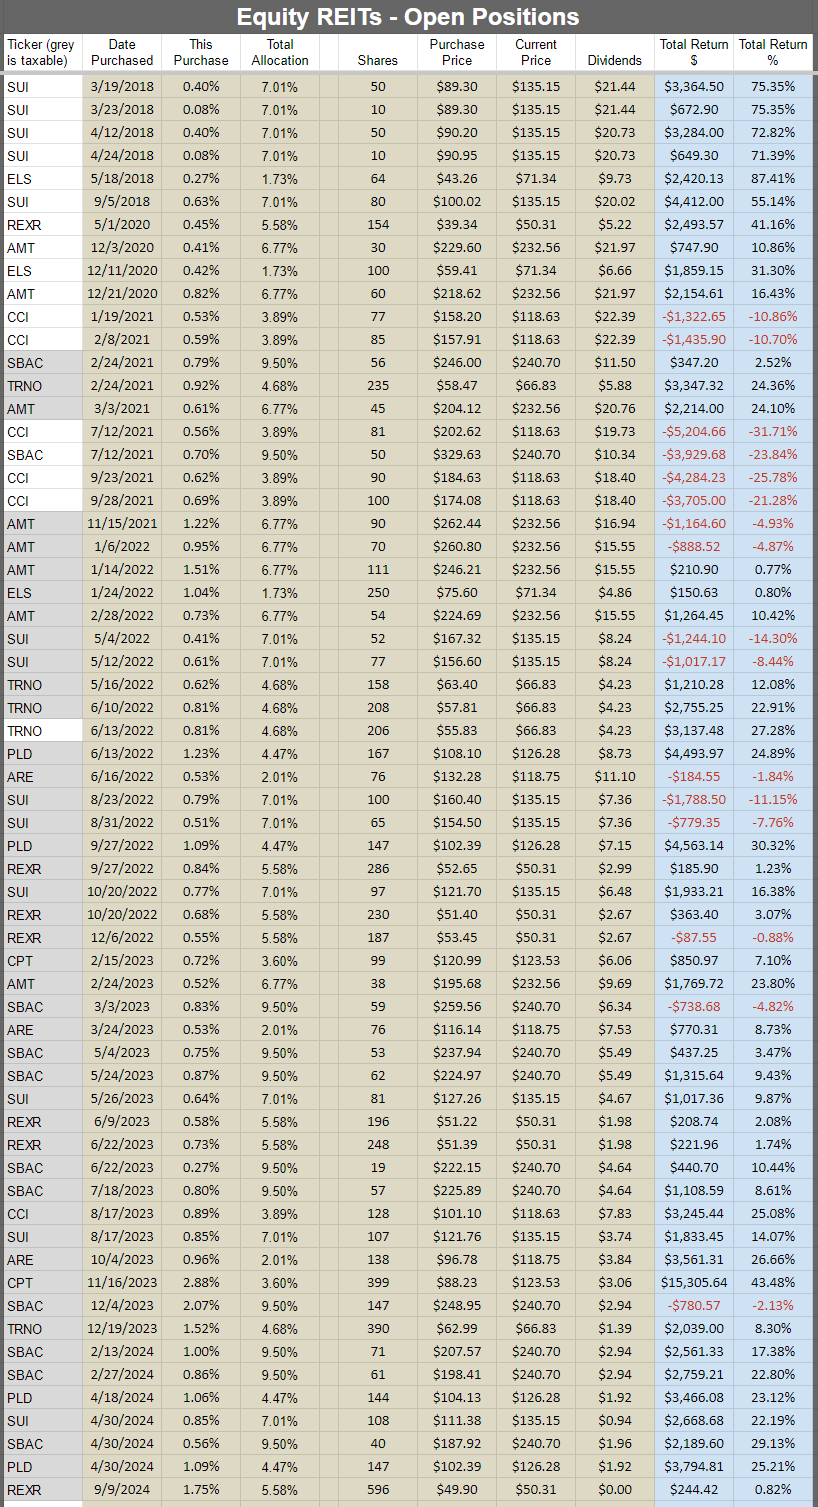
All Open Positions by Sector with Returns for Colorado Wealth Management Fund
We will start with the open positions as of the end of the month. It often takes a few days to prepare this article, but the screenshots below are from the end of the prior month.
The cell with the ticker is grey if the position is in a taxable account. This was a request by a few members and there was no drawback to adding the information. All of the taxable positions are in equity REITs.
Preferred shares and baby bonds:
Equity REITs:
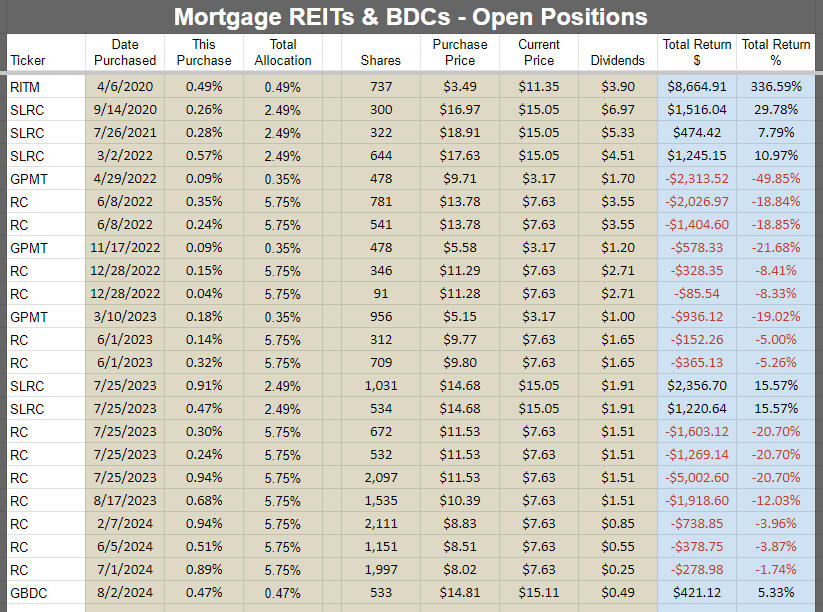
Mortgage REITs and BDCs:
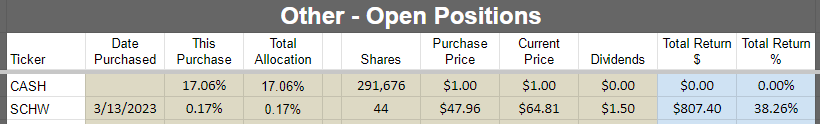
Other:
Subsequent Changes
I picked up an extra 919 shares of Ready Capital (RC) at $7.4264 per share. Brings my average cost down again. Normally averaging down has worked very well for me as the eventual recovery provides a nice gain. Thus far it hasn’t worked here, but there’s still time.
Foreshadowing Potential Trades
This section is usually prepared shortly before publishing. The goal is to quickly cover ideas for trades. We aim to foreshadow our trades here, though the market may move in surprising ways. While the article takes days to prepare and documents prices and performance from the end of the month, the potential trades section is written last to provide the most up-to-date pricing.
Based on the change in relative prices as of 10/01/2024 here are some of the trades on my radar.
Note: Some prices are end of day, some are during trading. It takes a bit to prepare this section for subscribers.
Paid Section Begins
If you're a paid member through our website or have an active trial and see a banner below, you need to click "sign in". Enter your email address and you'll get a link to sign you in. It usually takes under 5 seconds for our email to arrive. There is no password. You don't need to log out afterwards unless you're using a public computer.
This section is really long. Consequently, I created a condensed section at the end of the "Potential Trades" that summarizes the key points into 7 bullet points.
We ended the month by taking the gains in PMT-C (PMT.PR.C) and GPMT-A (GPMT.PR.A).
We rarely trade right before the close, but the end of the month can provide some extra liquidity and we foreshadowed the trades.
In this very section last month, I referenced debating closing out GPMT-A:
“I’m still considering closing out GPMT-A (GPMT.PR.A) because the risk profile increased significantly during the time we’ve had shares. There’s huge potential upside, but management left a great deal to be desired.”
Shares climbed from $16.00 to $17.85 at the time of our sale. That was an increase of 11.56% relative to the prior commentary. Given that I had explicitly discussed selling the shares and we saw that big rally, I decided to take the gains and walk away.
I provided some additional detail on both trades in the trade alert article.
Ready Capital is one of our higher risk positions and it hasn’t delivered so far, but I’ve been adding to the position and bringing my cost down. I’d like to see some improvements in the numbers, but I could probably be satisfied with some strong commentary. They’ve had their hands full with bad loans since the BroadMark acquisition. I would be happy to see them stand their ground with borrowers and play hardball. Let the developer walk. Sell the project to a different developer. Borrowers are going to default strategically so long as they believe they can get some value out of it. Some would still default because they are upside down, but that’s to be expected.
The Baby Bonds
I would like to be investing more in the baby bond space, but the valuation I’ve been looking for is not present. Lower Treasury rates could push targets up a tiny bit, but it would be pretty small adjustments. Absent a swing in prices, I don’t foresee allocating much more capital there. I might even be pushed to take gains on swings in valuation.
Preferred Shares
It’s harder to find value today. An analyst who wants to ensure they have plenty of buy ratings could push targets up or cover riskier shares to get a higher yield. Neither of those sounds good to me. I really enjoy investing in the preferred share space, but it’s tougher to find those bargains after a big rally. I’ll have a few adjustments, but nothing that would get investors pumped up to throw money in. There’s already many investors who are pumped to throw money in. Just take a look at the spreads for high yield bonds:
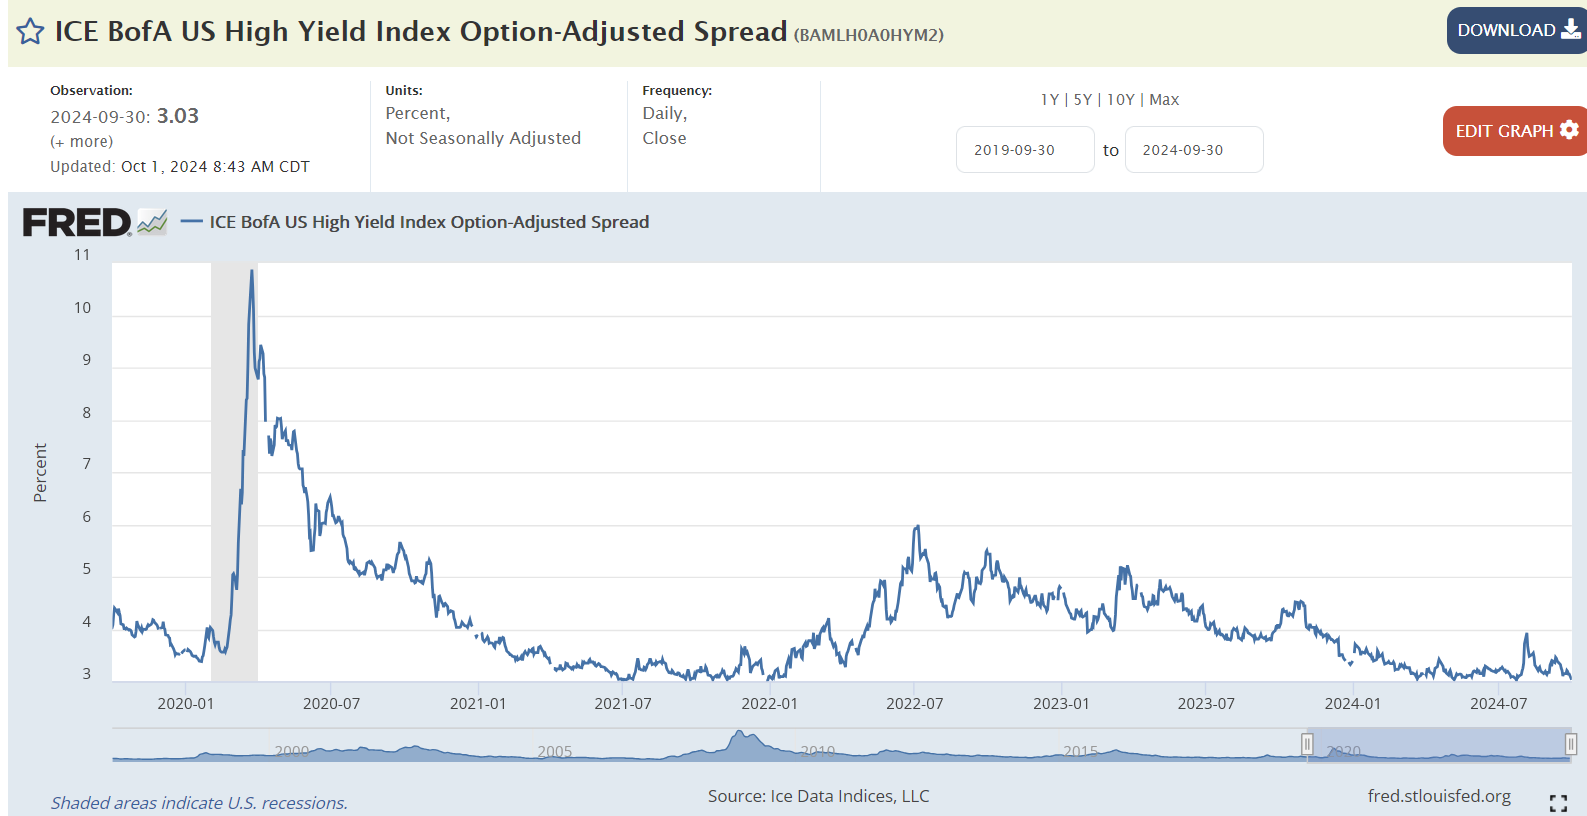
That 3.03% value is extremely low. The market seems pretty optimistic overall with those thin credit spreads. That’s a big headwind. It’s much harder to find bargains when investors start looking to deploy capital regardless of the spreads.EFC-A (EFC.PR.A) is a candidate for taking gains. Shares just went ex-dividend. The yield to call appears to be very slightly negative. Does it look bad if I close that position?
We bought EFC-A at $19.61 and $19.63 in May 2023. We’re up about 40% including dividends. Great choice. We got everything we were hoping for.
I was debating with EFC-B (EFC.PR.B). On one hand, shares are 6.5% over our target. On the other hand, I think the target needs an adjustment because the annualized yield-to-call is about 11.9%. For a share with a risk rating of 2.5 and a reasonable spread over the 5-year Treasury rate (4.99% spread) when the rate resets (1/30/2027), that is probably one of the bargains.
Therefore, I think I’ll adjust targets a bit higher and I’ll continue sitting on EFC-B for now. Of course, if the price jumped higher, I would take my gains and head for the door.
Looking at EFC-B relative to EFC-C (EFC.PR.C), I think EFC-B is clearly the superior bargain. Noone knows what the 5-year Treasury rate will be on 1/30/2027 for EFC-B or 4/30/2028 for EFC-C. However, EFC-C’s spread is only slightly larger and the annualized yield to call is quite a bit lower. EFC-C has the bigger dividend today, but I think the yield to call is more important for this comparison.
RITM-C (RITM.PR.C) is going to get a modest target boost. The annualized yield to call looks great at 17.7%. However, the spread is “only” 4.969%. Looking at RITM-A (RITM.PR.A) and RITM-B (RITM.PR.B), we can see that even having a spread of 5.802% or 5.64% only has the shares trading very close to a $25.00 stripped price. Therefore, it would stand to reason that RITM-C probably trades moderately lower than $25.00 plus dividend accrual. If that’s the case, then the performance should be weaker than the yield to call. So I just see a slight bump there. Also, the 17.7% figure looks huge, but annualizing is a big factor there. The shares begin floating (and become callable) on 2/15/2025. That’s not too far away, so the compounding in the yield to call is doing some heavy lifting.
MBA-B (MFA.PR.B) deserves to be mentioned. I don’t like the value. Stripped yield of 8.22%. Upside to call value (best case scenario and unlikely unless rates really fall with no economic disruption) is a little over $2.00. The baby bonds (MFAN) and (MFAO) have yield to maturities around 8.8% or higher. The yield to call is lower, around 7.88% and 8.17% respectively. However, baby bonds rank higher in the capital stack and that can be a big deal when credit spreads increase.
Just consider the $100k chart to understand how much MFA-B already outperformed:
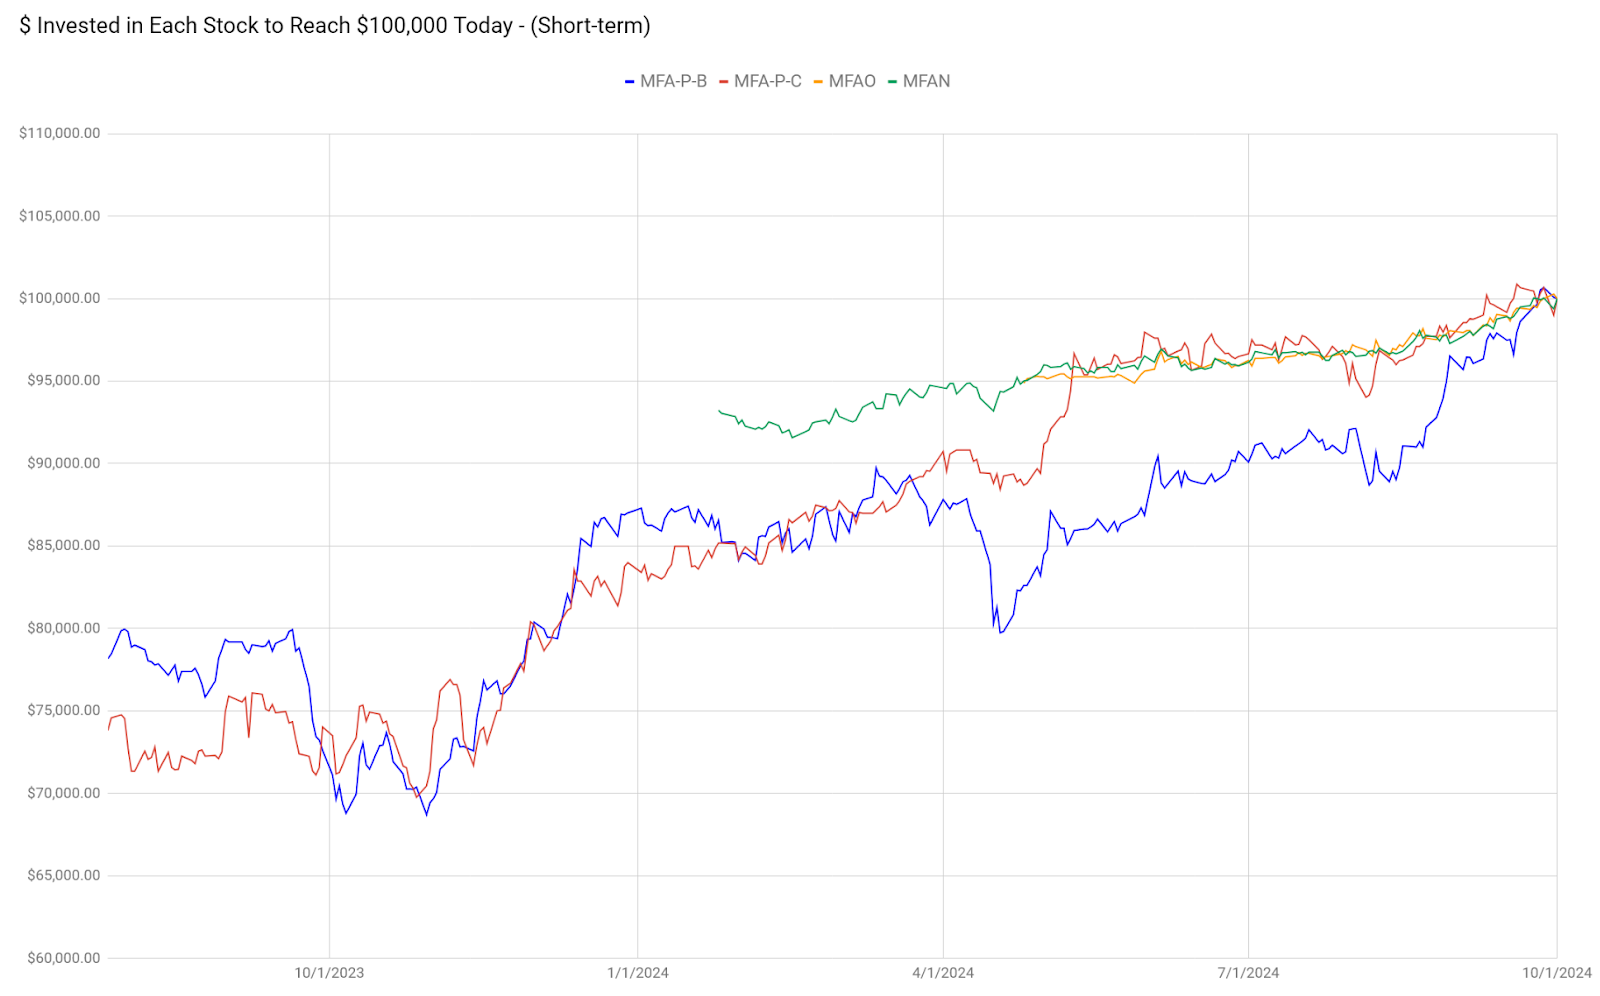
Are you kidding me? I wouldn’t buy MFA-B here. I would require more upside potential to offset the risk.
Next up, IVR-C (IVR.PR.C). Shares don’t begin floating until 9/27/2027. The yield to call (seems like the best scenario here) is 8.8%. This is a pretty risky share for such a meager yield to call.
IVR-B (IVR.PR.B) floats sooner. It starts late this year. The yield to call is 9.9%, but that’s not really relevant because we’re annualizing slightly under one quarter of a year.
Who really gets excited about IVR-B at a 5.18% spread? AGNCO (AGNCO) is substantially less volatile and has a 4.993% spread. The yield to call on AGNCO is only 4.2%, but that’s because shares could be called in 30 days. If an investor bought AGNCO and only got the 4.2% yield to call, it would require shares to be called immediately. Each additional day that shares earn their dividend rate pushes performance higher. That’s clearly a better scenario.
AGNCO is currently $25.02. It just went ex-dividend. I might start a position (probably short-term). AGNCN (AGNCN) only has a slightly better spread at 5.111% and AGNCN is trading at $25.57. That’s some nasty call risk for whoever buys AGNCN. I absolutely wouldn’t play with that. But the appeal for AGNCO is the potential for it to be priced roughly similar to AGNCN in the future. That would be great. If AGNC surprises us by announcing an immediate call, at least AGNCO doesn’t get screwed. Sure the 4.2% annualized rate for an immediate call isn’t exciting, but being locked in at 4.2% for a month isn’t a disaster either.
Equity REITs
Rexford (REXR) is the one that’s on my mind most presently. I could see adding a little bit to that. I appreciate the impact of lower rates there.
There’s the negative news regarding dock workers striking, but it is hitting the East Coast and Gulf Coast. As you may know from geography class, California is on the West Coast.
Of course, they have strikes occasionally as well and victories in one area can drive more whining in other areas..
I try to be sympathetic to people, but I have a hard time here. Wages are already great for dock workers thanks to a very powerful union. That’s fine. They should be trying to earn more money for themselves. Who am I to blame someone for trying to make money?
However, I don’t respect the goals here.
As I wrote in Discord today:
“To ensure I offend sensibilities on both sides, I'll say two things:
- There are some strikes I support.
- I hope we get some business committed to absolutely crushing and annihilating the ILA (International Longshoremen's Association).
I respect the concept of strikes. But the ILA has been using them to fight for not only wages far above the skill level required, but also bans on using machines to do a job humans can do slowly. Fighting for wages, even with already above-market wages, is fine. But they try to ban the use of any highly efficient machinery in ports specifically because it would reduce the number of jobs. In other words, they are striving to cripple the effectiveness of the industry. Do these port workers refuse to use a dishwasher or laundry machine at home because it reduces jobs? Do they buy their milk from a local milk man? Do they refuse to place a phone call without a telephone operator? Refuse to use home plumbing that isn't connected to a well on their property? Probably not, because it is only their job that is special. It is only their overpaid and inefficient job that they want the rest of the country to subsidize. Had these people been employed to carry things before the invention of the wheel, they may have lobbied against that also. As for REXR, it appears the strike is targeting East Coast and Gulf Coast ports, rather than West Coast ports. So these specific strikes shouldn't be negatively impacting any REXR properties. On the other hand, each victory for the ILA sets the stage for further barriers to efficient movement of goods.”
I checked on the rest of the union’s demands and it seems like a complete non-starter.
Here’s the typical dockworker pay, before overtime:
- No experience: $20.00/hour
- 2-years: $24.75/hour
- 3-years: $31.90/hour
- 6-years: $39.00/hour
There is no mention of using productivity in the equation, which basically ensures an inefficient system.
CBSNews, not usually a critic of labor unions, wrote:
“That top-tier hourly wage of $39 amounts to just over $81,000 annually, but dockworkers can make significantly more by taking on extra shifts. For example, according to a 2019-20 annual report from the Waterfront Commission of New York Harbor, about one-third of local longshoremen made $200,000 or more a year.”
Since that wasn’t good enough, the dockworkers want to see massive increases.
The new demand:
- No experience: $44/hour
- 1-year: $49/hour
- Increases by $5/hour for each year until it reaches $69/hour
Forget college. Here’s the new path for high schoolers:
- Play low-injury sports and hit the weight room.
- Find a way into the dockworker’s union (nepotism, bribes, etc.) around 17 or 18. You think they get high wages by just letting qualified people join? Are you kidding me? Kid might have to lose some muscles first to ensure he isn’t moving too many containers per hour.
- Work overtime. If this passes, no experience would get paid more than the prior maximum.
- Live with parents if they are near the port. Overtime means minimal free time.
- Retire around 30.
Summarizing All Potential Trades for Colorado Wealth Management Fund
To summarize:
- I would like to be buying baby bonds, but I can’t get the right price. If prices keep going up, I may need to take gains and wait for a new opportunity.
- Might enter AGNCO for a trade. AGNCN is overpriced.
- Might sell EFC-A. I have more EFC-B, but that target will be going up moderately. EFC-B looks better than EFC-A / EFC-C, or EFC-E. EFC-D is a fixed-rate share so it wouldn’t be a good comparison.
- RITM-C needs a modest bump to targets on the high yield to call, but not a big bump because shares should continue to trade at a lower value than RITM-A and RITM-B.
- MFA-B outperformed too much. The bonds are offering a similar yield (higher yield to maturity, or slightly lower if we use the yield to call for the bonds).
- IVR-C and IVR-B just look like raw deals. Too much risk to get a spread that is only slightly better than the lower-risk shares.
- Might add a bit to REXR. They benefit from lower interest rates and I still like the long-term fundamentals.
Conclusion
Thanks for reading. I hope you find the ideas in this article helpful as you navigate the markets.
I apologize in advance for any typos. With such a large document, having at least one or two is common. If you caught any, let me know in the comments. If you’re reading this more than a day after publication, check the comments section for any corrections.
Member discussion