
Portfolio Update - November: A Brief Glimpse of Lower Rates
One of the series we provide on our premium service is the monthly portfolio update. Some months, including this one, I make the Portfolio Update available to all members.
We also set up part of the website to make it easy to find all prior installments of our Portfolio Update series.
Main Points
- My primary focus is still looking at the preferred shares with upcoming floating rates. The risk/reward profile still looks great.
- More sector updates are on the way.
- REITs had a rough time in October amid rising rates. It was a great period for our alpha though. Values declined, but the dips were smaller in our portfolio.
- REITs soared in early November when 10-year Treasury yields dipped.
To keep things simple for our investors, the portfolio update is divided into several segments. The recurring segments are:
- Foreshadowing Potential Trades
- Trade Alerts (links to trades)
- Returns to Date on Open Positions
- Returns on Recently Closed Positions
- Returns on Total Portfolio
- CWMF’s Portfolio Images
- Sector Allocation
- Conclusion
- Strategy (Repeated) - This explains how we invest. It helps investors understand why we place the trades we do.
Foreshadowing Potential Trades (New Section Begins)

Note on target updates: Expect negative revisions across equity REITs outside the net lease and residential subsectors (already updated). Despite a dip in Treasury yields from late October to early November, they remain significantly elevated compared to prior years. Higher interest rates are impacting costs for refinancing debt and providing investors with additional opportunities for yields.
This section is usually prepared shortly before publishing. The goal is to quickly cover ideas for trades. We aim to foreshadow our trades here, though the market may move in surprising ways. While the article takes days to prepare and documents prices and performance from the end of the month, the potential trades section is written last to provide the most up-to-date pricing.
Based on the change in relative prices as of 11/12/2023, here are some of the trades on my radar.
Foreshadowing potential equity REIT trades
Because of the preferred shares with upcoming floating dates and most of my available cash being in tax-advantaged accounts (which are used for trading opportunities), I won’t have as much cash for equity REIT purchases. However, we should still cover the opportunities.
Housing REITs: I may swap my Essex Property Trust (ESS) for one of the other housing REITs. I covered the sector extensively in the housing REIT target updates.
Towers: Sector update for tower REITs coming up soon. As with all sector updates since rates shot higher, adjustments will all be negative to reflect higher interest costs and higher required rates of return. Floating rate was debt was a big issue for growth rates across all 3 tower REITs in 2023. Growth in 2024 should be better. In some cases, like CCI, the growth is better in 2024 (using guidance) but it doesn’t look like it because of the way the REIT presents its AFFO calculations. I’m still not thrilled about CCI’s capital expenditure profile. I contacted CCI after their earnings release, but haven’t heard back.
Industrial: Rexford (REXR) still in first place on my list for the sector.
Other: Same as last month:
“I added to our position in Alexandria (ARE) already this month. Under $100 it’s about a 5.0% dividend yield. Reasonable payout ratio. Management responds to the market by selling properties at cap rates that are dramatically below the cap rate implied by share prices. There is extra lab space in development courtesy of the low rates + high inflation in 2021, but that may dry up. I don’t see demand for lab space plunging. AI may assist in running experiments, but it will still need large amounts of data put into the system. My biggest concern is probably the demise of office real estate and some office-to-lab conversions. Many potential conversions didn’t make sense when a hypothetical office building cost $150 million. Drop that price tag to $50 million and suddenly the conversion is much more attractive.”
Foreshadowing potential BDC trades
I’m not expecting to be active in the BDCs at the moment.
Foreshadowing potential mortgage REIT trades:
Volatility in the sector has been so extreme I don’t think I can reasonably forecast these. We’ve seen 15% moves in a single week. In some cases, we’ve seen moves of about 15% in a single day. The spreadsheets are a great tool here though.
Foreshadowing potential preferred share trades:
I’ll continue watching this space and looking to trade between similar shares based on relative valuation. If I put some new cash to work in November, the preferred shares are a very strong candidate. I already added to CIM-B in early November.
Trade Alerts
Below you’ll see links to our trades from the month (paid membership required):
- 10/23/2023: Trade Alert: PMT-B
- 10/13/2023: Trade Alert: PMT-B
- 10/06/2023: Trade Alert: CIM-D
- 10/04/2023: Trade Alert: ARE
In early November, I purchased additional shares of CIM-B:
- 11/02/2023: Trade Alert: CIM-B
Because those shares were purchased in November, they are not included in the screenshots below.
Returns to Date on Open Positions
We will start with the open positions as of the end of the month. It often takes a few days to prepare this article, but the screenshots below are from the end of the prior month.
The cell with the ticker is grey if the position is in a taxable account. This was a request by a few members and there was no drawback to adding the information. All of those positions are in equity REITs.
Some tickers are highlighted in orange. That’s because I discovered a typo in my sheets during the portfolio review. Any line with a correction has the ticker in orange.
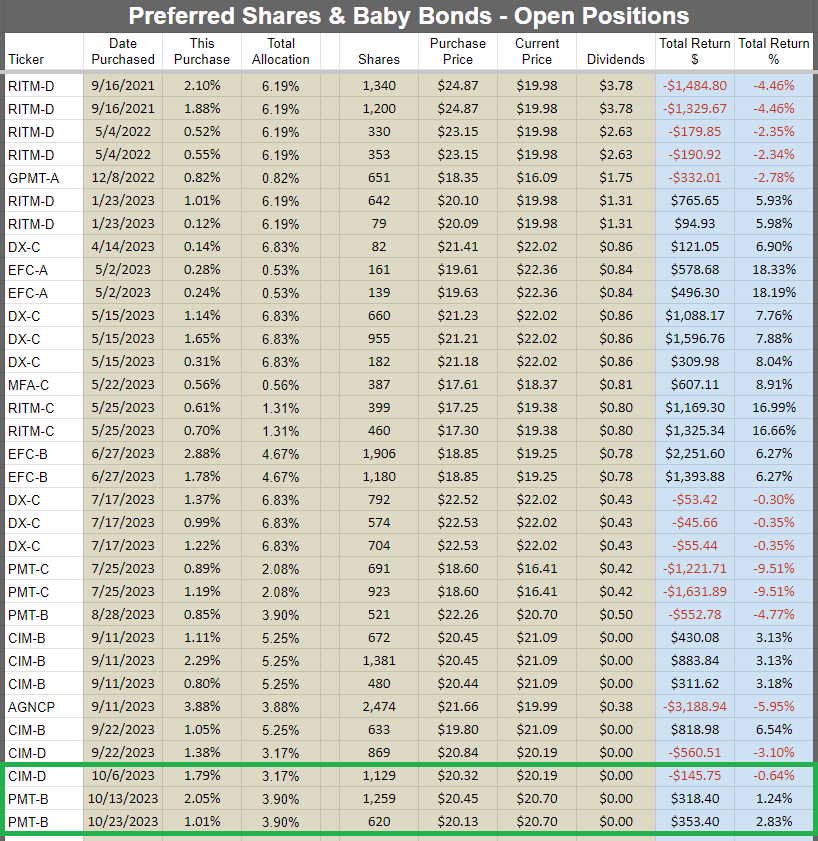
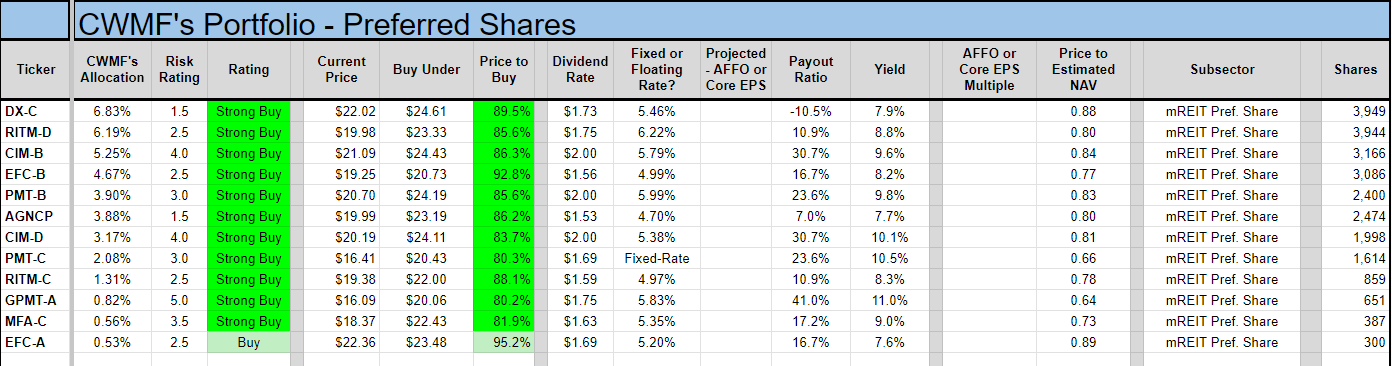
Preferred shares and baby bonds:
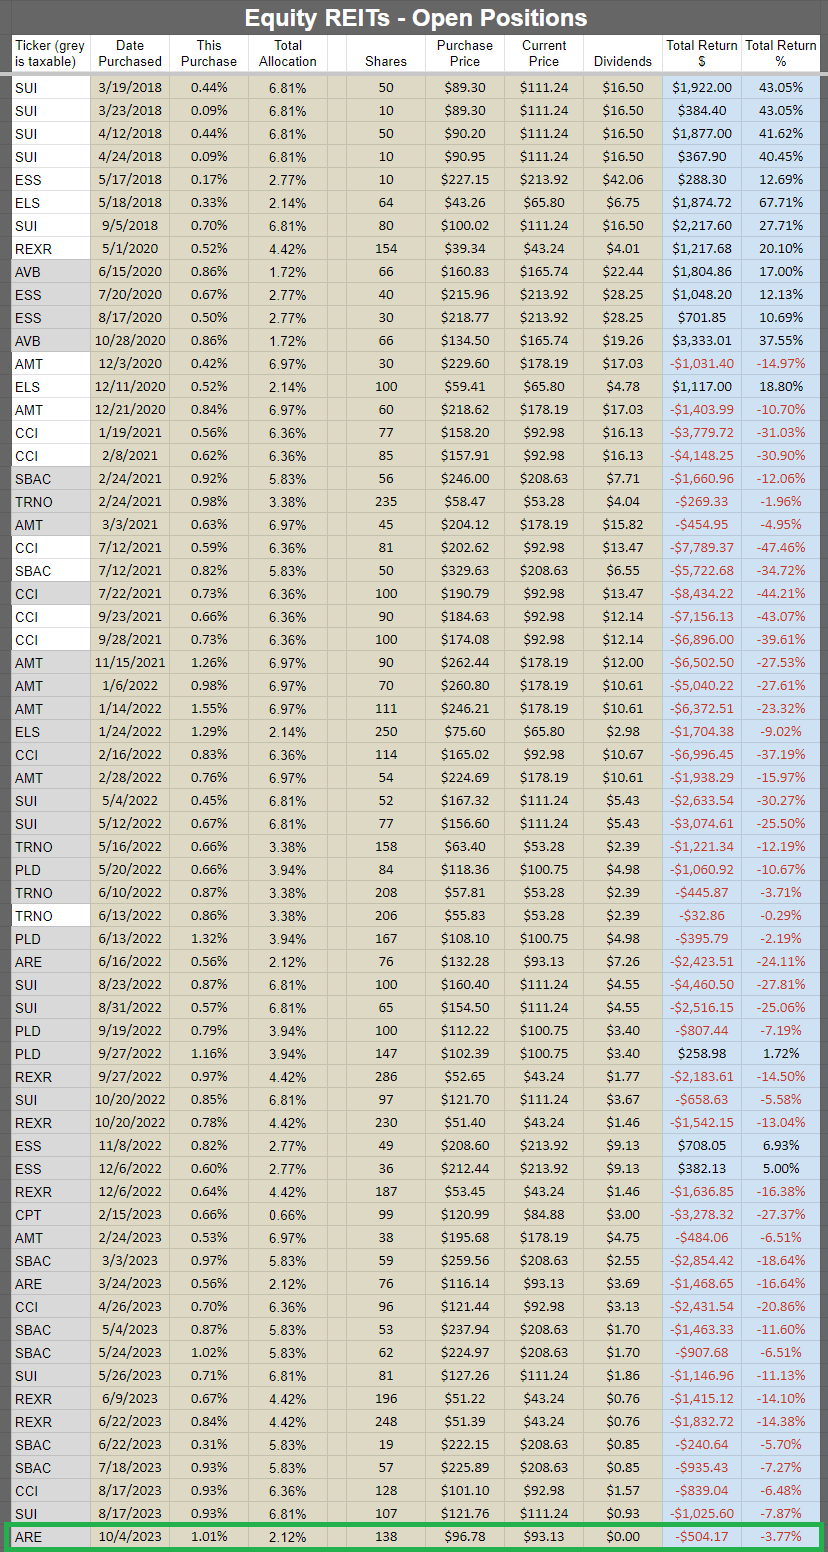
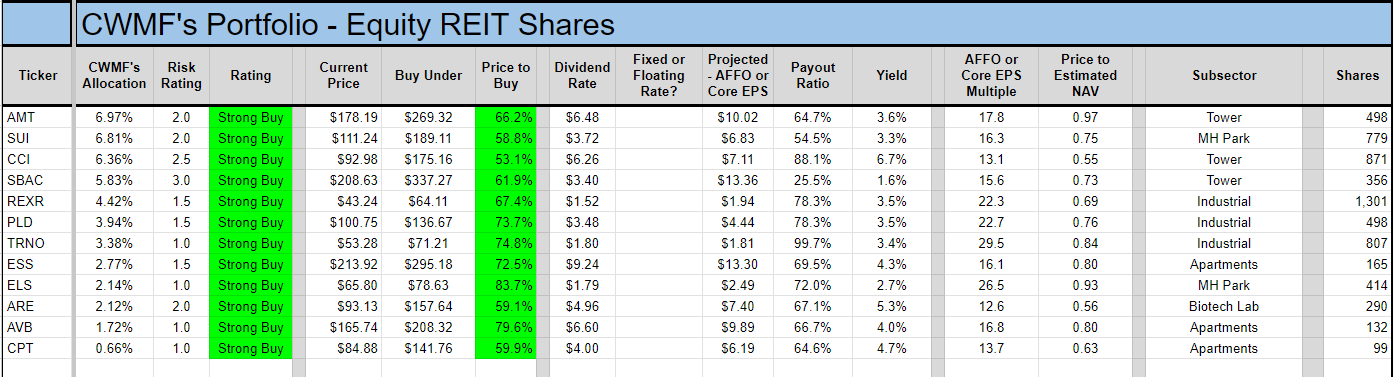
Equity REITs:
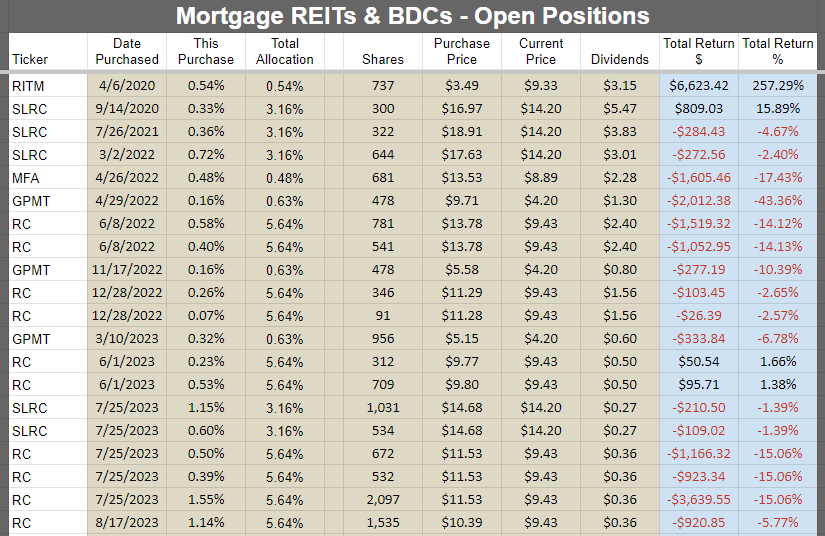
Mortgage REITs and BDCs:
Other:

Returns on Recently Closed Positions
These are the positions closed since the last portfolio update. If you want to see positions that were closed before that, you can see the prior portfolio updates or use the Google Sheets. If we didn’t close any positions for the sector during the month, then the image will be blank. Note: By loading the Google Sheets, you can still see all of our closed positions. To reduce the size of the huge article, we’re only highlighting the recent changes.
Preferred shares and baby bonds:
Equity REITs:
Mortgage REITs and BDCs:
Other:
Total Portfolio Returns
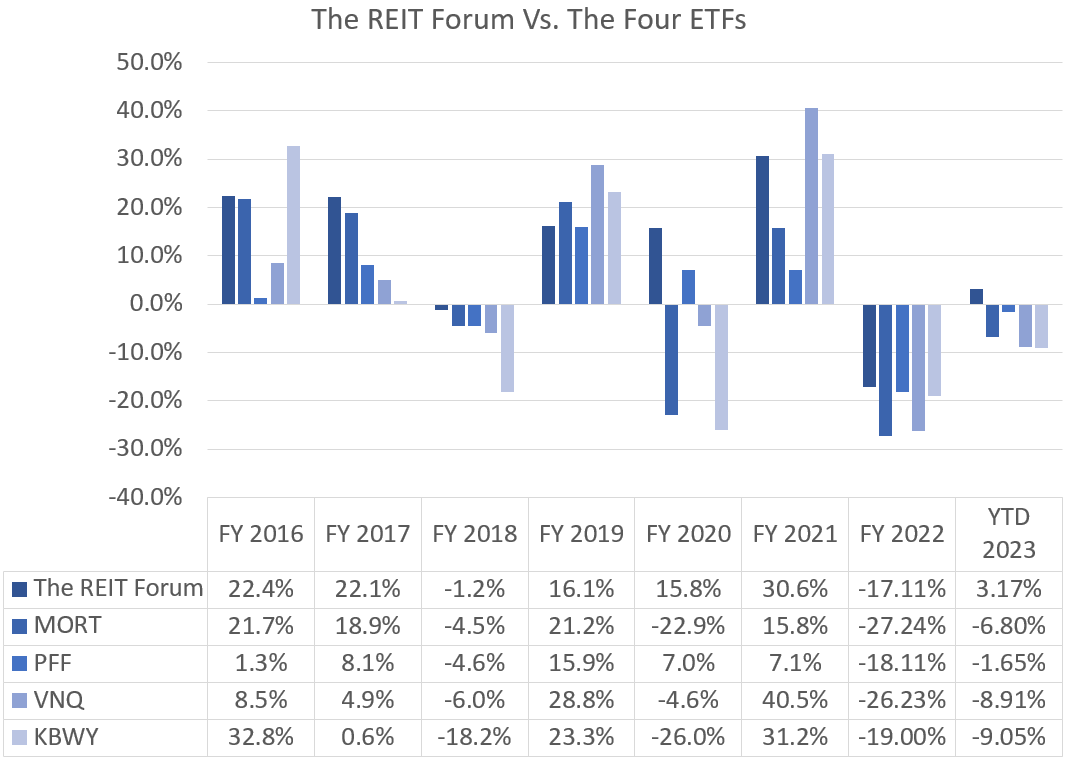
Our performance since we began preparing for The REIT Forum at the start of 2016 is shown below and runs through the end of the latest month:
Here are our results through 10/31/2023:
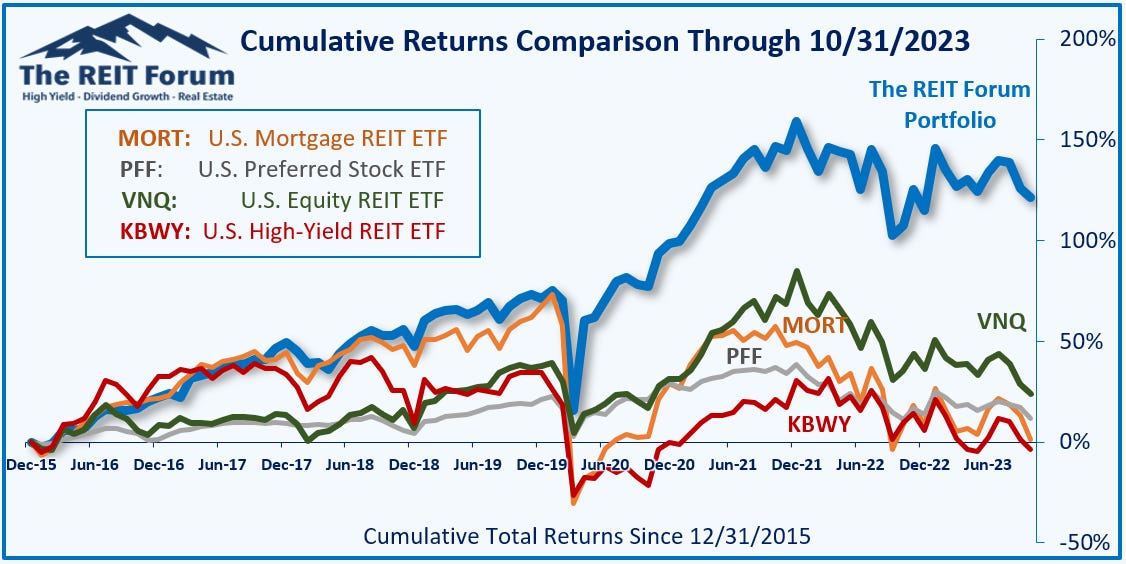
We thoroughly beat the four major indexes covering our types of assets:
- MORT - Major mortgage REIT ETF
- PFF - The largest preferred share ETF
- VNQ - The largest equity REIT ETF
- KBWY - The high-yield equity REIT ETF most retail investors follow
Annual comparison vs. each ETF:
October was a monster month. Alpha ripped higher. Alpha year-to-date was 5.92% at the end of September. In October, it increased to about 9.8%.
Returns fell in October, but we didn’t get hit nearly as hard as the indexes. The gap between 3.2% and negative 6.6% is huge. While we’ve had most of our portfolio invested (small cash balance), our picks have generally been more defensive. With the rally in early November, part of our outperformance from October is offset.
The next chart shows the change in the value of our portfolio from month to month. We strip out the impact from contributions made during the month because, obviously, contributions are not returns.
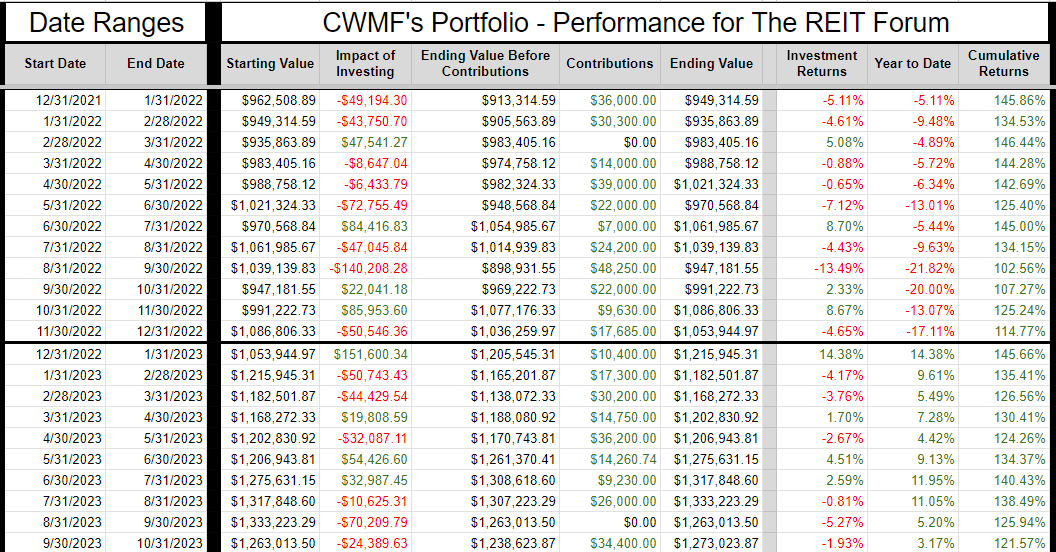
The prior year is included as well to help investors see how the calculations work. You can always access this tab, with our entire record, in the REIT Forum Google Sheets (premium membership required). The tab is called “Returns Chart”. It is the tab all the way to the right.
CWMF’s Portfolio Images
These images use the data from the end of the month. That includes the prior price and prior targets!
Preferred shares and baby bonds:
Equity REITs:
Mortgage REITs and BDCs:
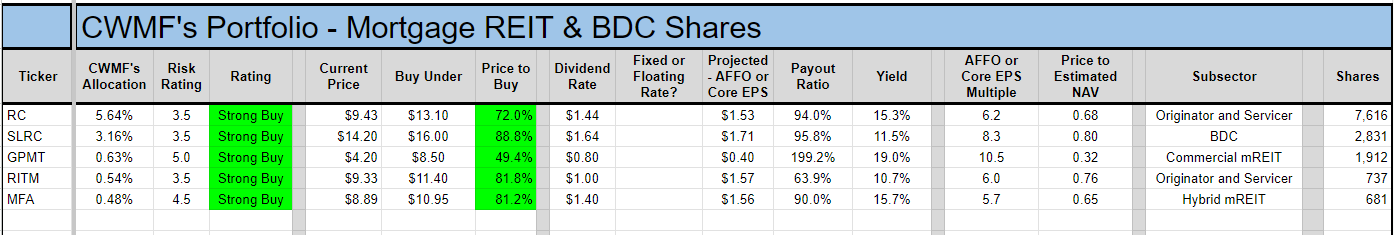
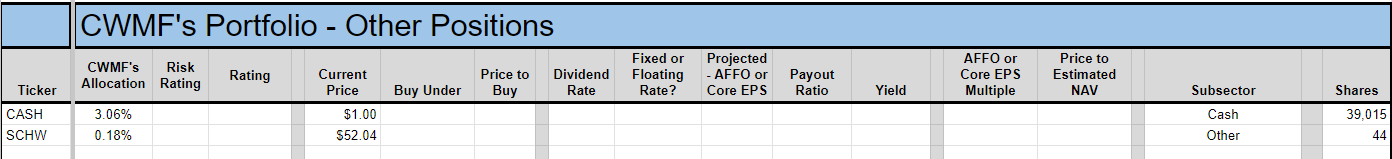
Other:
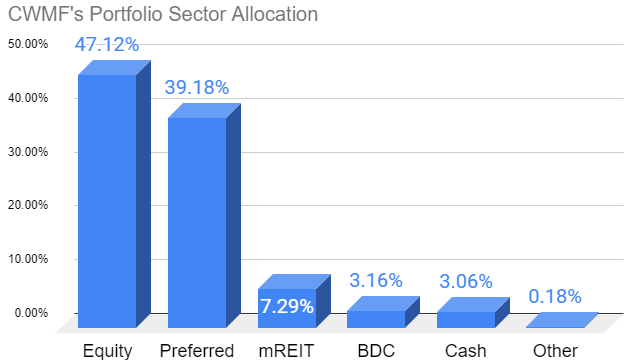
Sector Allocation Chart
The sector allocation chart helps to explain how we are thinking about risk and seeking returns:
Conclusion
Frequent cash inflows to the preferred shares and declining prices for equity REITs have driven the preferred share weight quite a bit higher. I’m okay with that because of the return profile created by fixed-to-floating shares.
Macro risks remain, as they did before, but the annualized yield to call is very high. Even if we assume shares would only climb to $23.00 or so, the annualized return would still be very attractive for some shares.
We saw rates dip moderately across the last days of October into early November. REITs ripped higher. It appears many investors who have been scared to buy into REITs while rates are rising are still interested in the asset class the moment rates begin to dip. Investors should remember just how quickly that rally started. There isn’t a significant gap between rates falling and REITs rising.
Reminder About Cash (Repeated)
Finally, I would remind investors to make use of short-term Treasury ETFs. These are a perfectly suitable replacement for cash if you expect to know you’ll need it a few days in advance. I would normally keep at least 6 months (often more) of living expenses in cash. If you normally keep around $40k to $50k, the difference between getting paid 5% and 0.2% is around $2k per year. I’m using (SGOV) and (SHV) as my cash substitutes. Another good option is (BIL). When cash is needed, I’ll transfer it from the brokerage account over to regular checking.
Note: I use a separate account for holding this cash. It doesn’t get factored into my portfolio. It is functionally a checking account, but it is technically a brokerage account capable of owning shares. There are some alternatives for money market funds as well. Just beware of leaving significant amounts of cash in a near-0 yield checking account.
Strategy (Repeated)
For new subscribers, we should emphasize that we often treat our positions differently. We have those we consider as being primarily “Trading” positions and those where we prefer to “Buy and Hold”. A simple way to remember it is that anything with a high risk rating is probably going to be a trading position. Most of those high-risk positions are mortgage REITs and BDCs. These are two very challenging sectors where most investors (and “analysts”) simply don’t get it. Analysts who can’t predict the changes in book value for mortgage REITs or NAV for BDCs aren’t in a position to trade them. Analysts who don’t know how to evaluate the probability for dividend cuts (or raises) are in a weaker position for trading them. We have access to a great analyst (Scott Kennedy) who delivers exceptional estimates and price targets. If we only bought and never sold, we couldn’t reallocate to take advantage of the next disparity in valuations.
When we switch over to equity REITs, we usually have a long time horizon for investments. We’re thinking more about growth in AFFO per share and the long-run outlook for the sector. Consequently, we will pick REITs with lower risk ratings. The risk rating on an equity REIT correlates heavily with how much debt the REIT is using. That isn’t the only factor, but the correlation is strong. When debt levels are high, that alone can be a sufficient reason to assign a higher risk rating. Consequently, you’ll see us trading equity REIT positions far less actively. We will mostly wait for opportunities to buy a great REIT at an attractive price. We simply don’t want the mediocre equity REIT, not even at a low price. It doesn’t fit our strategy.
Preferred shares can be used in either way. However, you’ll often see our positions listing a “short” holding period. That’s because we frequently swap between different preferred shares that are at least roughly similar. For instance, we might sell NLY-F to buy NLY-I, then sell NLY-I to buy AGNCO, then sell AGNCO to buy NLY-F again. Why would we do that? They each have a risk rating of 1, trade at roughly similar prices, and will carry similar spreads when they begin floating. So what are we doing? We’re taking advantage of a change in the relative prices. By the time we’re back to the initial share, we are able to have more of them. If each time we traded between those shares we ended up with a 1% increase in the share count, we could end up with 3% more shares of NLY-F at the end of that trade than at the start. That leads to faster growth in the total portfolio. It appears that we’re selling the preferred shares quite often, but frequently it is just a change between two similar shares. We do this when we’ve found the spread in prices is large enough to let us exit one position and enter the next.
This may be different from the methods you’ve seen employed by other analysts. You may have joined us because you became tired of mediocre results. Our better results have been a function of our unique strategy.
Thank you for reading!
Member discussion