
Portfolio Update - March: Finding Yield with Defensive Focus
- We saw a slight bounce in February and our alpha year-to-date was at 3.2% for the end of February (up from 2.4% in January).
- I’m still defensively positioned, though we did use part of our cash position in February and more in early March.
- Added MFAN and PMTU to coverage in February. We purchased shares of MFAN in March.
- Price target updates for many equity REITs are coming up over the next few weeks.
- We’ll cover which subsector and which specific shares are catching our interest in the section for paid members.
Article Starts
You can find prior installments of the Portfolio Updates on the Portfolio tab of our website:
This kind of filtering system doesn’t exist on Seeking Alpha, so it is only available through our website (which currently runs on Substack).
Older editions of the Portfolio Update are unlocked for everyone. The newest release reserves the foreshadowing section for paid members.
Trade Alerts
We have a page on Substack to link all trade alert articles.
Here are The REIT Forum’s trade alerts.
Layout - Modified Order
To keep things simple for our investors, the portfolio update is divided into several segments. We run the same segments (with new content) each week.
We usually maintain the same order from month to month, but I revised the order to work better with free previews. Eventually, the order will be locked in again.
- Returns on Total Portfolio
- Sector Allocation
- Reminder About Cash
- Housekeeping
- Recently Closed Positions with Returns
- Recently Opened Positions with Returns
- All Open Positions by Sector with Returns
- Outlook
- Foreshadowing Potential Trades (paid section)
This layout maximizes transparency while keeping the foreshadowing of our potential trades within the paid section. It also loads the images together at the front, while putting the text-heavy sections together at the end.
Returns on Total Portfolio
Note: The presentation of the charts was modified slightly to enable running it through Google Sheets instead of Excel to reduce transferring data.
The chart below shows our performance since we began preparing for The REIT Forum at the start of 2016 through the end of the latest month:
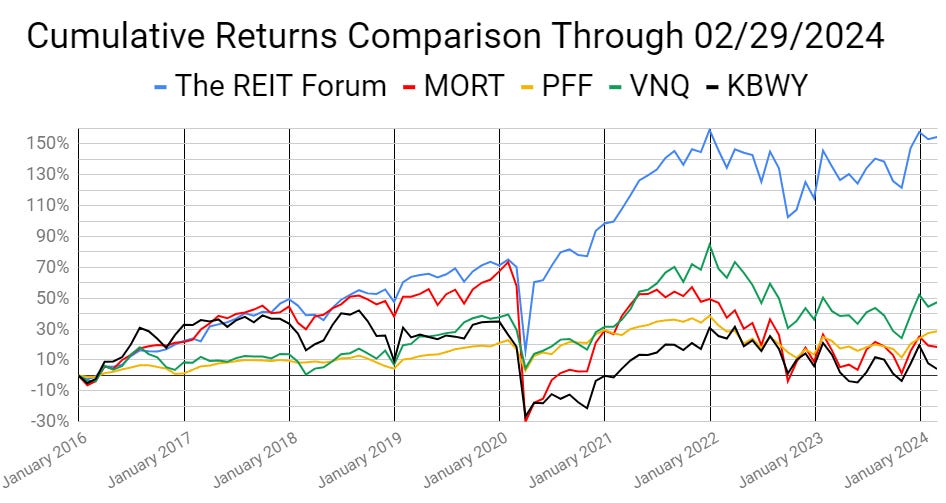
There are four major index ETFs we use for evaluating performance. They are:
- (MORT) $MORT - Major mortgage REIT ETF
- (PFF) $PFF - The largest preferred share ETF
- (VNQ) $VNQ - The largest equity REIT ETF
- (KBWY) $KBWY - The high-yield equity REIT ETF most retail investors follow
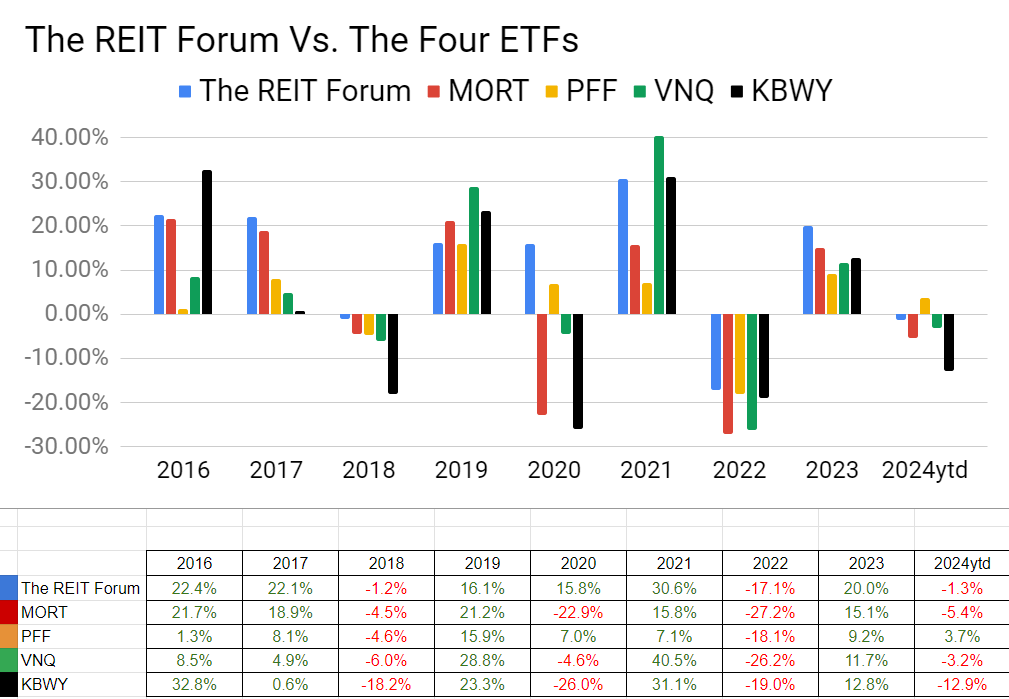
Annual comparison vs. each ETF:
Our performance vs. the average of the ETFs:
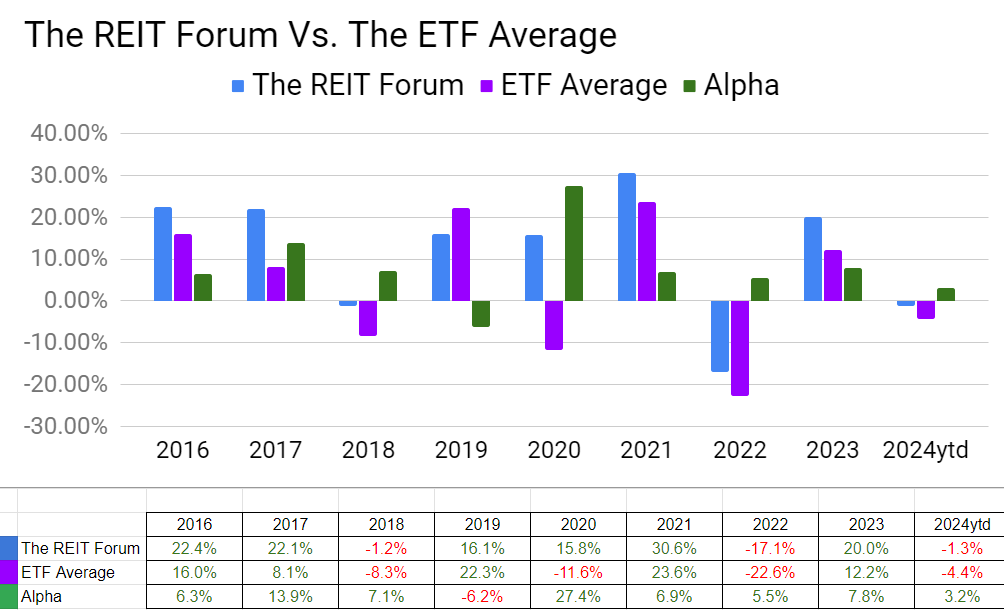
We evaluate alpha based on performance against the ETFs because it strips out the general change in our sectors.
The next chart shows the change in the value of our portfolio from month to month. We strip out the impact from contributions made during the month because, obviously, contributions are not returns.
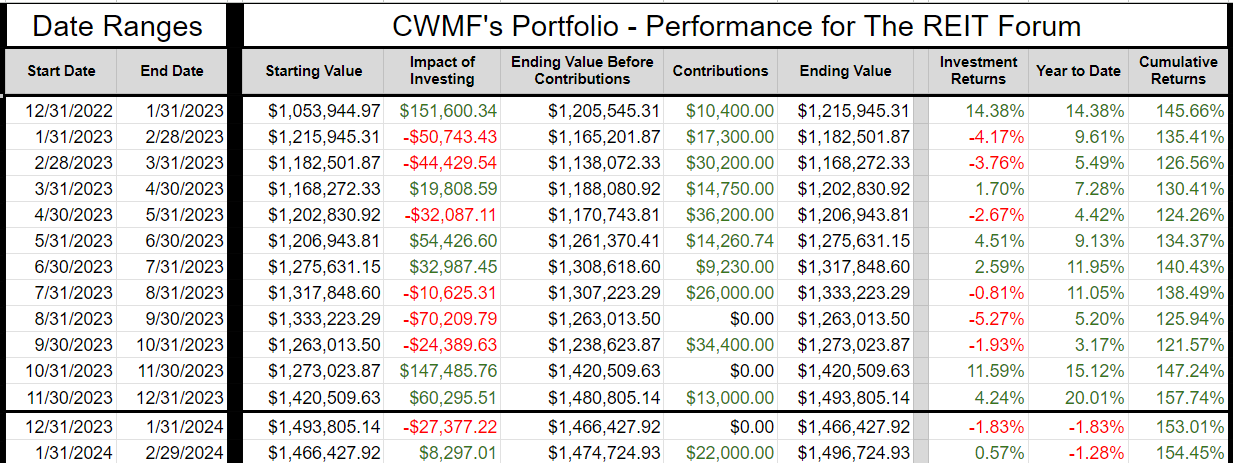
The prior year is included as well to help investors see how the calculations work.
If anyone is confused by these calculations, let me know. I believe this transparency is crucial, so I’ll include an example showing every calculation if I hear that readers have any difficulty following it.
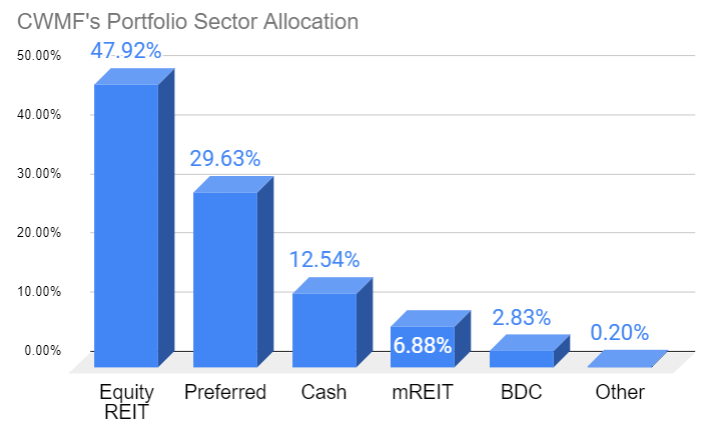
Sector Allocation Chart
The sector allocation chart helps to explain how we are thinking about risk and seeking returns:
Reminder About Cash (repeated)
I normally keep at least 6 months or more of living expenses in “cash”. If you normally keep around $40k to $50k in “cash”, the difference between getting paid 5% and 0.2% is around $2k per year.
I’m using (SGOV), (SHV), and (BIL) as my cash substitutes. These are short-term Treasury ETFs. Prices are extremely stable. Liquidity is excellent.
I use a Schwab business account that is not part of my portfolio. The only assets it holds are actual cash and cash substitutes (those 3 ETFs).
Nearly all my expenses go through my credit card already (paid off in full each month).
I still have my checking through USAA because of the long history on those credit cards. If I need cash, I can sell Treasury ETFs and transfer the funds to my USAA account.
It takes a few days, but that’s fine.
This is a pretty nice return for cash I was going to have there anyway.
Note: Some people think you don’t need a strong credit score after getting a mortgage. I disagree. The long history on those cards is extremely useful if I want to boost someone’s credit score. If I add someone to my card, their next update will show they have a card with 20 years of perfect history.
You can get scammed this way. You are liable for the bill. They can just charge the card and walk away. This doesn’t concern me because I keep a lower limit (such as $10k) on those cards and I’m only doing it for people I trust. If one of those people betrays me, I’ll count myself lucky that I found out for only $10k. For people who can’t afford to risk that money, this would be too dangerous.
Housekeeping
We used to have a repeated section on strategy, but I wanted to shorten the update.
I’ll be posting an article that covers our strategy in greater depth and just adding a link to that post.
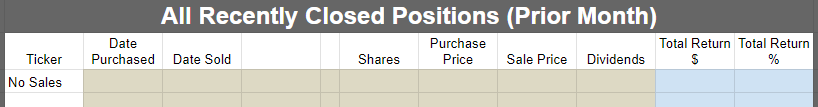
Recently Closed Positions with Returns
These are the positions closed during the prior calendar month. If you want to see positions that were closed before that, you can see the prior portfolio updates or use the Google Sheets.
If we didn’t close any positions for the sector during the month, then the image will be blank.
Note: By loading the Google Sheets, you can still see all of our closed positions. We only include the recently closed positions to reduce the size of the article:
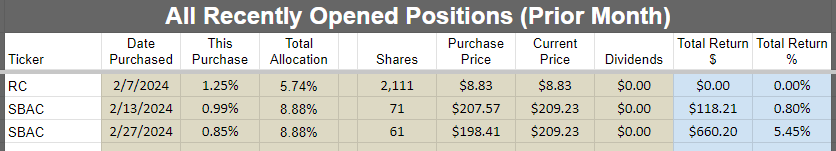
Recently Opened Positions with Returns
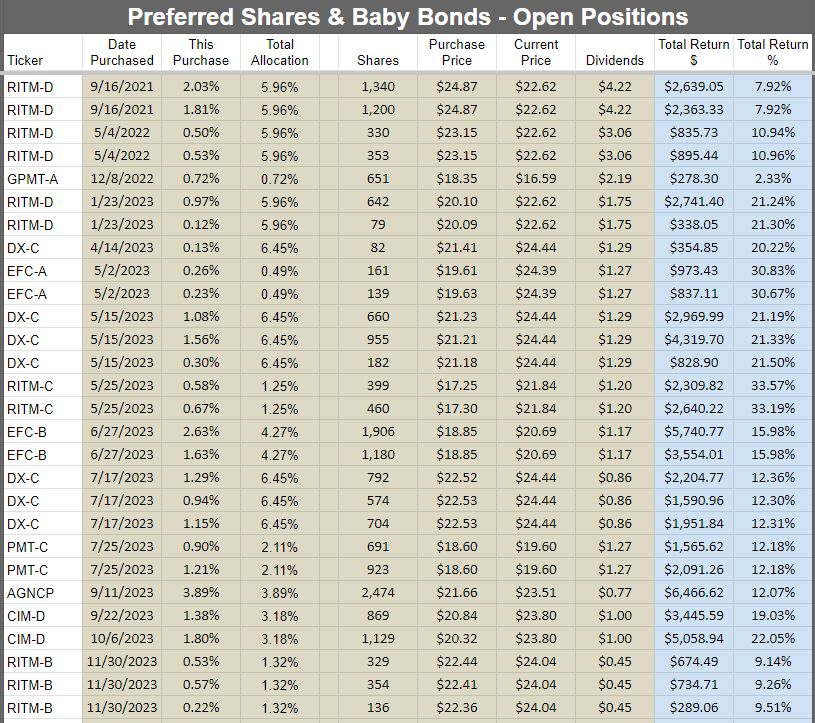
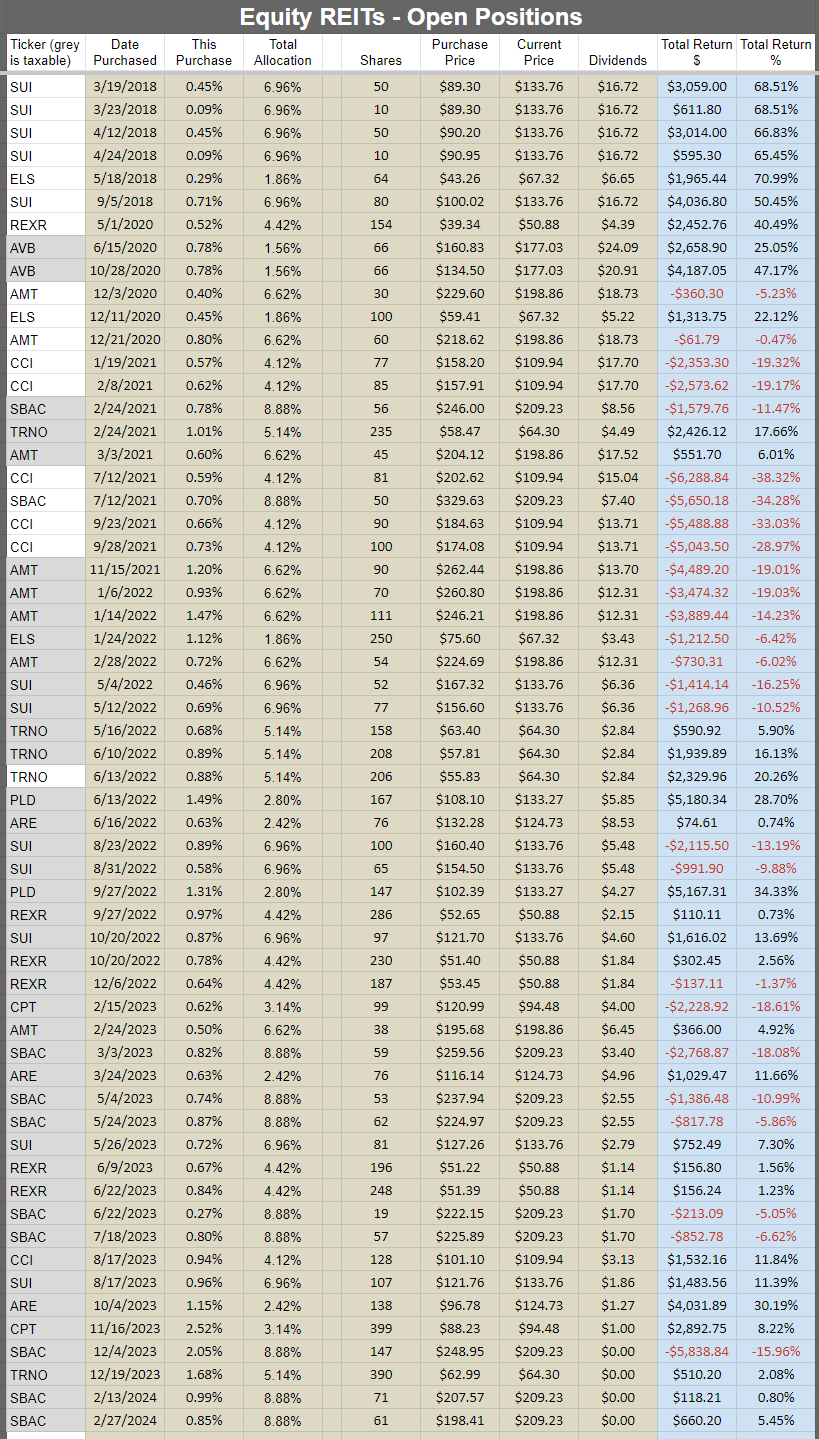
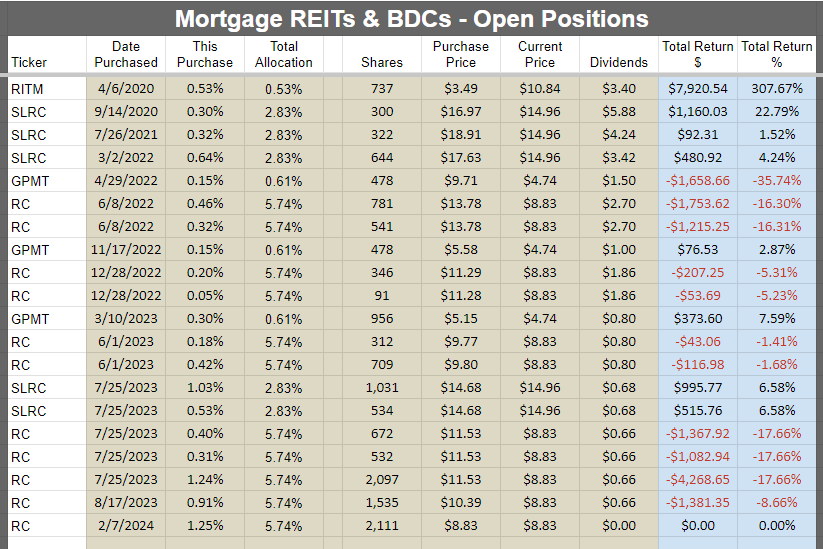
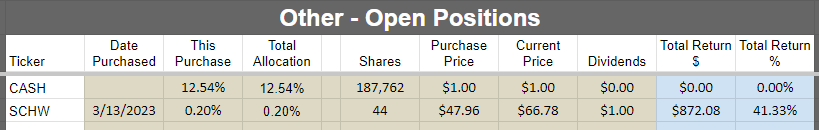
All Open Positions by Sector with Returns
We will start with the open positions as of the end of the month. It often takes a few days to prepare this article, but the screenshots below are from the end of the prior month.
The cell with the ticker is grey if the position is in a taxable account. This was a request by a few members and there was no drawback to adding the information. All of those positions are in equity REITs.
Preferred shares and baby bonds:
Equity REITs:
Mortgage REITs and BDCs:
Other:
Outlook
Like a month ago, I remain pretty cautious. We added to positions in Ready Capital (RC) and SBA Communications (SBAC) .
In March, I also picked up some shares of MFAN (MFAN) . The baby bond is a fairly defensive way to get some extra yield. It’s got more risk than cash, but overall the risk level is pretty low compared to common or preferred shares. That works well for me since I want to have a fairly defensive tilt to the portfolio.
I’m still more interested in playing with the preferred shares than the common shares. So if I do more buying than selling, then I’ll probably be focused on the preferred shares.
Foreshadowing Potential Trades
This image will get more epic each month. This is level 4:

Note on target updates:
- As we go through earnings season, there will be additional target updates. The swings in interest rates can also result in some adjustments.
- Preferred share target updates were completed in December. That is in addition to the ex-dividend adjustments, which are automatic for preferred shares. Additional updates will be coming, but most will probably have to wait until after earnings season concludes.
This section is usually prepared shortly before publishing. The goal is to quickly cover ideas for trades. We aim to foreshadow our trades here, though the market may move in surprising ways. While the article takes days to prepare and documents prices and performance from the end of the month, the potential trades section is written last to provide the most up-to-date pricing.
Based on the change in relative prices as of Sunday, 03/11/2024, here are some of the trades on my radar.
Foreshadowing potential equity REIT trades
Industrial:
Not expecting any near-term change to my positions.
Housing:
I’ll consider getting into Mid-America Apartment Communities (MAA) $MAA. Probably a good long-term play. However, I expect growth to be challenged through at least 2025. That puts the catalyst a bit further off. If I buy in, it would probably be on a dip. I’m not in a rush and I’m willing to live with the risk of “missing out”.
Towers: Our position in the tower REITs is pretty big. I don’t expect to increase it, but it would take higher prices for me to shrink the allocation.
Other: Alexandria (ARE) $ARE seems to go up and down from one update to the next. Given my general risk aversion, I’m still in the scenario where I’m only buying when I think the market is getting into a panic. We started the position at $132.28 (which has been offset by some dividends) for 76 shares, doubled it with another 76 shares at $116.14, and added another 138 shares at $96.78 (nearly doubling the existing allocation again).
Foreshadowing potential BDC trades
Might follow Scott if he adds to a position. If SLR Investment Corp. (SLRC) $SLRC rallies up into the neutral range, I might look at reducing it. However, it’s my only BDC exposure.
Foreshadowing potential mortgage REIT trades:
Always a chance of making trades in the mortgage REIT space. As before, Ready Capital (RC) $RC remains on the list. There are a handful of other shares that have dipped into the bullish ranges also though. I’m still generally inclined to focus more on the preferred shares than the common shares.
Foreshadowing potential preferred share or baby bond trades:
This is the most interesting space for me right now.
We’re not getting big discounts to targets anymore, but many floating dates are quickly approaching. Things can get really interesting here because we can see those big floating yields on the horizon. In many cases, I expect shares will probably trade above $25.00 per share after the first floating-rate dividend is announced (triggering much higher yields to show up). That generally comes around 2-months (give or take a few weeks) after the floating-rate period begins. Some shares might be called, but it’s still hard to get financing locked in. I think calls will be quite rare or extremely rare. Many of these REITs didn’t bother running repurchase authorizations when shares were trading at substantial discounts to call value. Sure, the dividends were still fixed at that point, but it would’ve been much cheaper to run aggressive buybacks at that point.
EFC-A:
Previously, I wrote about how I was interested in closing out my position in EFC-A at $24.38. Then shares quickly dipped. Now they sit at $23.75. The yield to call is materially different at $23.75 today compared to $24.38 (that was 10 days ago). Shares did not go ex-dividend during that time. If we assume that shares will be worth about $25.00 when the first floating period starts on 10/30/2024, then the upside in the price went from $.62 to $1.25. An extra $.63 in potential appreciation for about 7 to 8 months is a solid increase. That’s more than an extra 2.5%. It adds a little over 4% to the annualized rate of return. I still think taking gains at $24.38 would be fine, but I’d be more likely to buy shares around $23.75 than to sell them. For comparison, EFC-E trades at $25.48 today and shares have about $.48 of dividend accrual. Consequently, EFC-E’s stripped price is right about $25.00. EFC-E does have a bigger floating spread, but we’re probably seeing the call value serve as a soft ceiling on EFC-E’s price.
PMT-A or PMT-B:
I might play with PMT-A or PMT-B because the shares should switch to floating. I’ll encourage readers to report PMT to the regulators for their “interpretation” of the LIBOR Act. However, we can’t know when or if regulators will take action. For quite a few investors, these may not fit the risk tolerance when there are so many options where the REIT’s management has confirmed that shares will float per the LIBOR Act.
RITM-D:
RITM-D will be on my radar. Shares are currently $22.50. RITM-D rallied significantly, but they rallied less than many other preferred shares. Consequently, I could swap other shares into RITM-D. However, investors should be aware that RITM-D is a “fixed-to-reset” share. So the rate will only reset every 5 years. It uses the 5-year Treasury rate plus a spread of 6.223%. This is a bit of a strange scenario for the risk/reward profile. If rates rise rapidly after shares reset, investors are waiting for years before the rate resets again. If rates fall dramatically, RITM would probably call the shares. However, the spread of 6.223% is pretty good. Consequently, I would expect shares to usually trade around $25.00 when they are near the reset date unless we are in the middle of a large recession (when the 6.223% credit spread isn’t as impressive).
DX-C:
I’ll also be checking on DX-C. Shares are at $24.25 right now, but they’ve dipped below $24.00 within the last 2 days. Those shares begin floating on 4/15/2025, so it’s about 13 months out. The dividend rate until then is a bit low (leading to a 7.22% stripped yield), but the annualized yield to call is about 11.3%. That’s pretty good for the risk level and I think those shares will probably trade a bit over $25.00 when they are floating. I think they probably have the highest call risk because the 5.461% spread looks pretty good for a 1.5 risk rating.
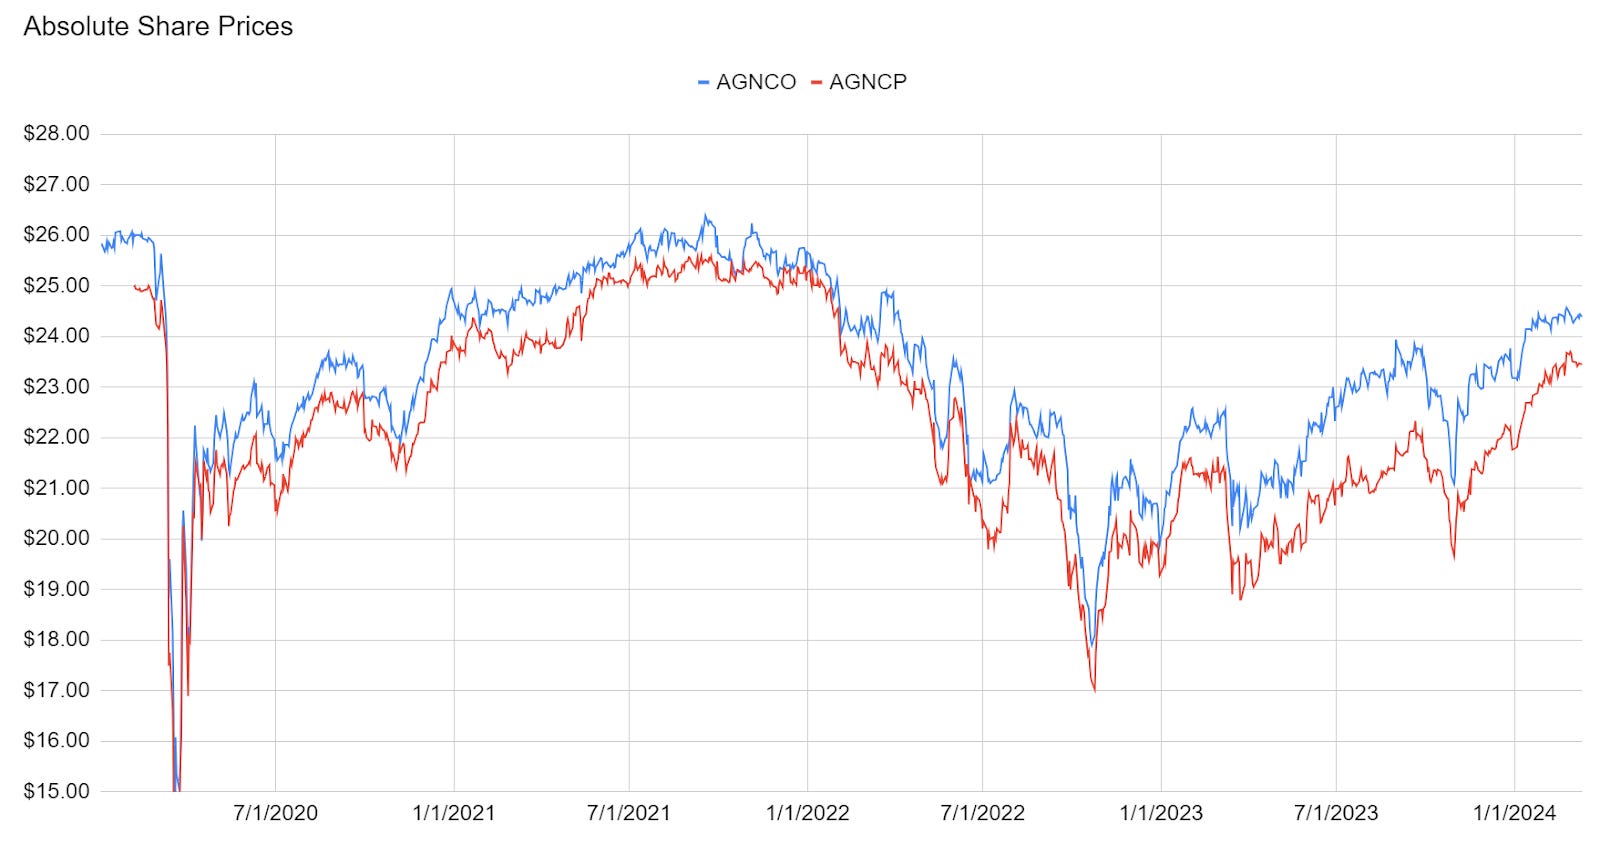
AGCNO vs AGNCP:
The other potential trade that stays on my radar is between AGNCP and AGNCO. We’re long AGNCP, but I’d consider swapping into AGNCO if we can get the right spread. Currently AGNCO is $24.38 and AGNCP is $23.47. That’s a spread of $.91. Since AGNCO floats 6 months earlier, the investor recovers a pretty good portion of that spread. That gives AGNCO an earlier catalyst, which is nice.
On the other hand, what if we were predicting returns from today until days after AGNCP’s first floating-rate ex-dividend date (late June 2025, because the share begins floating in April 2025)? Then I think AGNCP would have a modest edge using today’s starting prices.
This is a particularly strange situation. Most of the time the market is materially overvaluing shares that float sooner. In this one case, AGNCO vs AGNCP, it is only slightly overvaluing AGNCO (based on future projected cash flows). Going from AGNCP to AGNCO (with a $.91 spread) should be a losing trade if someone was planning to hold for 17 months and then dump the shares. But if that spread tightens (smaller price gap), that could encourage me to pull the trigger. If I did that, I’d be watching for opportunities to swap back. Why bother with all of that? Because if we do it right we can walk away with 1% to 1.5% more shares of AGNCP than we had when we started.
Is that worth it? It depends on the individual investor. I have 2,474 shares. That’s worth about $58 grand. Getting an extra 1% increase would be worth about $580. It’s not life-changing, but it beats a poke in the eye.
One simple way to look at the valuation of the share is just to look at the share prices over time. This ignores the ex-dividend date, but they go ex-dividend on the same date and the amount is similar enough in this case.
As you can see, AGNCO’s share price is almost always higher than AGNCP’s share price:
That’s nice, but you have to look at the gap to estimate when the gap is bigger or smaller than normal.
We can simplify it by doing a chart that uses AGNCO’s share price and subtracting AGNCP’s share price.
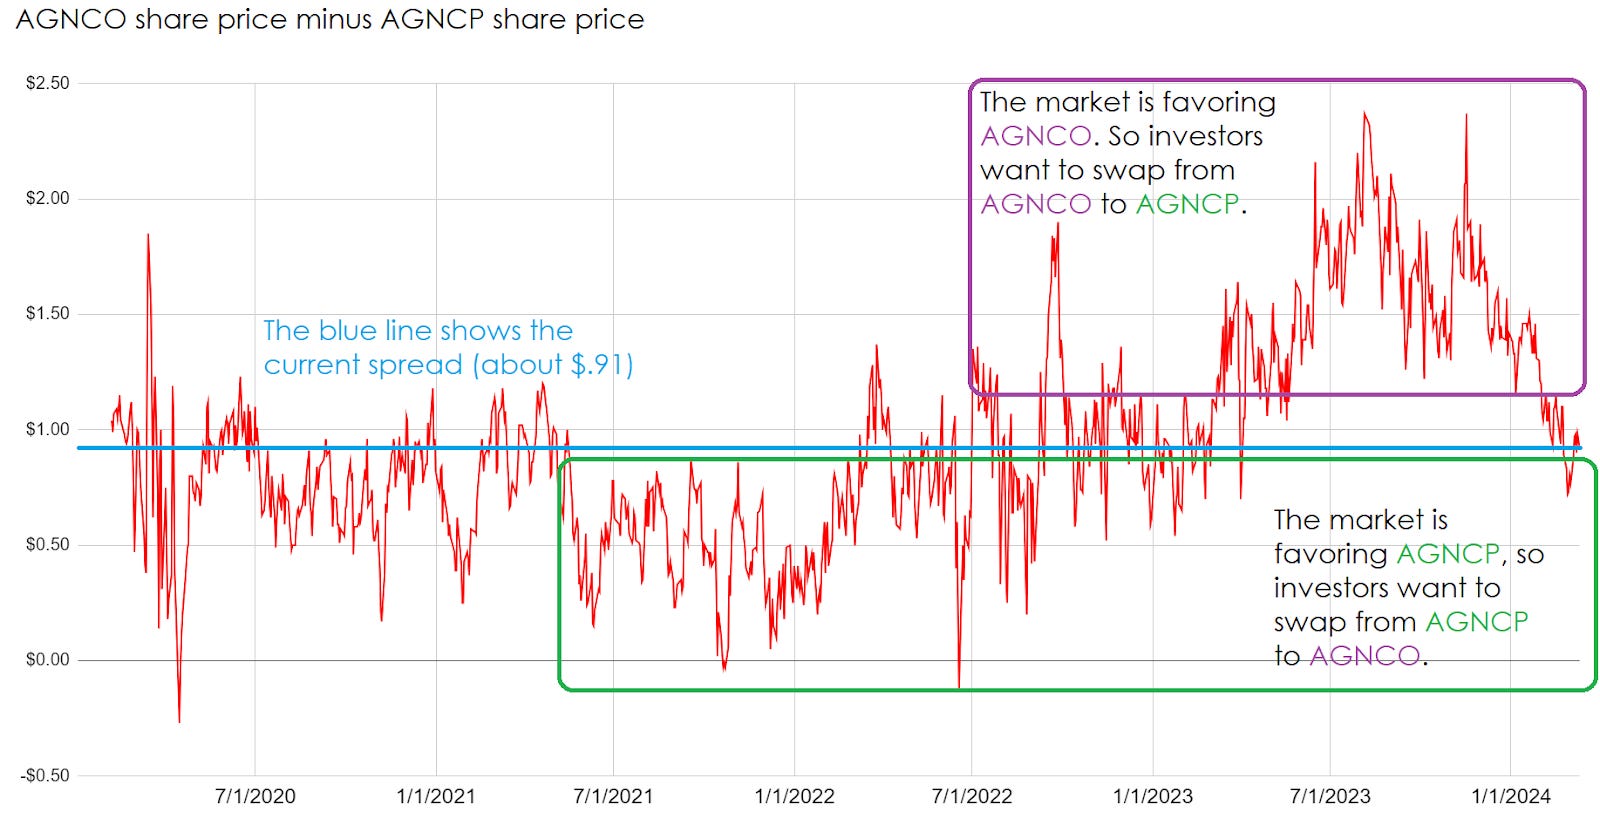
That makes it pretty simple. When the line gets low on this chart, investors want to move from AGNCP to AGNCO. If you can upgrade for $.60, that would be a great deal.
When the line gets high, investors want to move from AGNCO to AGNCP. If someone will give you $1.40 to drop from AGNCO to AGNCP, that’s another great deal.
That’s about as easy as it can get. Can you tell when the line is high or low? Congratulations, you can use this technique!
Note: Box locations are approximate.
This is one of the techniques I really like using to double-check ideas about swapping between shares. It helps me to quickly evaluate whether the current spread is unusual or not.
There is one important disclosure though. Once AGNCO starts floating (which should mean a much bigger dividend), the gap should fall with each ex-dividend date.
Much of the difference in value for the shares is simply that AGNCO floats earlier. The other part is that AGNCO has a bigger floating spread.
Conclusion
Thanks for reading. I hope you find the ideas in this article helpful as you navigate the markets.
Member discussion