
Portfolio Update - July: Celebrating The Launch of Our Service
Our premium service started on Seeking Alpha in 2016.
For the first time, readers can pick which platform they want to use to access our research. We will begin adding premium content here soon. That means there will be two types of content:
- Free articles: Full articles. Free. Like the articles you’ve seen so far.
- Premium articles: Preview is free; full article requires premium.
One of the series we provide on our premium service is the monthly portfolio update. I’ll share the entire July update for free so readers know what to expect in an update.
Portfolio Update Begins
To keep things simple for our investors, the portfolio update is divided into several segments:
- Strategy - This explains how we invest. It helps investors understand why we place the trades we do.
- Foreshadowing
- Links to Trades.
- Returns to Date on Open Positions, Recently Closed Positions, and Total Portfolio
- CWMF’s Portfolio Images
- Sector Allocation
Strategy (Repeated)
For new subscribers, we should emphasize that we often treat our positions differently. We have those we consider as being primarily “Trading” positions and those where we prefer to “Buy and Hold”. A simple way to remember it is that anything with a high risk rating is probably going to be a trading position. Most of those high-risk positions are mortgage REITs and BDCs. These are two very challenging sectors where most investors (and “analysts”) simply don’t get it. Analysts who can’t predict the changes in book value for mortgage REITs or NAV for BDCs aren’t in a position to trade them. Analysts who don’t know how to evaluate the probability for dividend cuts (or raises) are in a weaker position for trading them. We have access to a great analyst (Scott Kennedy) who delivers exceptional estimates and price targets. If we only bought and never sold, we couldn’t reallocate to take advantage of the next disparity in valuations.
When we switch over to equity REITs, we usually have a long time horizon for investments. We’re thinking more about growth in AFFO per share and the long-run outlook for the sector. Consequently, we will pick REITs with lower risk ratings. The risk rating on an equity REIT correlates heavily with how much debt the REIT is using. That isn’t the only factor, but the correlation is strong. When debt levels are high, that alone can be a sufficient reason to assign a higher risk rating. Consequently, you’ll see us trading equity REIT positions far less actively. We will mostly wait for opportunities to buy a great REIT at an attractive price. We simply don’t want the mediocre equity REIT, not even at a low price. It doesn’t fit our strategy.
Preferred shares can be used in either way. However, you’ll often see our positions listing a “short” holding period. That’s because we frequently swap between different preferred shares that are at least roughly similar. For instance, we might sell NLY-F to buy NLY-I, then sell NLY-I to buy AGNCO, then sell AGNCO to buy NLY-F again. Why would we do that? They each have a risk rating of 1, trade at roughly similar prices, and will carry similar spreads when they begin floating. So what are we doing? We’re taking advantage of a change in the relative prices. By the time we’re back to the initial share, we are able to have more of them. If each time we traded between those shares we ended up with a 1% increase in the share count, we could end up with 3% more shares of NLY-F at the end of that trade than at the start. That leads to faster growth in the total portfolio. It appears that we’re selling the preferred shares quite often, but frequently it is just a change between two similar shares. We do this when we’ve found the spread in prices is large enough to let us exit one position and enter the next.
This may be different from the methods you’ve seen employed by other analysts. You may have joined us because you became tired of mediocre results. Our better results have been a function of our unique strategy.
Modified Layout
We updated our layout in November 2022. Following positive feedback, we’re sticking with the modified layout. This layout creates more flexibility to highlight the most interesting topics (in my view) and lets us spend our time on identifying the most actionable opportunities while foreshadowing our expected trades.
Trading Ideas (New Sections Begin)

This section is usually prepared shortly before publishing. The goal is to quickly cover ideas for trades. We aim to foreshadow our trades here, though the market may move in surprising ways. While the article takes days to prepare and documents prices and performance from the end of the month, the potential trades section is written last to provide the most up-to-date pricing.
Based on the change in relative prices as of 07/06/2023, here are some of the trades on my radar.
Foreshadowing potential equity REIT trades:
Housing REITs: Sun Communities (SUI) and Camden Property Trust (CPT). Both great deal and both have seen relative weakness recently (underperforming peers on share price + dividend paid). I’m going to toss Mid-America Apartment Communities (MAA) into the section also. Relative weakness and MAA has rarely entered the strong buy range. That combination catches my attention. The threat to MAA is that their markets don’t have the same barriers to construction as most of the biggest markets. We saw that coming as a risk years ago, but expected it to hit prices and rent growth sooner. I’ll be working on an update for the housing sector. This is just a quick list.
Towers: Tower REITs are still cheap. We’ve built our allocation past 20% between 3 tower REITs. Comfortable with that overweight allocation. Always a chance of adding a bit more. Still expecting strong growth for AFFO per share for many years. Pressure on short-term interest rates may maintain headwinds for American Tower (AMT) and Crown Castle International (CCI). It’s not a risk to SBA Communications (SBAC) since floating-rate debt should be near $0 at the start of 2024. The important thing for long-term growth is the ability to grow sustainable revenue per share while maintaining (or even slightly improving) margins.
Note: We don’t accept growth in revenue per share driven by ramping up leverage.
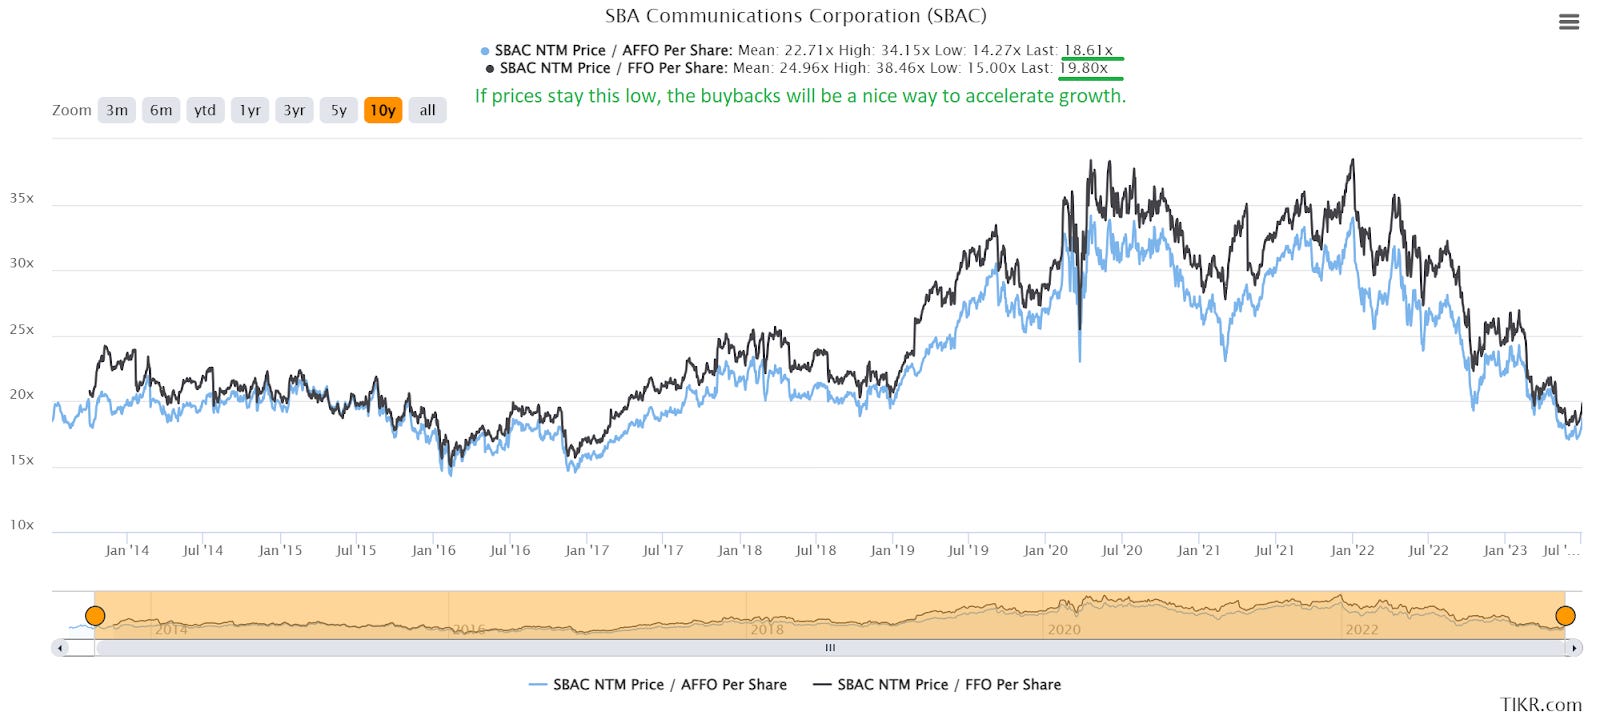
Year-to-date SBAC has significantly underperformed VNQ (largest REIT index). That is particularly strange since the REIT delivered outstanding performance on the fundamentals. Further, there are very few REITs that will have less floating rate debt per share than SBAC. We can attribute it to the weakness of carriers or to investors ditching the low-yielding REIT in favor of bigger Treasury yields. When floating-rate debts are eliminated, SBAC may turn its cash flow to buybacks. Management likes reducing the shares outstanding:
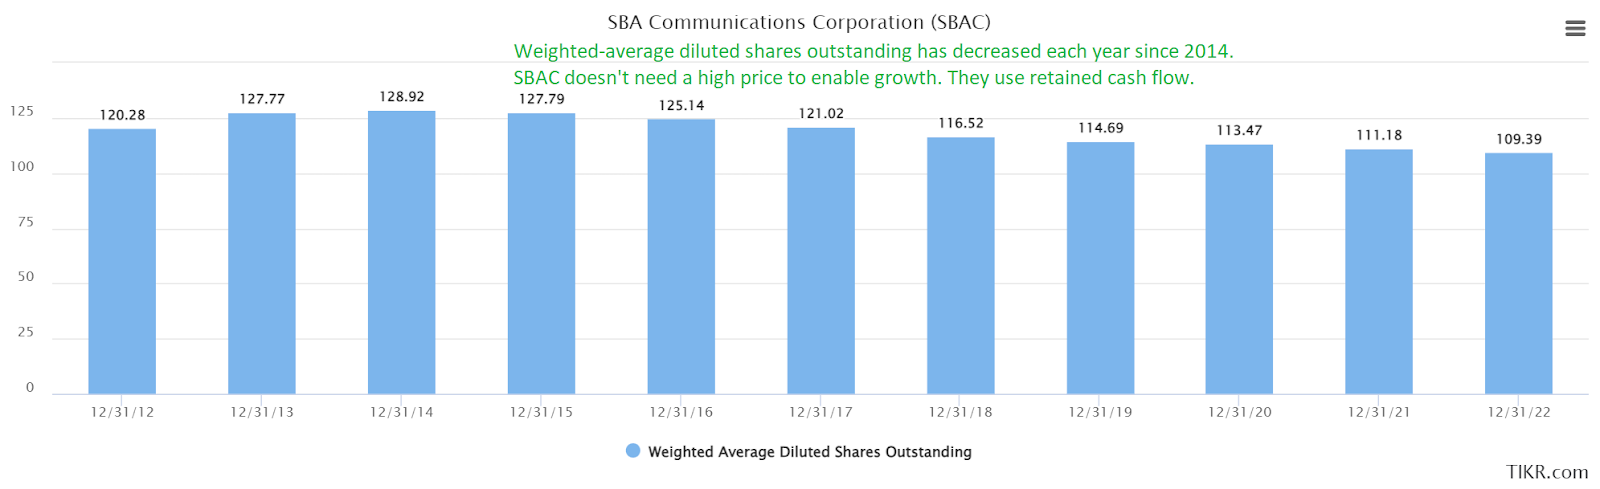
If share prices remain this low, it will be an unusually cheap multiple for buybacks.
Industrial: Last month we wrote:
Rexford (REXR) is a strong candidate. I’ve been wanting them to drop a bit further to get an even bargain on the entry price. I may have picked some up in May if it wasn’t for the plunge in SUI and tower REITs. The consensus estimate for NAV (net asset value) has actually been trending higher (after dropping between early 2022 and early 2023). Further, REXR trades at an unusual discount to NAV. I would expect REXR to frequently command a premium to consensus NAV as a strong REIT with a great management team. Over the last 5 years, the average price-to-NAV (using consensus estimates) was 1.10. Currently, it is about 0.90. That isn’t the biggest discount recorded, but it’s still far larger than normal.
We followed through by buying REXR twice in June. I see Terreno (TRNO) as a great choice also. Especially for investors who want to get a bit less exposure to California. TRNO is still in California, but it’s only part of the portfolio rather than the entire portfolio. What’s the headwind? Industrial rent growth is slowing. From all-time record levels. That’s the bearish argument. Growth rates topped out (with REXR reporting 73% cash leasing spreads and 94% GAAP leasing spreads through early June 2023). In Q3 and Q4, they’ll probably get less than 73%. That’s supposed to be a bearish argument, but it’s a bad one. These REITs don’t need 70% cash leasing spreads to be great. They don’t need 60% cash leasing spreads to be great.
Foreshadowing potential BDC trades:
Top choice in the sector today is SLR Investment Corp. (SLRC). Biggest discount to targets and a bit of relative weakness (share price underperforming peers) recently.
Foreshadowing potential mortgage REIT trades:
Last month we wrote:
First potential trade is that I might buy Ready Capital (RC). Could add a bit of cash, or I could fund it by selling AAIC.
I promptly followed through on that trade.
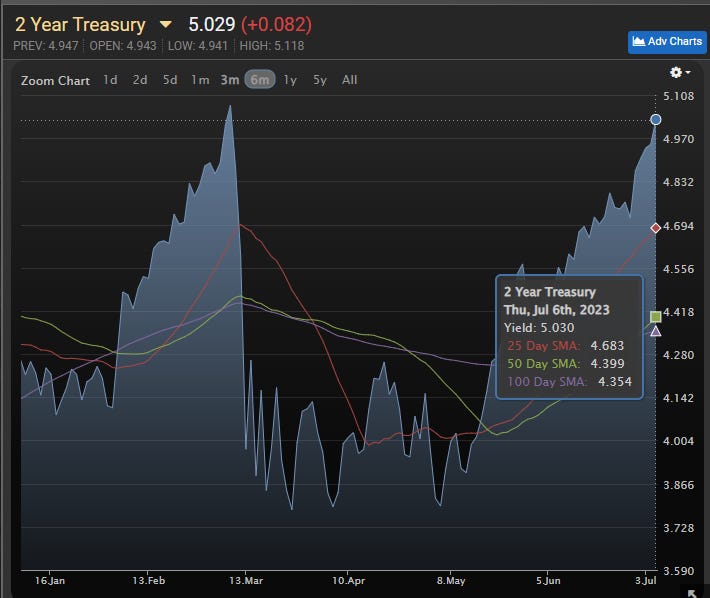
Here’s a weird one. Annaly Capital Management (NLY) might look good. It’s the end of a quarter, so Scott is drilling in on the BV estimates. End-of-quarter estimates take a bit longer than the weekly updates. I want to get those finalized estimates before trading. Given the volatility in rates, I may wait until we’re back to the weekly schedule. I’ll also be looking at the trend in yields. The current trend looks pretty bearish:
Source: MBS Live
I would prefer to see that trend break before opening a position in the common shares. The 2-year Treasury yield at 5.03% is up from 4.748% on 6/23/2023 (prior date for estimates). I’ll have more to say about inflation in some articles focused on the topic.
You want weird? Mortgage REITs were hot in June. The mortgage REIT ETF delivered 12.66% in June 2023 while yields were climbing quickly.
I know, you might want to ask: How can you say something positive about NLY after mREITs rallied that hard?
Well, this is prepared on July 6th, 2023. NLY is $18.81. When June ended, NLY was $20.01. Ripping 6% off the share price changes the valuation. With that said, the bond market has been volatile. High volatility + higher rates is a bad combination. The target may be lower after Scott finishes the updates. That’s just based on looking at the change in rates. A rapid rise in Treasury rates is usually bad for book value. I’ll be a bit wary, but it’s been rare to even look at NLY so I wanted to mention it.
There’s been some questionable coverage on NLY lately. I may put together a little something to dispel misconceptions. If you have a question about how the REIT works, add it in the comments to this article within the next few days. I’ll be answering questions and may wrap a few into a brief article. Graphics make it easier to answer questions.
Note: My alerts on SA get overwhelmed. The SA system was never designed to handle a high volume of alerts. After a few days, it’s a roll of the dice on whether I’ll see the question. Comments here trigger an e-mail to me, which is a much more effective system.
Foreshadowing potential preferred share trades:
I’ll be checking relative prices frequently. There’s plenty of opportunity for volatility here. Volatility is generally seen as bad, but it can be great when similar shares change prices at different times. We look for those opportunities to swap between shares and enhance returns.
Foreshadowing potential baby bond trades:
I’ll be looking to add RCA, depending on the valuation. We recently opened full coverage on 6 baby bonds (I’ll post it soon for premium members). This is just a way to park some cash for a bit. Volatility is low, but bid-ask spreads can be a few cents wide. I like the baby bonds as a way to lock in rates over 8% annually with maturity ranging from a bit over a month to a little over 5 years. RCA locks up my cash for less than 2 months.
Trade Alerts
Note: The links for this section are removed as they went to the Seeking Alpha articles. Since we’re adding our premium membership here, in future updates we will be able to link the alert articles on this platform.
Below you’ll see links (except for July 2023) to our trades from the month:
- 6/01/2023: Trade Alert: AAIC, RC
- 6/09/2023: Trade Alert: REXR
- 6/16/2023: Trade Alert: AGNCO, AGNCP
- 6/22/2023: Trade Alert: EGP, REXR
- 6/22/2023: Trade Alert: SBAC, DLR
- 6/27/2023: Trade Alert: EFC-B, EFC-C, EFC-A
Early in July, we also had a trade:
- 7/03/2023: Trade Alert: PMT-C
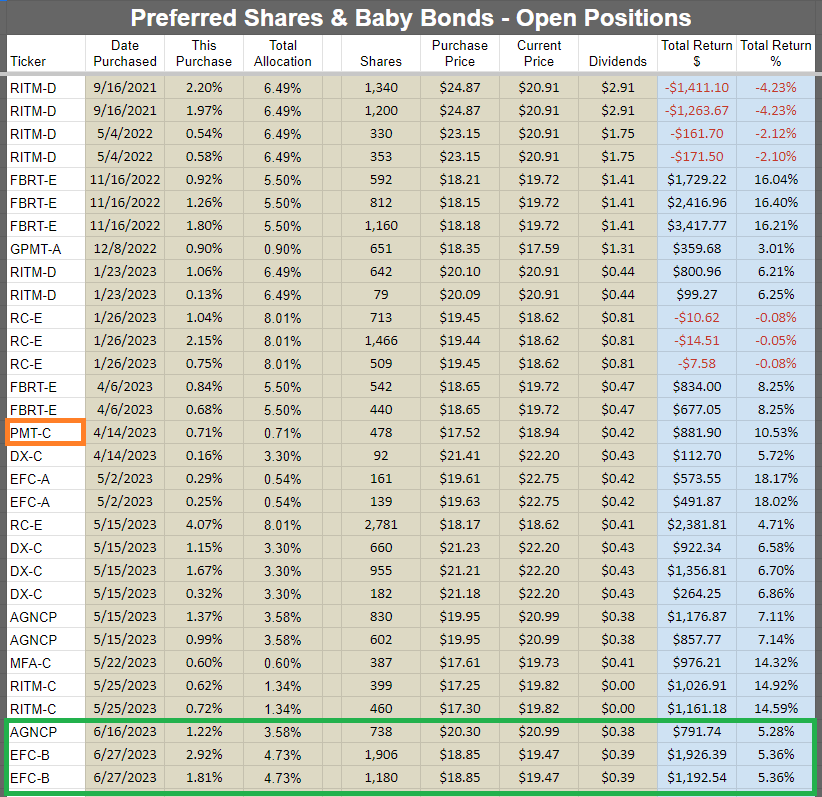
Returns to Date on Open Positions
We will start with the open positions as of the end of the month. It often takes a few days to prepare this article, but the screenshots below are from the end of the prior month.
New positions (if there are any) are highlighted by the green box.
The cell with the ticker is grey if the position is in a taxable account. This was a request by a few members and there was no drawback to adding the information.
Positions closed between the end of the month and publication have the ticker highlighted in orange.
Preferred shares and baby bonds:
Equity REITs:
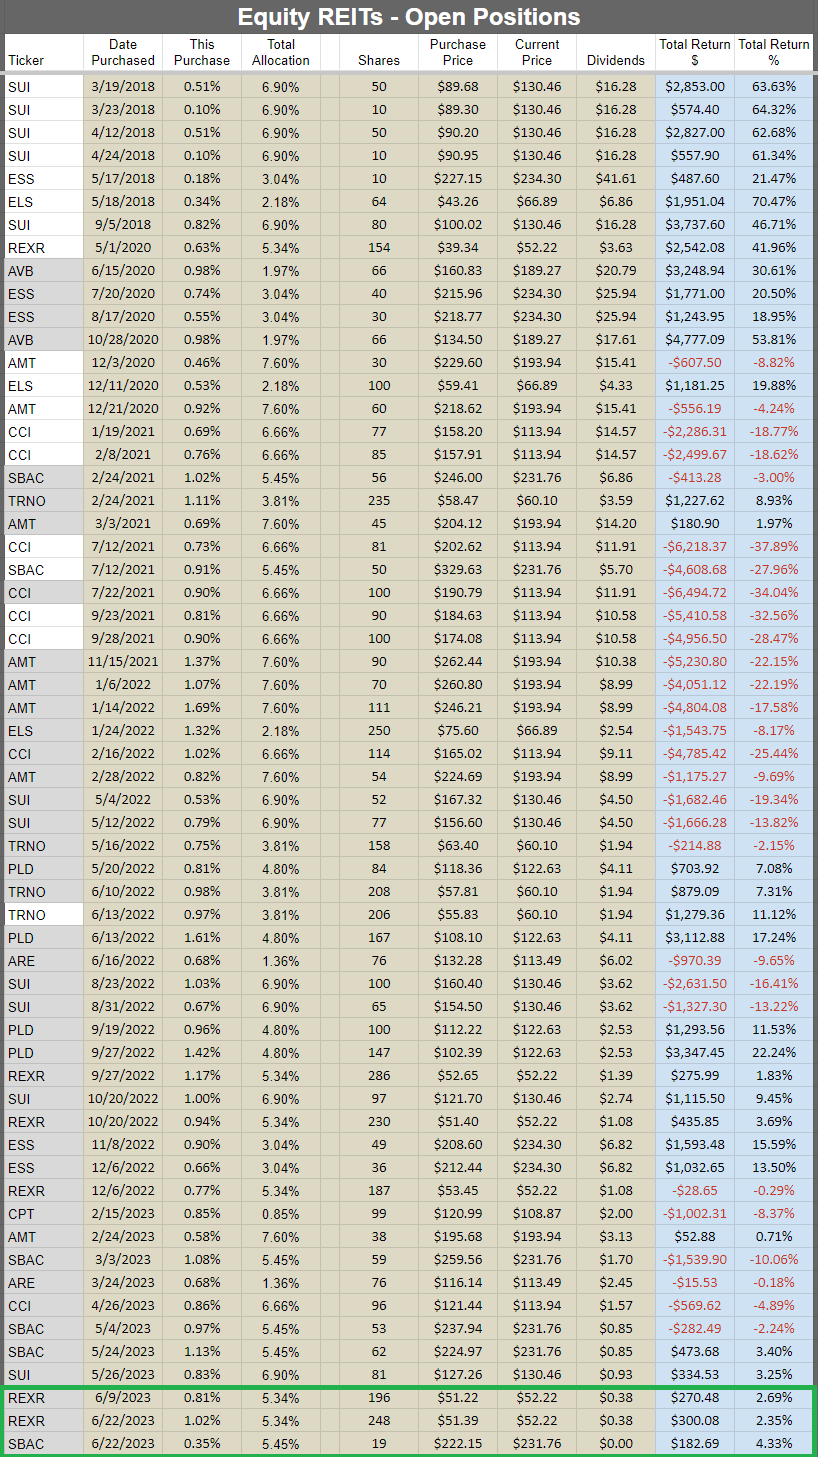
Note: You’ll see many of the tickers have a grey background now. The grey background indicates a taxable account.
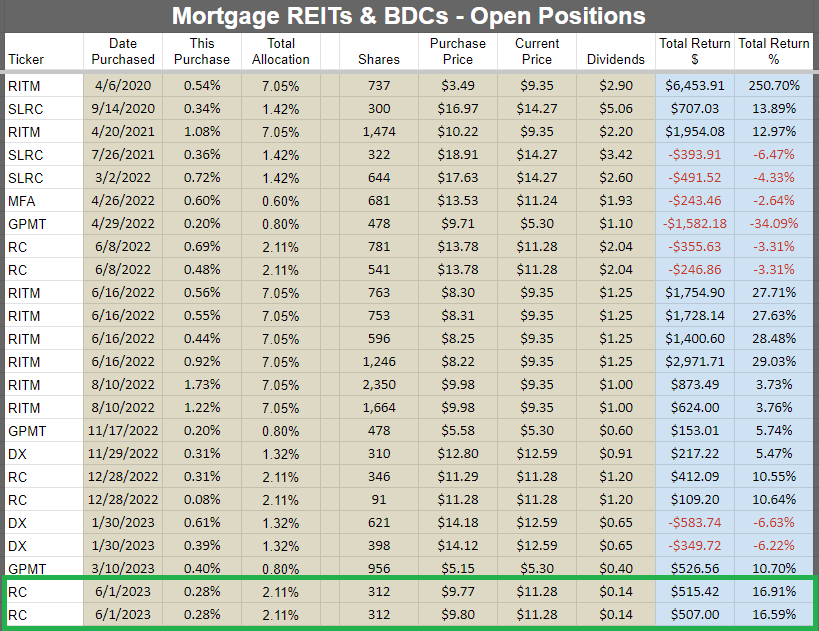
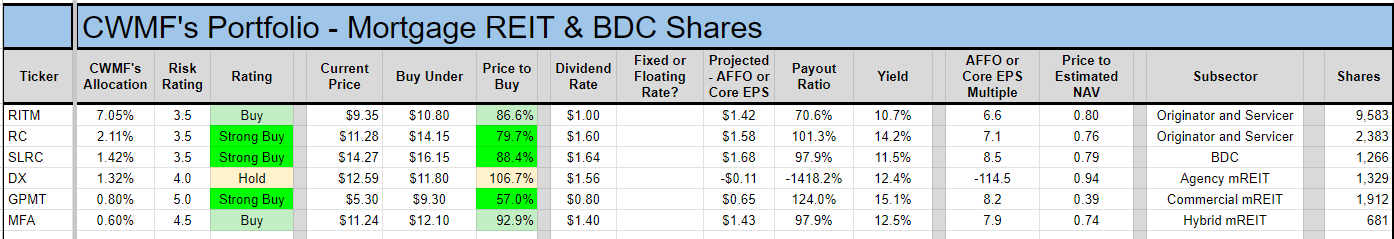
Mortgage REITs and BDCs:
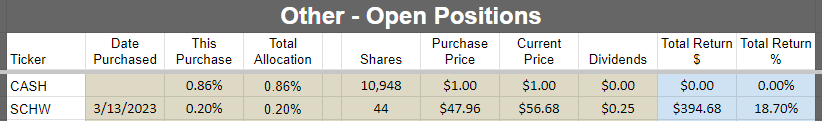
Other:
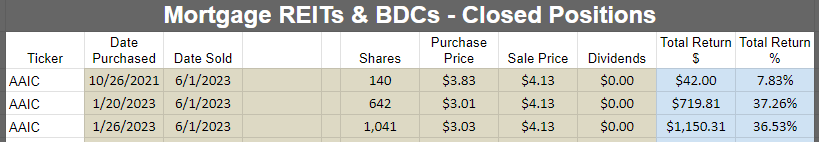
Returns on Recently Closed Positions
These are the positions closed since the last portfolio update. If you want to see positions that were closed before that, you can see the prior portfolio updates or use the Google Sheets (premium feature). If we didn’t close any positions for the sector during the month, then the image will be blank.
Note: By loading the Google Sheets, you can still see all of our closed positions. To reduce the size of the huge article, we’re only highlighting the recent changes.
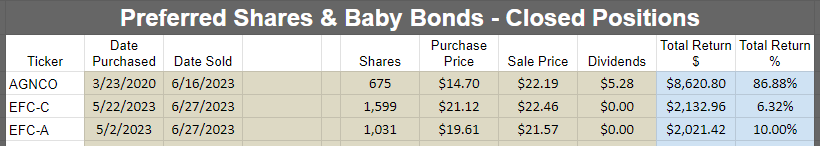
Preferred shares and baby bonds:
Equity REITs:
Mortgage REITs and BDCs:
Other:
Total Portfolio Returns
Our performance since we began preparing for The REIT Forum at the start of 2016 is shown below and runs through the end of the latest month:
Here are our results through 06/30/2023:
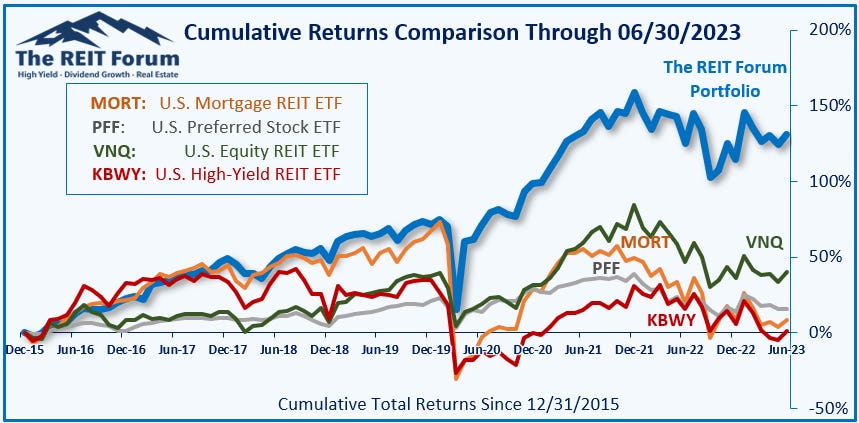
We thoroughly beat the four major indexes covering our types of assets:
- MORT - Major mortgage REIT ETF
- PFF - The largest preferred share ETF
- VNQ - The largest equity REIT ETF
- KBWY - The high-yield equity REIT ETF most retail investors follow
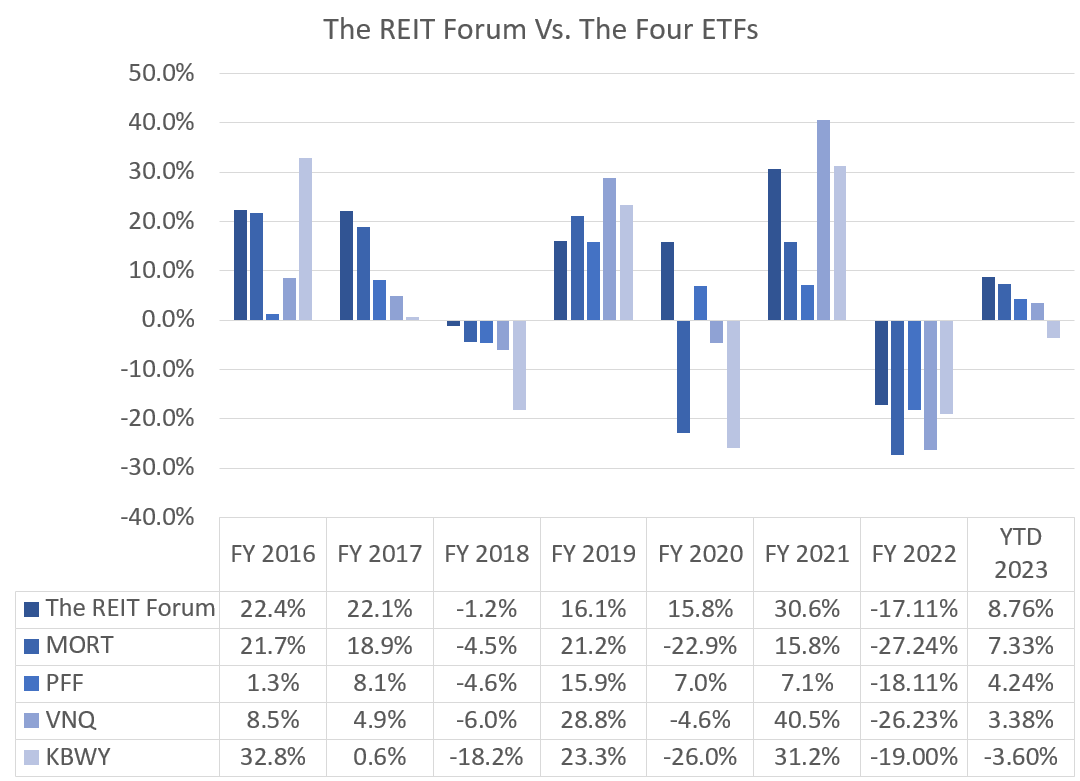
We’re still ahead of all four of the index ETFs we track. That’s great.
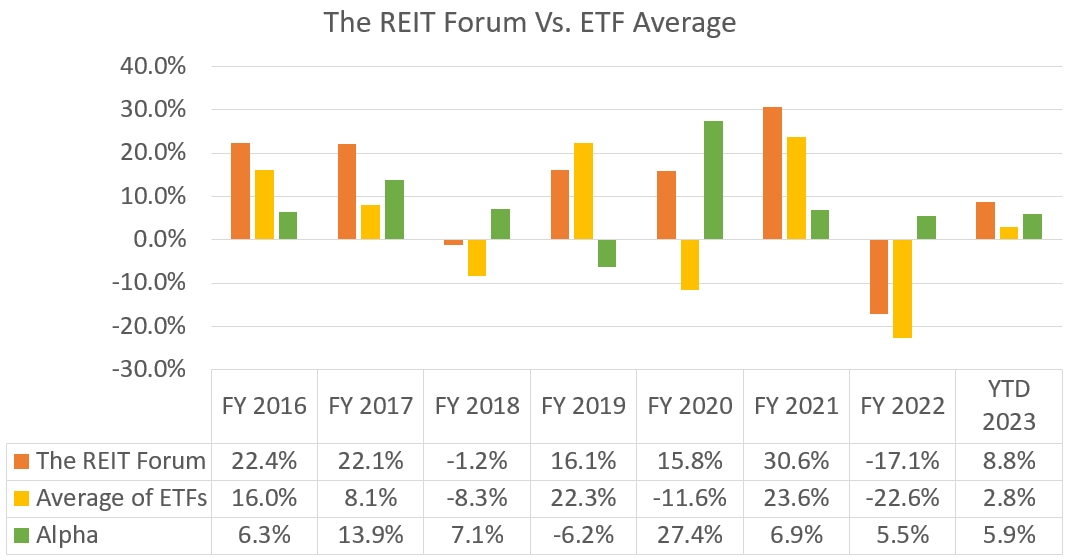
Returns were strong in June, but some of the ETFs were ripping higher. Investors were migrating into higher-risk securities. MORT and KBWY thoroughly beat PFF and VNQ. Since our actual allocation is heavier on the preferred shares and the higher-quality REITs (which also tend to be larger), that was a headwind for relative performance. Regardless, I’m feeling great about 5.9% alpha year-to-date.
The next chart shows the change in the value of our portfolio from month to month. We strip out the impact from contributions made during the month because obviously, contributions are not returns.
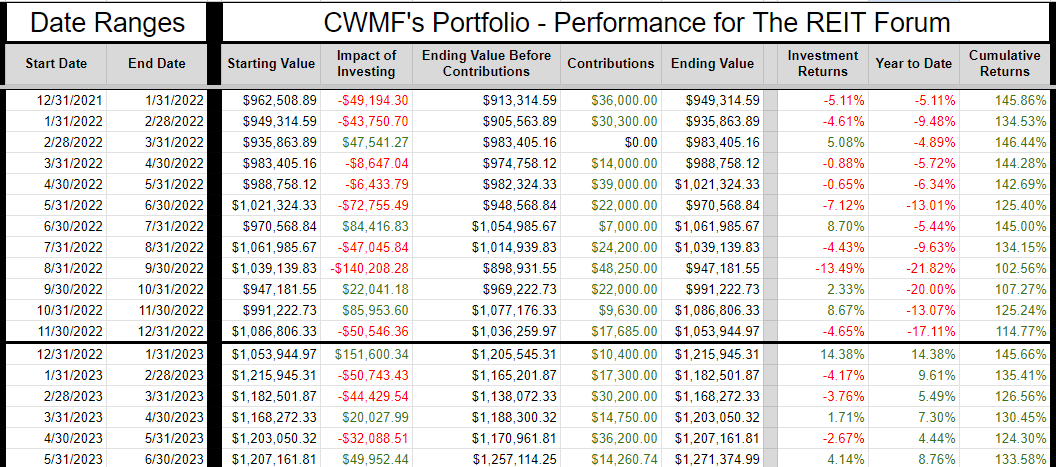
The prior year is included as well to help investors see how the calculations work. You can always access this tab, with our entire record, in the REIT Forum Google Sheets. It is called “Returns Chart” and it is the tab all the way to the right.
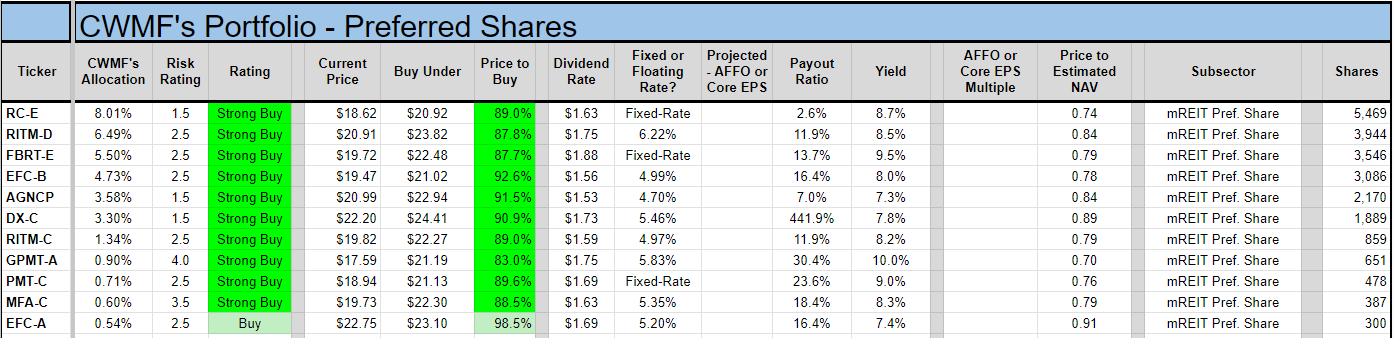
CWMF’s Portfolio Images
You can access this spreadsheet at any point by clicking the link labeled “CWMF’s Portfolio” under “Investing Resources''. These images use data from 6/30/2023.
Preferred Shares:
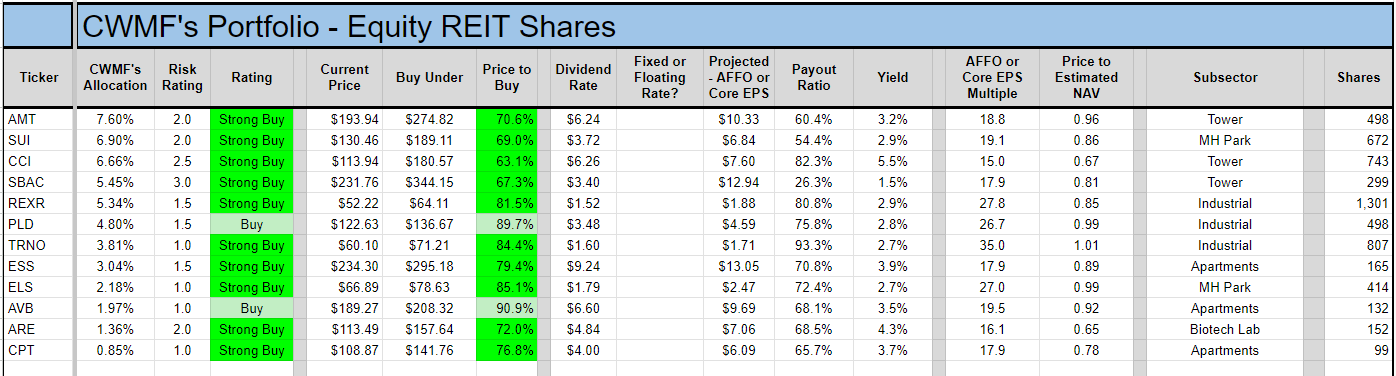
Equity REITs:
Mortgage REITs and BDCs:
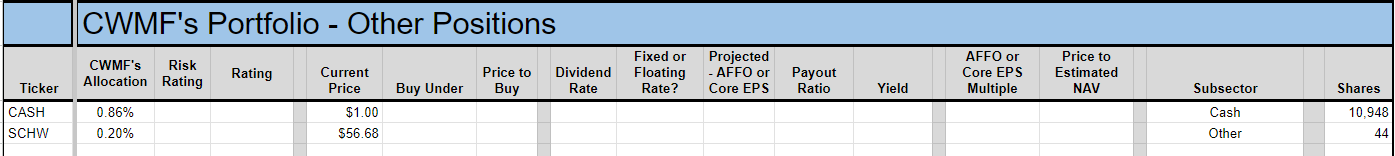
Other positions:
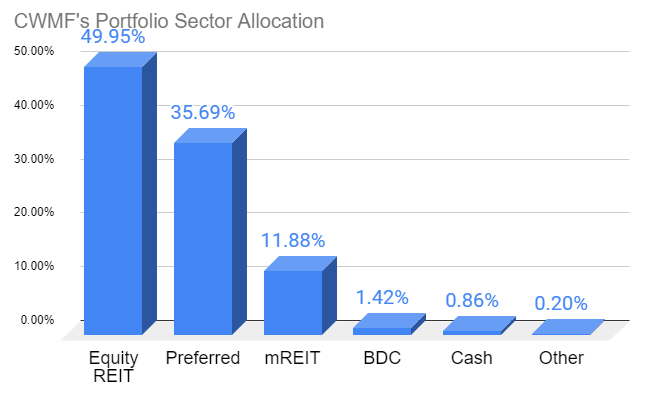
Sector Allocation Chart
The sector allocation chart helps to explain how we are thinking about risk and seeking returns:
Conclusion
There are still some great options in the sector. If investors want to lock up a bit of cash, there are some baby bonds available. I may continue to expand coverage in the sector, but it will be limited to baby bonds from companies we cover.
I’m looking at putting some cash into RCA since the bonds mature soon. I’ll also be looking for opportunities to swap between the preferred shares. All else equal, I will have a preference for picking shares that are going to start floating sooner. Just looking for the bumps we tend to see as the floating rate approaches. However, that earlier floating date needs to be supported by fundamentals (as shown in our targets) and I’d like to see some favorable technical factors (underperforming similar shares or recent strength in common shares).
Since the start of June, we’ve seen two things that shouldn’t go together. We saw rates ripping higher (despite year-over-year inflation falling as monthly values remained low). Despite higher rates, we saw investors bidding up shares of the REITs in KBWY. These are mostly highly-leveraged REITs. They have more debt and dividend sustainability in many cases was already questionable. That’s not a good position for higher rates.
Upcoming:
- Housing sector update
- Answering questions on NLY
- Fun economics article (yes, it can exist)
Member discussion