
Portfolio Update - February: Alpha to Start The Year
- We modified the order of sections to be more versatile across platforms.
- January was a rough month for our sectors, but we started the year with a solid amount of alpha.
- I have a bit of a defensive tilt, but I’m still looking to run preferred share opportunities for fixed-to-floating shares.
- I’ll cover several of them, along with the reasons we’re looking at those shares, in the foreshadowing section.
- Based on feedback from readers, I’ll be adding two mortgage REIT baby bonds to coverage (including in the spreadsheets and price targets added).
Article Starts
You can find prior installments of the Portfolio Updates on the Portfolio tab of our website:
This kind of filtering system doesn’t exist on Seeking Alpha, so it is only available through our website (which currently runs on Substack).
Older editions of the Portfolio Update are unlocked for everyone. The newest release reserves the foreshadowing section for paid members.
Layout - Modified Order
To keep things simple for our investors, the portfolio update is divided into several segments. We run the same segments (with new content) each week.
We usually maintain the same order from month to month, but I revised the order to work better with free previews. Eventually, the order will be locked in again.
- Returns on Total Portfolio
- Sector Allocation
- Reminder About Cash
- Housekeeping
- Trade Alerts
- Recently Closed Positions with Returns
- Recently Opened Positions with Returns
- All Open Positions by Sector with Returns
- Outlook
- Foreshadowing Potential Trades (paid section)
This layout maximizes transparency while keeping the foreshadowing of our potential trades within the paid section. It also loads the images together at the front, while putting the text-heavy sections together at the end.
Returns on Total Portfolio
Note: The presentation of the charts was modified slightly to enable running it through Google Sheets instead of Excel to reduce transferring data.
The chart below shows our performance since we began preparing for The REIT Forum at the start of 2016 through the end of the latest month:
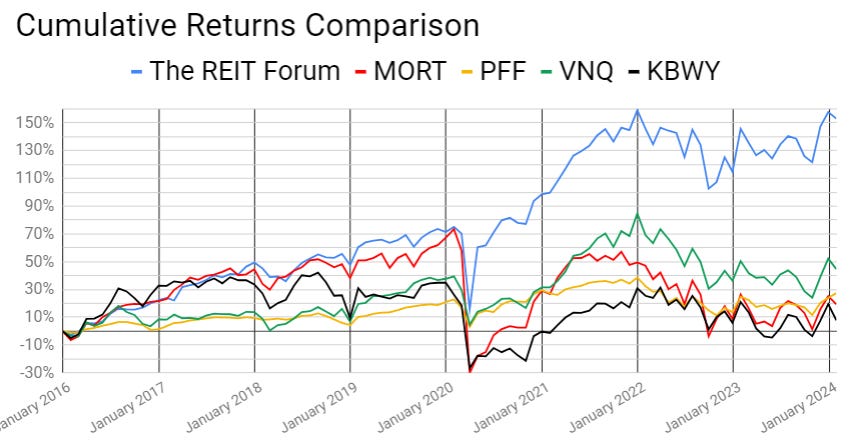
There are four major index ETFs we use for evaluating performance. They are:
- (MORT) - Major mortgage REIT ETF
- (PFF) - The largest preferred share ETF
- (VNQ) - The largest equity REIT ETF
- (KBWY) - The high-yield equity REIT ETF most retail investors follow
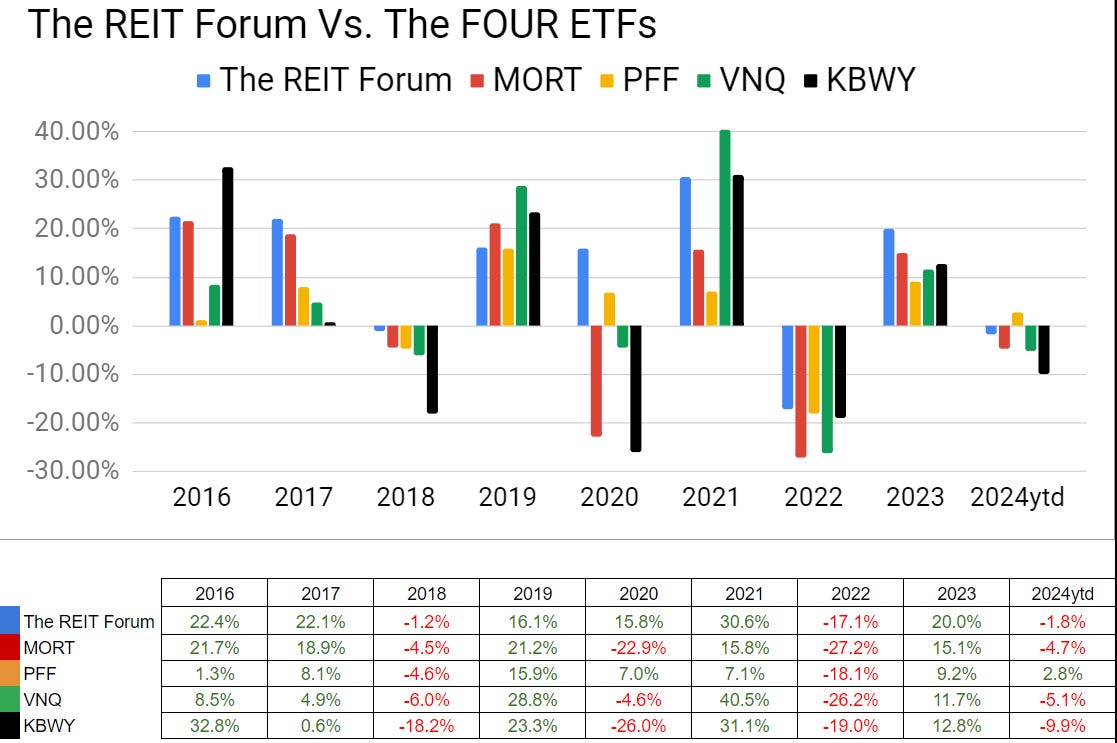
Annual comparison vs. each ETF:
Our performance vs. the average of the ETFs:
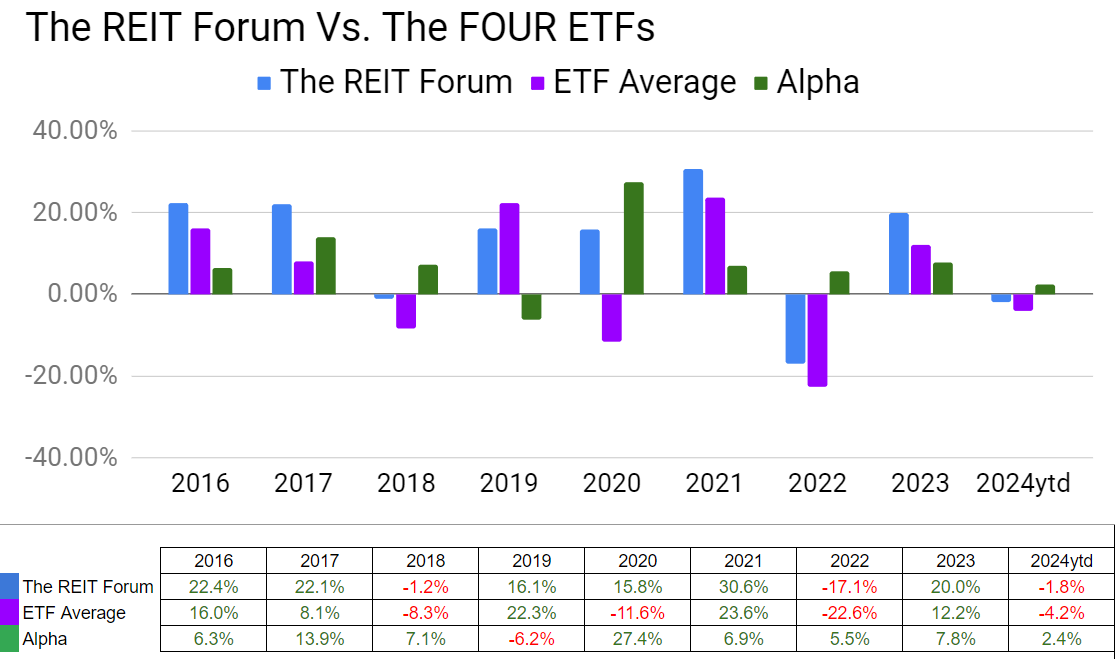
We evaluate alpha based on performance against the ETFs because it strips out the general change in our sectors.
The next chart shows the change in the value of our portfolio from month to month. We strip out the impact from contributions made during the month because contributions are not returns.
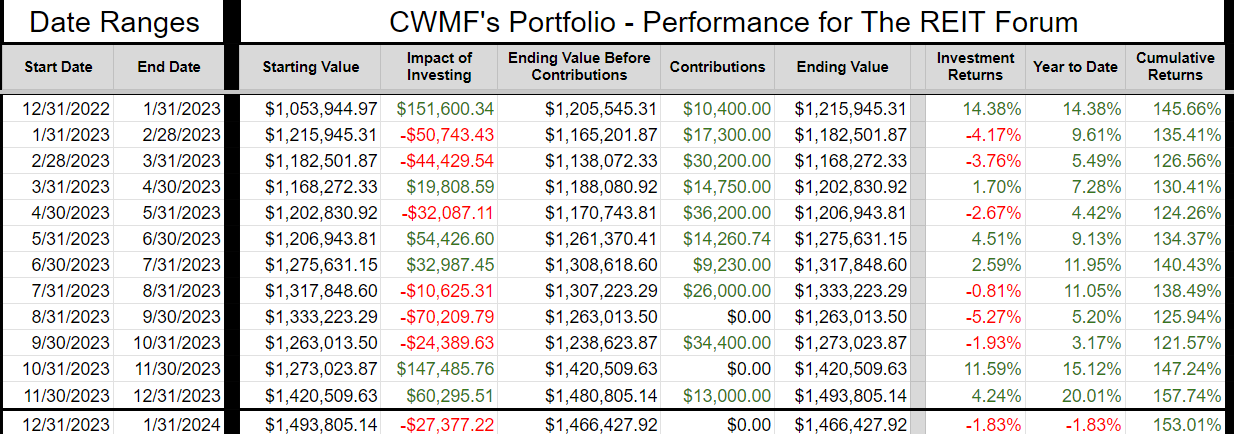
The prior year is included as well to help investors see how the calculations work.
If anyone is confused by these calculations, let me know. I believe this transparency is crucial, so I’ll include an example showing every calculation if I hear that readers have any difficulty following it.
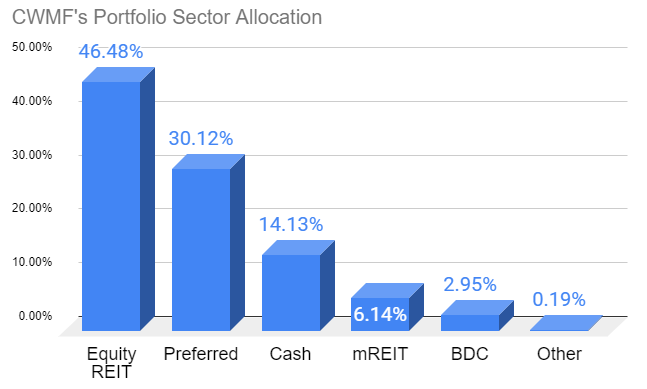
Sector Allocation Chart
The sector allocation chart helps to explain how we are thinking about risk and seeking returns:
Reminder About Cash
I normally keep at least 6 months or more of living expenses in “cash”. If you normally keep around $40k to $50k in “cash”, the difference between getting paid 5% and 0.2% is around $2k per year.
I’m using (SGOV) , (SHV) , and (BIL) as my cash substitutes. These are short-term Treasury ETFs. Prices are extremely stable. Liquidity is excellent.
I use a Schwab business account that is not part of my portfolio. The only assets it holds are actual cash and cash substitutes (those 3 ETFs).
Nearly all my expenses go through my credit card already (paid off in full each month).
I still have my checking through USAA because of the long history on those credit cards. If I need cash, I can sell Treasury ETFs and transfer the funds to my USAA account.
It takes a few days, but that’s fine.
This is a pretty nice return for cash I was going to have there anyway.
Note: Some people think you don’t need a strong credit score after getting a mortgage. I disagree. The long history on those cards is extremely useful if I want to boost someone’s credit score. If I add someone to my card, their next update will show they have a card with 20 years of perfect history.
You can get scammed this way. You are liable for the bill. They can just charge the card and walk away. This doesn’t concern me because I keep a lower limit (such as $10k) on those cards and I’m only doing it for people I trust. If one of those people betrays me, I’ll count myself lucky that I found out for only $10k. For people who can’t afford to risk that money, this would be too dangerous.
Housekeeping
We used to have a repeated section on strategy, but I wanted to shorten the update.
I’ll be posting an article that covers our strategy in greater depth and just adding a link to that post.
Trade Alerts
We already have a page that links all trades. That made this section redundant.
Here are The REIT Forum’s trade alerts.
Note: The section below covers recent trades, so it can always be used as a quick way to check our trades.
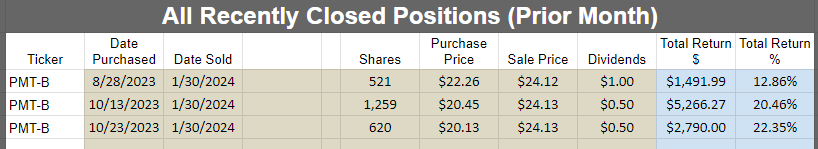
Recently Closed Positions with Returns
These are the positions closed during the prior calendar month. If you want to see positions that were closed before that, you can see the prior portfolio updates or use the Google Sheets.
If we didn’t close any positions for the sector during the month, then the image will be blank.
Note: By loading the Google Sheets, you can still see all of our closed positions. We only include the recently closed positions to reduce the size of the article:
Recently Opened Positions with Returns
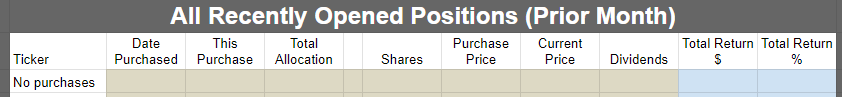
Note: This is as of the end of the month. In early February, we purchased additional shares of Ready Capital (RC) . Those are not included in the image because this portfolio update covers things that happened throughout January.
If new positions were opened during the prior month, they will be shown above and in the section below.
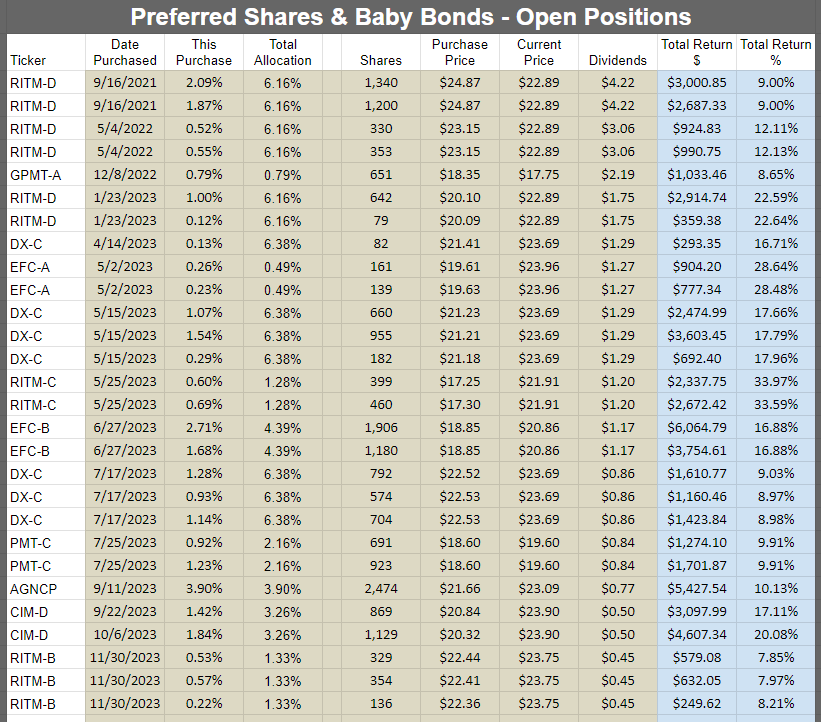
All Open Positions by Sector with Returns
We will start with the open positions as of the end of the month. It often takes a few days to prepare this article, but the screenshots below are from the end of the prior month.
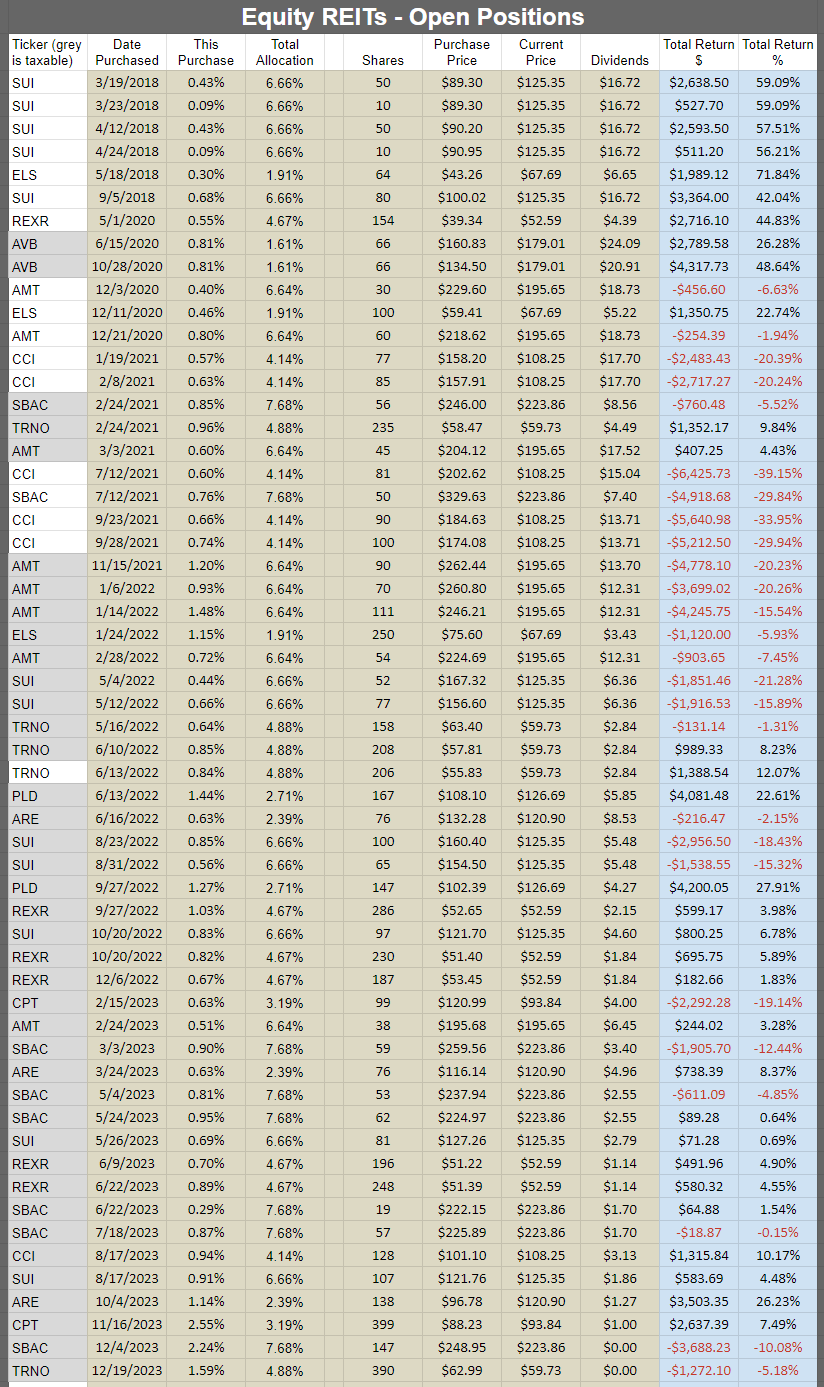
The cell with the ticker is grey if the position is in a taxable account. This was a request by a few members and there was no drawback to adding the information. All of those positions are in equity REITs.
Preferred shares and baby bonds:
Equity REITs:
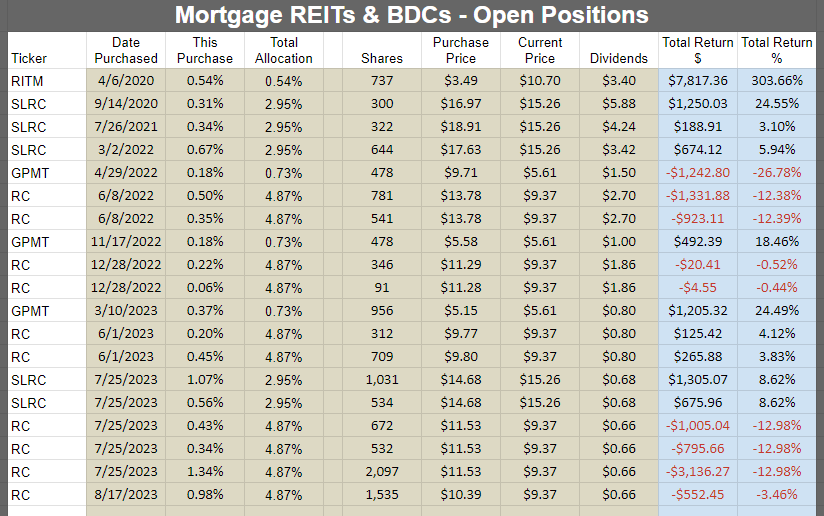
Mortgage REITs and BDCs:
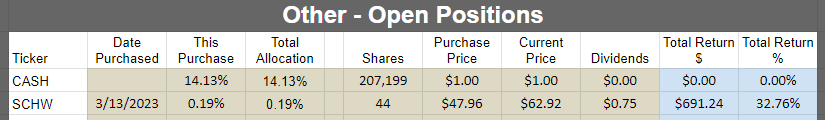
Other:
Outlook
I’m still seeing more general macroeconomic risk than the market seems to price in. With the S&P 500 hitting new all-time highs, clearly, the market has taken a more bullish approach. Yet most of the stocks we cover haven’t seen that kind of rally. Most of them, like the sector indexes, are still far away from their all-time highs or 52-week highs.
I expect fewer cuts than the market is forecasting. That’s generally negative for sentiment and it encourages me to be a bit more defensive (more cash).
However, there are many fixed-to-floating shares that begin floating over the next year or so and have very attractive yields to call. I’m not expecting a call, but based on the valuations we’ve seen so far, it appears many of those shares may trade around call value or even a bit higher after the floating rate hits. That creates some very attractive annualized returns. Catching those returns is a great way to pump our performance. A quick little trade to capture 3% to 6% in 2 months? Pulling those off shoves the portfolio value higher and enhances our return.
It’s not gaming the numbers. It’s actual cash profits taken in the portfolio because we found some good opportunities. That’s exactly how we should be seeking to build those accounts. I like to do this in the tax-advantaged accounts to protect myself from short-term capital gains taxes. I lump the equity REITs into the taxable accounts because I have a longer average holding period on them (long-term capital gains is better) and the dividend yields are lower (less taxes).
However, there’s also the logic of putting your fastest compounding investments in your tax-advantaged accounts. Our trading process for the common shares in mREITs and BDCS produced great annualized returns. Our preferred share trades have also. While a yield of 8% to 10% is nice, we’ve been able to add quite a bit to the returns by swapping back and forth between similar shares. That’s powered our total returns higher and kept our tax-advantaged accounts growing quickly.
We ended the quarter with 14.13% in cash and we’re at about 12.85% today. Probably a tiny bit higher as we may have some more dividends that hit the account. I always take dividends in cash because it makes demonstrating our performance on each position easier. I don’t have to update the share count. When the price and dividend are updated, the rest of the calculation occurs automatically.
I think my cash allocation at the end of February will probably be lower, but it really comes down to what prices are available in the market.
Foreshadowing Potential Trades
This image will get more epic each month. This is level 3:

Note on target updates:
- As we go through earnings season, there will be additional target updates. The swings in interest rates can also result in some adjustments.
- Preferred share target updates were completed in December. That is in addition to the ex-dividend adjustments, which are automatic for preferred shares. Additional updates will be coming, but most will probably have to wait until after earnings season concludes.
This section is usually prepared shortly before publishing. The goal is to quickly cover ideas for trades. We aim to foreshadow our trades here, though the market may move in surprising ways. While the article takes days to prepare and documents prices and performance from the end of the month, the potential trades section is written last to provide the most up-to-date pricing.
Based on the change in relative prices as of Sunday, 02/11/2024, here are some of the trades on my radar.
Foreshadowing potential equity REIT trades
Industrial:
I might raise my position in Terreno (TRNO) if I get a nice opportunity. I considered shrinking my position in Rexford (REXR) so it would simply be reallocating between REITs. That’s still possible, but it will depend on relative values. I recently published an article on Q4 2023 earnings for REXR and TRNO.
I was thinking about picking up TRNO the morning after earnings, but they quickly jumped higher. I’ll be watching the market and might look to enter on weakness.
While I was disappointed with REXR’s guidance and management’s decisions, I remain very confident in the future prospects for industrial real estate in California.
However, my equity REIT allocation is still pretty big at 46.48%. At least, that’s pretty big when my cash allocation is over 10%.
Housing:
I’ll also be thinking about the housing REITs. There are some pretty low multiples there, but weak growth in fundamentals (like same-property NOI, FFO, and AFFO per share) could weigh on sentiment and share prices for many months. Perhaps even over a year. So we’ll probably be playing it slow if we work on building those positions.
I’ll be working on a sector update for the apartment REITs. So many published their quarterly results close together that I think it makes sense to post one update on the batch. We can go back and add in other details as needed.
Towers: I could take another little nibble on SBA Communications (SBAC) . It still has the biggest discount among sector peers. Their earnings release is still a ways off. It’s scheduled for Monday, February 26th after the market closes.
Other: Alexandria (ARE) is back on my radar.
2 months ago, shares were about $117.
1 month ago, shares were about $130.48.
Today, shares are back to $116.20.
Note: I’m not using exact 1-month periods. I’m using the gap between portfolio updates.
When I wrote about in the prior update (1 month ago), I said:
“Alexandria was on my radar. Then it popped from about $117 during the prior update to $130.48. That’s up 11.5%. Add in the December dividend to reach 12.6%. Still on my radar. Still undervalued. However, not as compelling after it returns 12.6% in about 3 weeks. Yes, interest rates were falling. Sure, that’s nice. However, ARE has exceptionally long debt maturities and almost all debt is fixed-rate. Consequently, they are less exposed to fluctuations in interest rates. Therefore, lower interest rates shouldn’t be as important to them as it would be to some other REITs.”
Foreshadowing potential BDC trades
Seeing as Scott recently added to his position in Golub Capital (GBDC) , I might buy some shares. In particular, if we get a bit of a dip, that would stir my interest.
Foreshadowing potential mortgage REIT trades:
Last time, I said I was still considering Ready Capital (RC) . I followed through on that and picked up some shares in early February. Consequently, the new shares are not in the Portfolio Update. Depending on price action, I might buy more shares. However, I’ll probably just be sitting in my current position.
Foreshadowing potential preferred share trades:
I’ll be looking for opportunities to swap between the fixed-to-floating shares. Since I’m still not expecting the Federal Reserve to be cutting aggressively this year, I think the fixed-to-floating shares and their higher yields (when the floating rate hits) could remain quite attractive. The shares that are already floating tend to be trading around call value or above call value. I wouldn’t be surprised if some of the other shares also move higher on any of the following reasons:
- Floating date approaching.
- Floating date passes.
- First floating rate dividend gets announced.
Any of those could encourage higher prices.
If markets were efficient, we wouldn’t see such a large gap in prices between shares that are already floating and those that are not. We can calculate the difference in cash flows quite easily. We can value those cash flows easily. The market is clearly paying more for shares when they are floating than when they have a few months left before they float.
I’ll be taking a look at AGNCO (AGNCO) and AGNCP (AGNCP).
Preferred Share Math - Bonus Section
We have a position in AGNCP. Currently, the price-to-buy is a bit better for AGNCO at $24.37 (100.0%) than it is for AGNCP at $23.38 (100.9%).
Which one is really the better deal? This is a tricky question. Remember, we want the ability to jump between shares. The market usually overvalues shares that will float sooner, so AGNCO’s earlier floating date is favorable. It implies an earlier rally for AGNCO.
However, we should also think about the spread in share prices after the shares begin floating.
For that, we will turn to NLY-F (NLY.PF) (NLY.PR.F) and NLY-G (NLY.PG) (NLY.PR.G).
- NLY-F is $25.52. Spread 4.993%
- NLY-G is $25.16. Spread 4.172%.
- Differences: $0.40 and 0.82%.
I believe investors are overvaluing NLY-G.
If we based our beliefs on NLY-F and NLY-G, we would expect shares with smaller spreads to be overvalued after they begin floating.
However, we could also look at AGNCN (AGNCN) and AGNCM (AGNCM).
While AGNCN is already floating, AGNCM begins floating in about 2 months. That’s not a big difference. Sure, it impacts one dividend. However, it’s just one dividend.
- AGNCN is $25.67. Spread 5.1111%.
- AGNCM is $24.55. Spread 4.332%.
- Differences: $1.12 and 0.78%.
This is a strange situation. Based on what we see with NLY-G, I think AGNCM will probably trade above $25.00. However, I don’t really want to recommend the share because of the thin spread. I’d feel much more comfortable with wider spreads.
Is the market applying a bigger price gap between AGNCN and AGNCM (compared to NLY-F and NLY-G) simply because AGNCM isn’t quite floating yet? I think that’s the case, but some people may have a different view. In my opinion, there should be a material price gap between the two. I think the difference in dividend rates matters. That difference is worth about $.195 per share per year. So long as shares are not called, that’s a material difference. We need to factor that in as part of the analysis, even though the market places a pretty low level of importance on it today.
When I apply those lessons to AGNCO and AGNCP, things get weird.
We could make an argument for either share.
Now I’m making a bold prediction:
- If we use a 9-month measurement period, then I think AGNCO will win.
- If we use an 18-month measurement period, then I think AGNCP will win.
I think the market is actually being so inefficient in this space that I can make that call this far in advance. That’s pretty absurd.
Want to see if I’m right on this?
- For the 9-month period, give me the median daily closing price for November 2024.
- For the 18-month period, give me the median daily closing price for August 2025.
Right now, I’m favoring AGNCO a bit. That is only because I liked to swap back and forth between the shares.
If I was going to be handcuffed to one for 18 months, I’d easily pick AGNCP.
More Math
Over the next 5 dividends, using current short-term rates, I estimate:
- AGNCO (at $24.37) will pay out a total of about $2.27 (including 2 floating dividends estimated at $.525 each and 3 fixed dividends at $.40625 each).
- AGNCP (at $23.38) should pay out $1.91. That’s an edge of $.35 (one penny rounding error) for AGNCO.
- The price gap is $.99.
- Therefore, the investor in AGNCP would still be ahead by $.64.
Note: If short-term rates fall as expected, it favors AGNCP slightly more. If you assume 4 cuts (which is 100 basis points, or 1.0%), then the edge would decline from $.35 to $.225. It’s something, but not all that much.
AGNCP starts floating after 5 dividends (3 dividends for AGNCO to float), so we only need to calculate out to that point.
From there on, AGNCO wins by $.074 per year. It would take about 8.6 years for AGNCO to repay those $.64.
Therefore, when both are floating, I would expect the price gap to be less than $.40. It will probably range from about $.05 to $.35 most of the time.
Based on that math, we can be pretty confident that AGNCP should win over an 18-month period. That gives us enough time for the first floating-rate dividend to hit.
The bold part of my call is predicting that the earlier floating date for AGNCO will cause those shares to rally sooner. That shouldn’t happen because we’ve already done the math and it is clear.
Regardless, the market has been pretty consistent about putting a premium on the early floating rate. That premium has regularly been bigger than the difference in dividends.
So, I might move my position in AGNCP to a position in AGNCO. However, that is only if I can still get the trade somewhere around the current spread.
Other Potential Targets
I’m considering going after some RITM-A (RITM.PA) (currently $24.41) or RITM-B (RITM.PB) (currently $23.93) due to the upcoming floating dates in August 2024.
Also considering going back into the PennyMac (PMT) preferred shares that are supposed to float with PMT-A (PMT.PA) at $23.46 or PMT-B (PMT.PB) at $23.48. I would be particularly interested if these prices were to dip further.
Around $23.00 to $23.20, my interest starts to build quickly.
Remember that we closed out our PMT-B position at $24.13 a few weeks ago.
- In the $24.00+ range, the risk/reward profile is less favorable.
- In the low $23.00 range, we get more upside and less downside.
These shares dipped there recently, but I didn’t catch the move in real-time. So that’s a key range. In the low $23s, the risk/reward is materially better than in the low $24s or higher.
This is a riskier play because management hasn’t admitted their error yet. Any investor in these shares should be very aware that management doesn’t want to pay the floating rate and has indicated publicly that they believe the shares converted to a fixed rate. They failed to provide any rationale for that decision and our deep dive into the prospectus and the LIBOR Act resulted in a strong belief that management is simply blatantly wrong. In October 2023, I wrote PMT: Before the Market Catches On. In November, I provided a free release of our PMT preferred share research.
The question in play is whether something will force management to admit their error. The shares are not cheap and liquid enough to believe a single buyer would enter a large position and sue the company. There is some chance of encouraging regulatory pressure or pushing the Audit Committee of the Board of Trustees to research the matter.
I would also consider reallocating my PMT-C (PMT.PC) into PMT-A. PMT-C has a slightly lower yield, but significantly more upside if rates fall. However, since PMT-C is legitimately a fixed-rate share, it doesn’t have the potential catalyst from a correction in the policy.
I’m also considering CIM-B (CIM.PB) (currently $24.10) or more CIM-D (CIM.PD) (currently $23.90). These are also higher-risk shares, but it is because of underlying assets in CIM making it a more volatile mortgage REIT. If these dropped a bit, it would really amplify interest.
I closed out our CIM-B position in December (after qualifying for the December ex-dividend) at $23.81. Since then, shares rallied by roughly the amount of dividend accrual. That’s fine. For my investment in the CIM preferred shares, I want a rate of return faster than about 8%. I would be interested in the prospect of collecting another dividend and trying to sell shares closer to $25.00. The catalyst? Floating starts in March 2024. That means shares are currently on their last fixed-rate dividend period. Therefore, if credit spreads don’t widen substantially, I could be looking at a holding period under 3 months with a decent chance of collecting around $1.00 per share or a bit higher ($.50 from one dividend and another $.50 or more from price appreciation). If shares are called quickly, which is possible but a low probability in the near term, that would result in an even better return.
I was considering RC-E (RC.PE) at $19.37. However, since I still think the market is a little optimistic about rate cuts in 2024, I’m hesitant to jump in on the fixed-rate shares unless we see a stronger trend lower in interest rates (without RC-E immediately rallying). There’s also the recent weakness in the common shares. That can have a bit of correlation with the preferred shares, so it reduces the odds of a solid near-term rally.
Coverage Coming Soon
I’ll also be taking a look at the baby bonds for MFA Financial (MFA) and PMT.
Those trade as (MFAN) and (PMTU) respectively.
I’ll have coverage provided for our paid members before I would place any trades in the shares.
Conclusion
Thank you for reading our portfolio update.
If you enjoyed this piece, please feel free to share it.
You can also tap that little heart icon a couple of inches below this line.
Member discussion