
Portfolio Update - December: Alpha Breaks 11%
Main Points
- Price-to-NAV comparison between AVB and MAA is interesting. So is MAA’s historical chart for price and consensus NAV estimate.
- We published quite a bit on tower REITs already, so we’re skipping them for today.
- REXR significantly outperformed TRNO lately. Following the swing in share prices, we view TRNO as the better value.
- I’ll remain heavily interested in the preferred shares. Small target adjustments will be coming up soon. I may some some shares after I establish updated targets for paid members.
- The forward rate curve implied quite a few cuts. Great chart highlighted by Mirko Milito of Dax Trading Ideas.
Article Starts
One of the series we provide on our premium service is the monthly portfolio update.
There’s often a public preview that contains a significant preview. Older editions may be unlocked completely for free access to everyone.
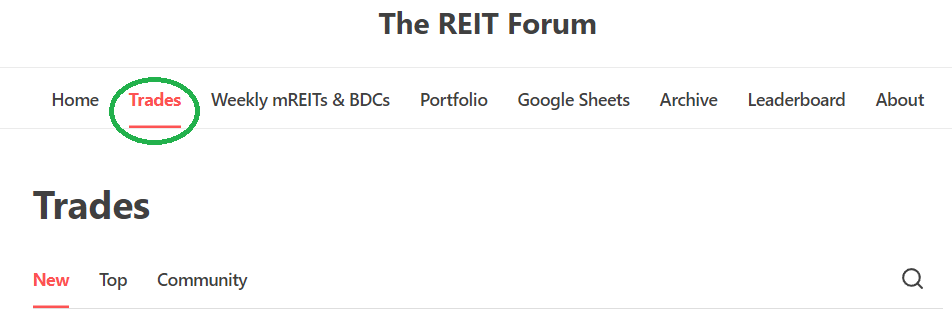
You can find prior installments of the Portfolio Updates on the Portfolio tab:
You can also reach that tab by clicking here.
This kind of filtering system doesn’t exist on Seeking Alpha, so it is only available through our website (which runs on Substack).
Layout
To keep things simple for our investors, the portfolio update is divided into several segments. The recurring segments are:
- Foreshadowing Potential Trades
- Trade Alerts (links to trades)
- Returns on Total Portfolio (note: Moved higher, this after open and closed positions).
- Outlook (we skip it some months)
- Returns to Date on Open Positions
- Returns on Recently Closed Positions
- CWMF’s Portfolio Images
- Sector Allocation
- Conclusion
- Strategy (Repeated) - This explains how we invest. It helps investors understand why we place the trades we do.
Foreshadowing Potential Trades (New Section Begins)
It’s time for a new image for this section. I’ll have some fun making this image more epic each month for the next several months.

Note on target updates:
- Net lease, residential (housing) REITs, and tower REITs are already done. Because they were done while Treasury yields were higher, those sectors could see modest increases.
- Other REITs should be biased toward negative adjustments. However, I expect industrial adjustments to be quite small.
- Preferred share updates are on the way. Most adjustments will be positive, but they will generally be quite small.
This section is usually prepared shortly before publishing. The goal is to quickly cover ideas for trades. We aim to foreshadow our trades here, though the market may move in surprising ways. While the article takes days to prepare and documents prices and performance from the end of the month, the potential trades section is written last to provide the most up-to-date pricing.
Based on the change in relative prices as of 12/12/2023, here are some of the trades on my radar.
Foreshadowing potential equity REIT trades
Same as I told investors last month:
“Because of the preferred shares with upcoming floating dates and most of my available cash being in tax-advantaged accounts (which are used for trading opportunities), I won’t have as much cash for equity REIT purchases. However, we should still cover the opportunities.”
Note: We’ve had quite a few rallies since early November, so there are fewer choices available in both common shares and preferred shares. That will tend to happen after months with huge gains. However, we still have some good ones. Most analysts don’t want to say this, because investors become much more excited to follow them after prices go up.
Housing REITs: Price-to-NAV is getting interesting. We pulled new data on consensus forward earnings (AFFO for equity REITs) and consensus NAV estimates for equity REITs. These estimates are nowhere near as precise as what Scott provides for the mREITs and BDCs. However, they can still be a useful data point. They are mostly useful for large equity REITs. For smaller equity REITs, the estimates can often be crap.
Here’s the chart comparing price-to-NAV for AvalonBay Communities (AVB) and Mid-America Apartment Communities (MAA):
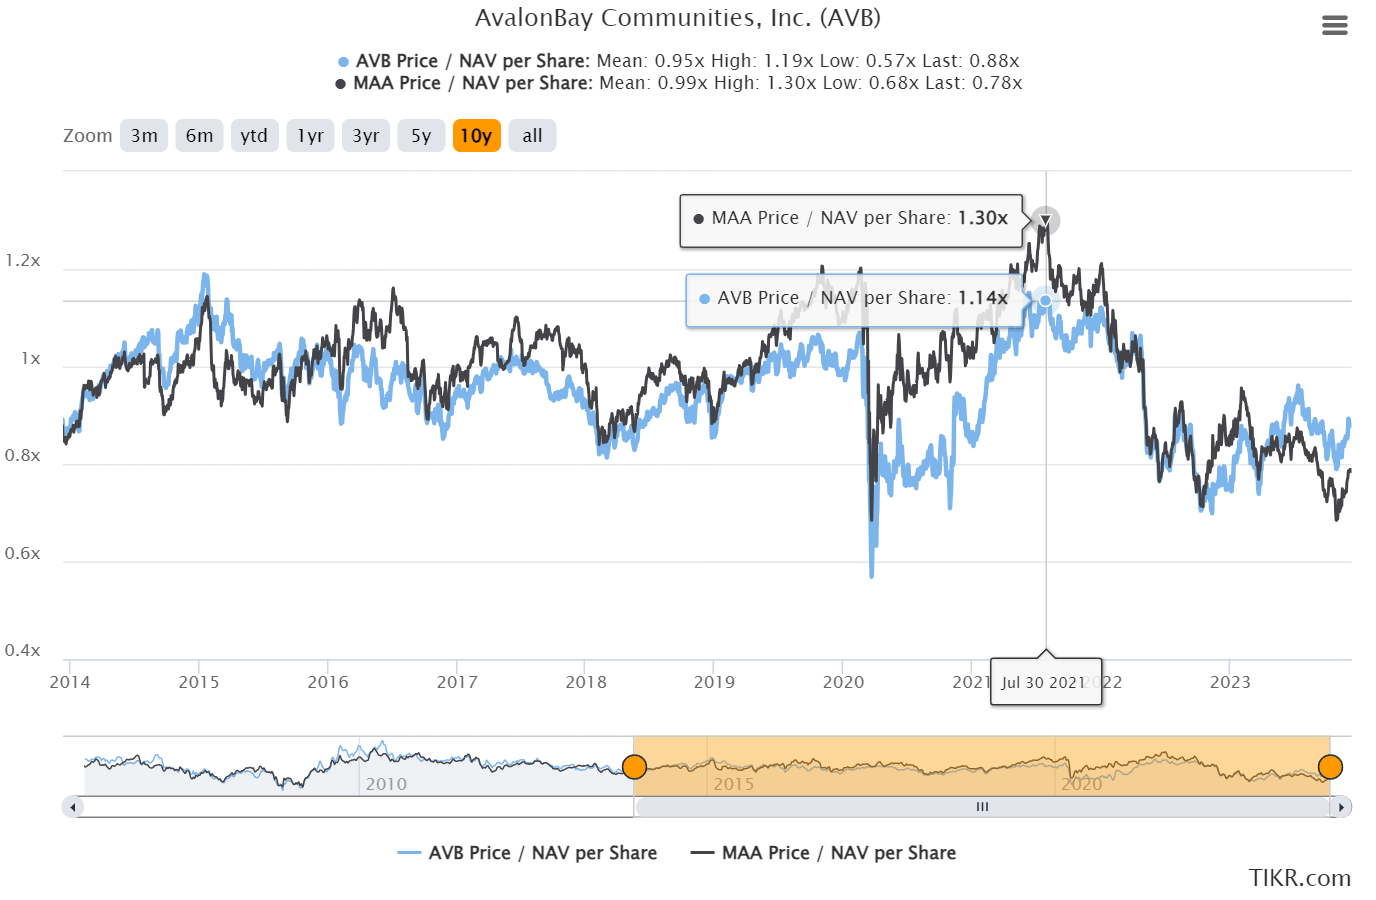
That’s pretty interesting. This was a pretty big reversal. Investors were getting in the strong performance of the sunbelt markets. However, sunbelt markets were more exposed to new supply. That headwind had a profound impact on the price-to-NAV ratio. It was absurdly high at some points and absurdly low at others.
Investors might reasonably think that the peak in share prices was the peak in the price-to-NAV ratio. That isn’t the case, though.
I pulled the charts for share price and consensus NAV for MAA rather than only using the ratio. You’ll notice that there was clearly an issue:
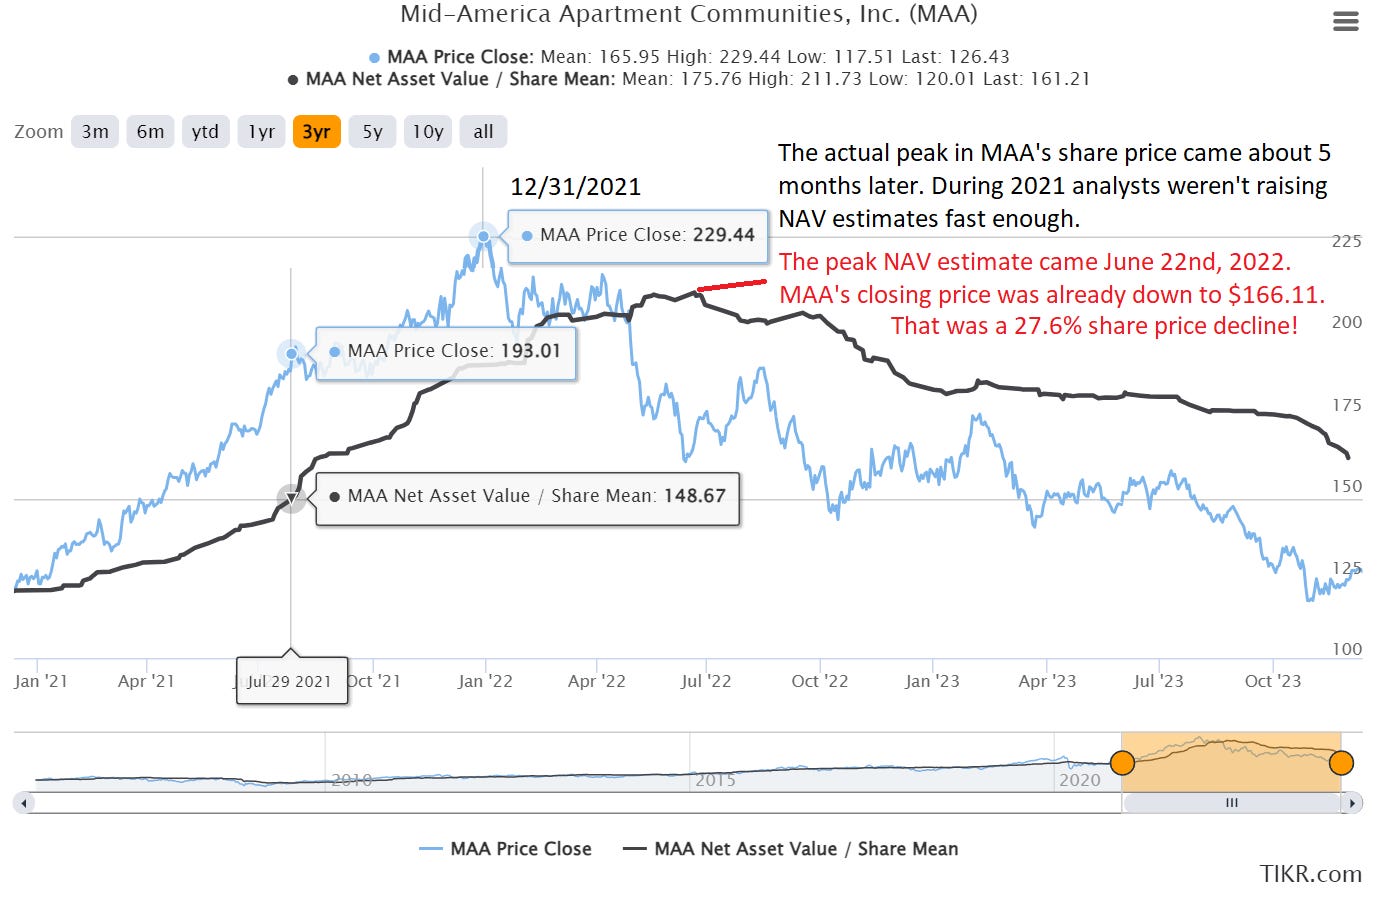
MAA’s share price topped out 5 months after the peak in price-to-NAV ratio.
Then the price fell 27.6% while the consensus NAV continued to increase materially.
Eventually, the consensus NAV estimate followed the share price. That is not the way it “should” happen, but it certainly can (especially with equity REITs).
As I said before, consensus NAV estimates for equity REITs simply are not as reliable as the estimates we’ve been providing for mREITs and BDCs.
Using the peak in NAV estimates at $211.73 and the latest estimate of $161.21, we would have a decline of 23.8%. MAA’s leverage is pretty low, so the bulk of that would have to be due to apartment prices.
That’s probably pretty accurate. We’ve seen quite a bit of pressure on the apartment valuations.
Towers: We published a big update on tower REITs with an adjustment to targets. We also had a big update on Elliott’s role as an activist in Crown Castle International (CCI). Then the news came out that the CEO at CCI would abruptly leave his position. It was pretty wild. We also saw a huge rally in all 3 tower REITs. CCI in particular saw a big rally on the announcement that Elliott would push for change in their capital expenditures profile.
Industrial: Previously, I wrote: “Rexford (REXR) still in first place on my list for the sector.”
I’m changing that this month. I’ll put Terreno (TRNO) in first place now. What happened? REXR was rocking. Since Halloween, REXR and Prologis (PLD) went on a tear. Terreno (TRNO) is also up, but the gains were materially smaller. REXR is up about 23.1%. TRNO is up about 12%.
Other: Alexandria (ARE) will remain on my radar. Once again we have a huge rally since Halloween. There was a modest dip recently. It’s a good share to keep on the radar:
- AFFO multiple is quite attractive (about 15.73x).
- Price-to-NAV is fairly low around .81. As usual, consensus NAV estimates are only so good.
The REIT is an interesting position. Leasing spreads should probably be weaker over the next few years, but that doesn’t mean same-property NOI will stop. There are still built-in escalators and the prior leasing spreads were quite strong. So being “weaker” is still relative. ARE positioned their balance sheet dramatically better than the average REIT, so higher rates have less impact on their interest expense. They were able to drive extra value for shareholders for years with their development program. However, a weaker real estate market should be a big incentive to reduce development. Thankfully, ARE was willing to sell off assets to free up cash flow. That’s been a better strategy than taking out debt. It also drives management to look at the value relative to the existing portfolio carefully. I tend to be most inclined to buy ARE when the price is plunging.
Foreshadowing potential BDC trades
I might follow Scott’s trade? Depends on how the price is performing. If it dips, I might open a small position. So far, it hasn’t.
Foreshadowing potential mortgage REIT trades:
Interested in adding a bit to our position in Ready Capital (RC). Still a solid discount there and the risk rating is at the lower end of the mortgage REITs. However, I’m also pretty light on cash and would like to get in some more trades in the preferred shares.
Foreshadowing potential preferred share trades:
Despite a big rally in preferred shares, the sector is particularly attractive because of frequent mispricing in relative values. The yields are nice also, but the mispricing gives us opportunities to enhance performance by adding capital gains to the yield.
It’s worth noting that sometimes there may be capital losses also. The emphasis remains on relative value. If an investor starts with 1,000 shares of AGNCP, trades for a different share, and then trades back into 1,030 shares of AGNP, that is inherently better. In all scenarios, 1,030 shares of AGNCP would be better than 1,000 shares of AGNCP. That’s the reason for swapping around based on relative values. It usually leads to owning a greater number of shares. If we miss out on a dividend, we should be able to increase the share count by enough to more than offset that dividend.
I’ll be checking in on this space more frequently. I may make some moves. I want to get the target updates out for paid members first. I hope to have those ready pretty soon. It’s been pretty hectic lately. We had a big push to build out our website (Substack). Before entering trades, I’ll want to consider both the fundamental factors and some technical factors.
Trade Alerts
There are links to each of my trades below.
I used to swap the links depending on which platform I was publishing to. However, that created a risk of me forgetting. Now, I’m simply including both.
Please use the link that matches your platform.
Substack links:
- 11/02/2023: Trade Alert: CIM-B
- 11/14/2023: Trade Alert: CIM-B
- 11/16/2023: Trade Alert: ESS, CPT
- 11/30/2023: Trade Alert: MFA, MFA-C, RITM-B
- 12/04/2023: Trade Alert: CCI / SBAC (Note: After month ended)
Seeking Alpha links:
- 11/02/2023: Trade Alert: CIM-B
- 11/14/2023: Trade Alert: CIM-B
- 11/16/2023: Trade Alert: ESS, CPT
- 11/30/2023: Trade Alert: MFA, MFA-C, RITM-B
- 12/04/2023: Trade Alert: CCI / SBAC (Note: After month ended)
Note: On Substack we’ve been able to segment our articles based on themes. The “home” tab includes everything.
However, the other tabs are like a filter that only includes that kind of article.
I’ll probably add a few more segments. For instance, we can create a section for earnings updates. I may also want to create a section for price target updates. The mREIT and BDC targets are all covered in the weekly series, but I don’t have a grouping yet for equity REITs and / or preferred share target updates.
Returns on Total Portfolio
Our performance since we began preparing for The REIT Forum at the start of 2016 is shown below and runs through the end of the latest month.
Here are our results through 11/30/2023:
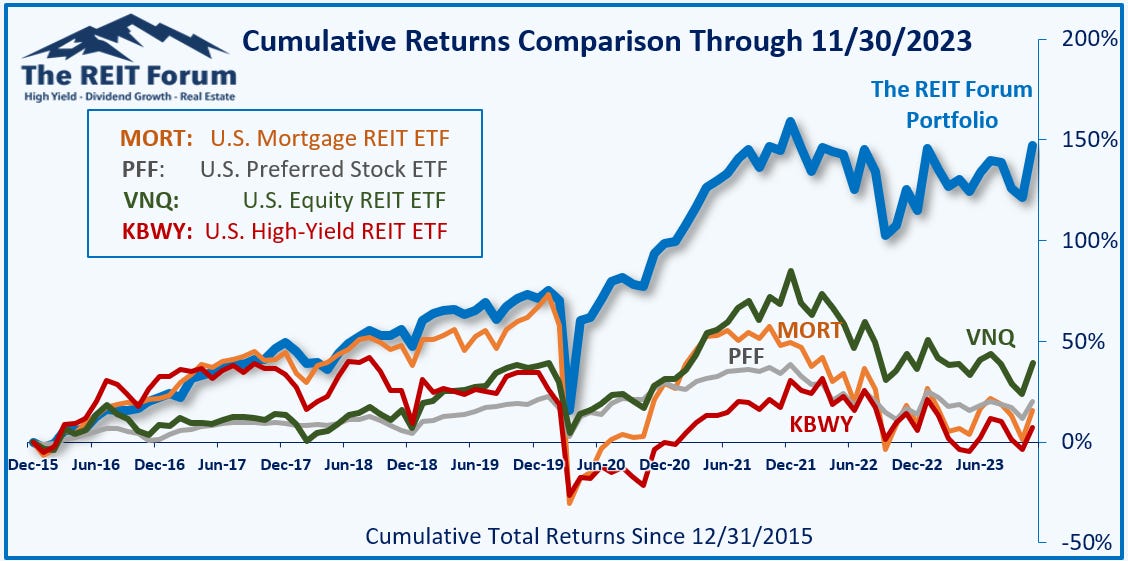
There are four major index ETFs we use for evaluating performance. They are:
- MORT - Major mortgage REIT ETF
- PFF - The largest preferred share ETF
- VNQ - The largest equity REIT ETF
- KBWY - The high-yield equity REIT ETF most retail investors follow
Annual comparison vs. each ETF:
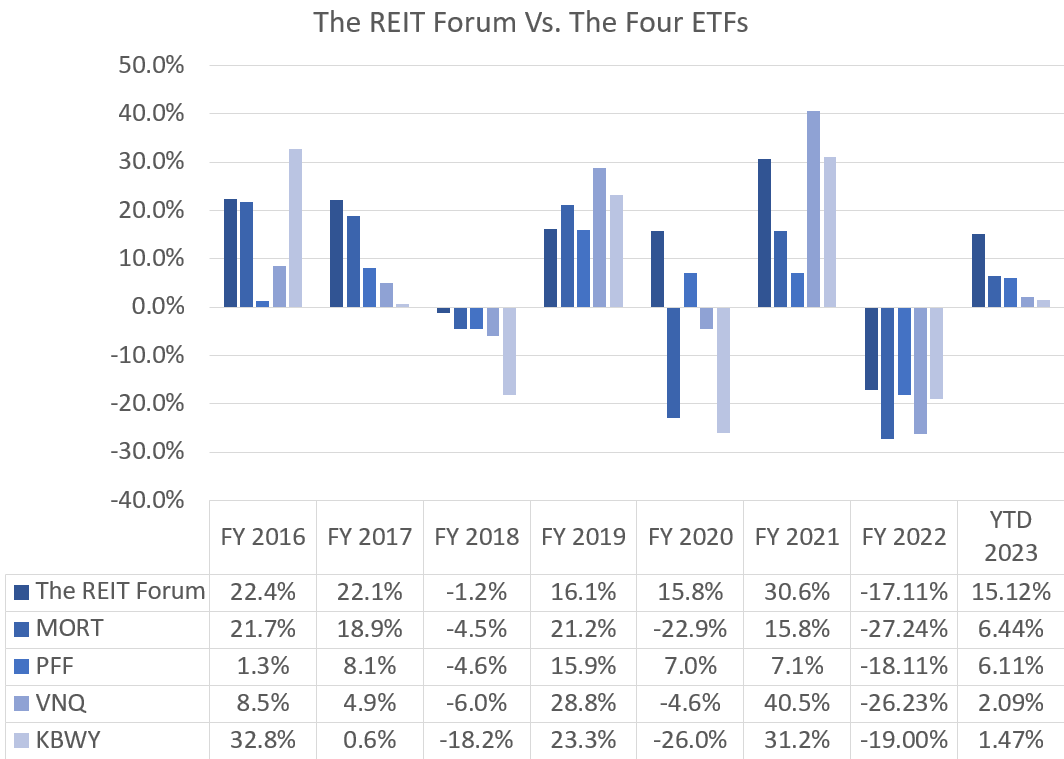
We thoroughly smashed them. That is one of my biggest responsibilities as an analyst. I am not focused on timing the market. I’m focused on picking better investments within our sectors. Sometimes the sector goes up. Sometimes it goes down.
Every new investor should be conditioned to buy index ETFs and hold them indefinitely. That should be the standard strategy for a new investor. Simply put, the majority of active investors underperform. If you have a friend who doesn’t know stocks, the first thing they should do is dollar cost average into a low-fee index fund with their retirement accounts. Just max out contributions that way. That’s the first step.
We could do that, but we are not the majority of active investors. We have a clear record of delivering better returns than our sector. Will we beat the index ETFs next year? I do not know. But we’ve smashed them since inception. The total returns demonstrate that clearly. Looking at individual years, we won in 6 out of 7 years. We’ve got a really strong shot to win again in 2023. I like to think we’ve got a good chance to do it again in 2024, but future performance is never certain.
We’re on pace for an outstanding year. We’re at 15.1% returns year-to-date and alpha is at 11.1%. That’s huge.
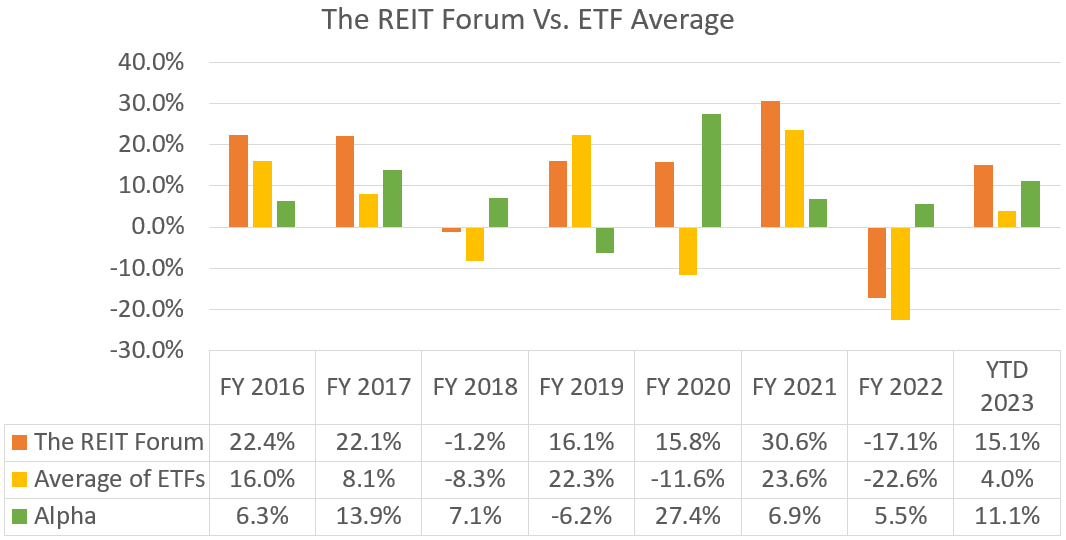
I’m feeling great about our performance for the year. The ETFs for our sector produced a very mediocre return thus far, but we’ve delivered strong performance.
I expect our alpha will dip a bit in December as the first few days of the month have favored the ETFs, but that’s not a big concern. We’ve already smashed the indexes for our sector again.
The next chart shows the change in the value of our portfolio from month to month. We strip out the impact from contributions made during the month because, obviously, contributions are not returns.
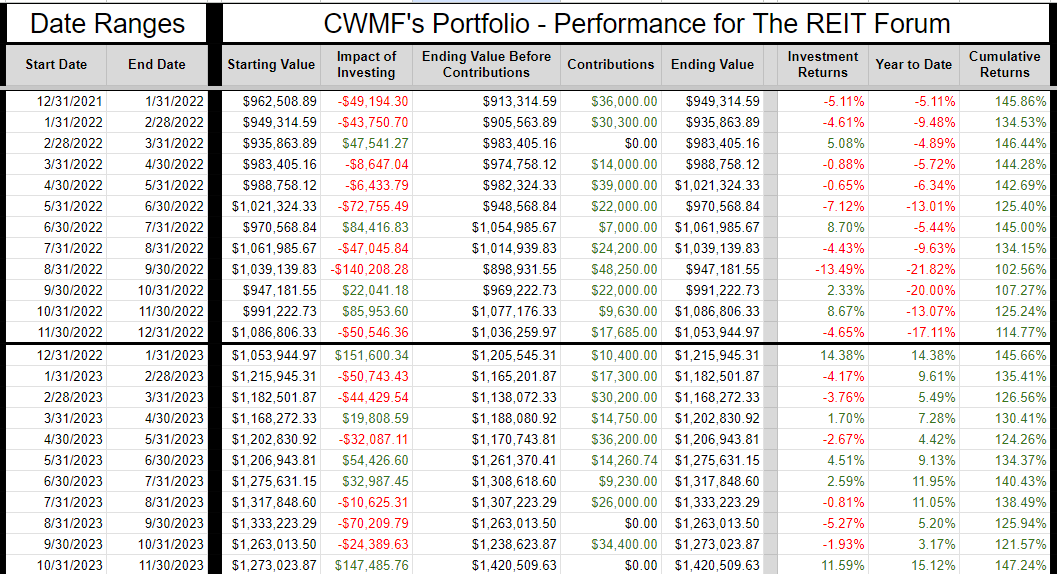
The prior year is included as well to help investors see how the calculations work.
Outlook
November was a wild month. As rates dipped, we saw a huge rally across some positions. Prices are still low enough that I’m maintaining heavy exposure, but I may be just slightly more cautious in allocations (such as picking shares with lower risk ratings). I’m still not convinced that we’re going to see the Federal Reserve cutting rates right away. The Federal Reserve was slow to act previously and doesn’t want to risk being seen as soft. It still seems to me that the prior behavior suggests they would maintain rates rather than lower them.
I want to highlight a Morgan Stanley chart I saw posted by Mirko Milito of Dax Trading Ideas. This is the history of rapid rate cuts.
Note: I’m not sure which day was used in the charts. It makes a difference. The 2-year Treasury hit a bottom on December 1st, 2023 at 4.543%.
As of December 12th, 2023 (putting the finishing touches on this article), it was 4.735%.
That’s a difference of about 19 basis points for 2 years.
The forward market represents an enormous amount of capital flows. There’s a ton of money and research behind those interest rates. However, I’m really doubting we get 6 rates cut that fast. That seems very unlikely to me. It doesn’t match with any of the commentary or posturing we’ve seen from the Federal Reserve.
In the last few years, the Federal Reserve has been dramatically wrong about the macroeconomic environment.
However, they were fairly accurate in predicting what they were going to do. I don’t expect them to let rates plunge without a very strong incentive.
Now we’re moving over to Treasury yields. The long-term Treasury yields are still screaming for rates to go lower.
The 10-year Treasury broke below the 100-day moving average and remains below it.
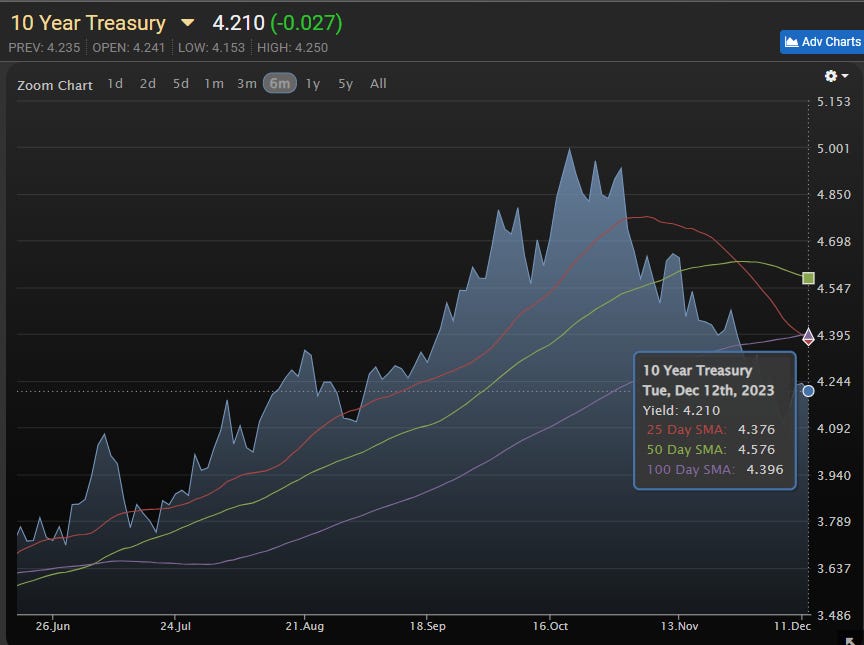
Source: MBSLive
That’s a positive sign for investors who are bullish on bonds. I expect Treasury yields to remain a significant factor impacting equity REIT prices, for better or worse.
However, it isn’t enough for me to overlook the Federal Reserve’s stance at this time.
Of course, forecasting interest rates is not a major part of my investment strategy. I’m focused on picking individual shares. Evaluating fundamentals and projecting cash flows.
That’s been a good strategy. Year-to-date, interest rates are still up. We squashed the investors who screamed:
“Rates are going higher. You’re an idiot for investing in REITs and preferred shares.”
We’re up over 15% year-to-date. Cash earned a return this year, but it didn’t earn that return.
My current focus is primarily on fixed-to-floating preferred shares. However, I may also take some fixed-rate shares where they have a respectable yield and carry quite a bit of upside. While I’m concerned that the Federal Reserve may not cut as fast as the futures market implied, I don’t think they hold rates this high indefinitely. Inflation is still propped up by the lagged shelter data. As that impact comes down, it will be harder to generate the hysteria used to advocate for high rates.
Yes, I know. Some investors love higher rates. However, the Federal Reserve is trying to get the entire country to believe that higher rates are necessary.
No, real rates are not negative. They were negative. They were extremely negative. But forward interest rates should not be compared to inflation from prior years. They are significantly positive today.
I’m not saying, “That’s good” or “That’s bad”. You didn’t come here for moral judgments. This is The REIT Forum, not The Sanctimonious Forum.
Most likely, you came here because you’ve seen us smash the sector and you enjoy doing it with us. You have my gratitude. I enjoy smashing the sector with you as well.
30-Day Trial
I understand that sometimes a 7-day trial isn’t enough time to evaluate a service. Consequently, I’m offering investors a 30-day trial.
I can’t make this offer on other platforms because the tools simply are not there. I can only create this offer on Substack.
You can click here to get a 30-day free trial of our service.
Yes, the section below will offer a 7-day trial. I can’t change that one, so I’m including the 30-day link in this section.
Returns to Date on Open Positions
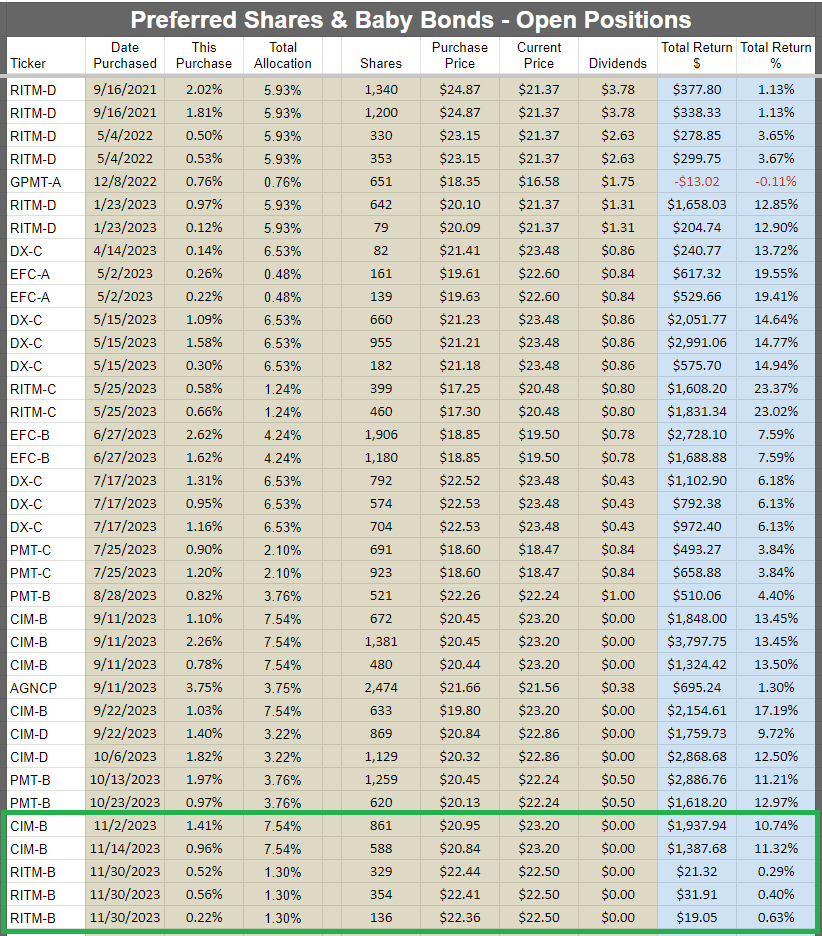
We will start with the open positions as of the end of the month. It often takes a few days to prepare this article, but the screenshots below are from the end of the prior month.
The cell with the ticker is grey if the position is in a taxable account. This was a request by a few members and there was no drawback to adding the information. All of those positions are in equity REITs.
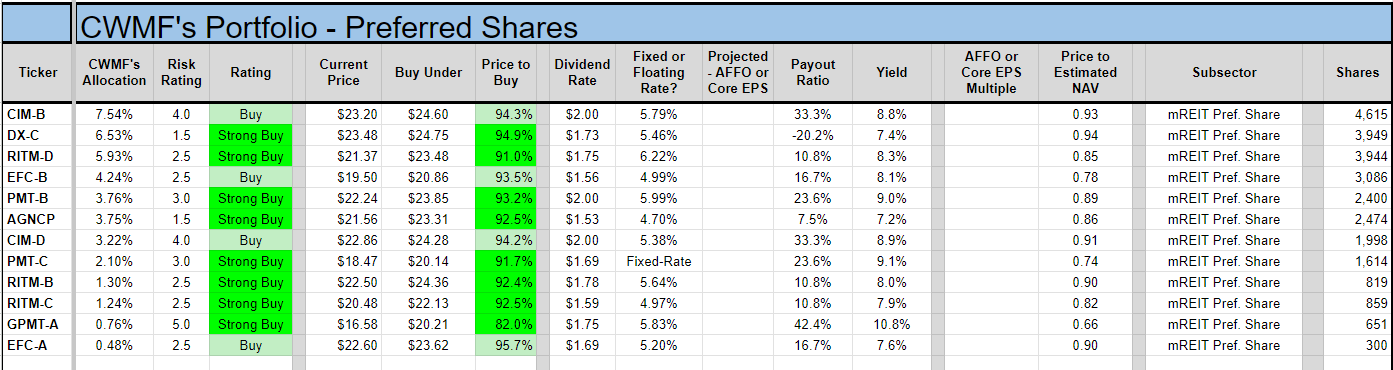
Preferred shares and baby bonds:
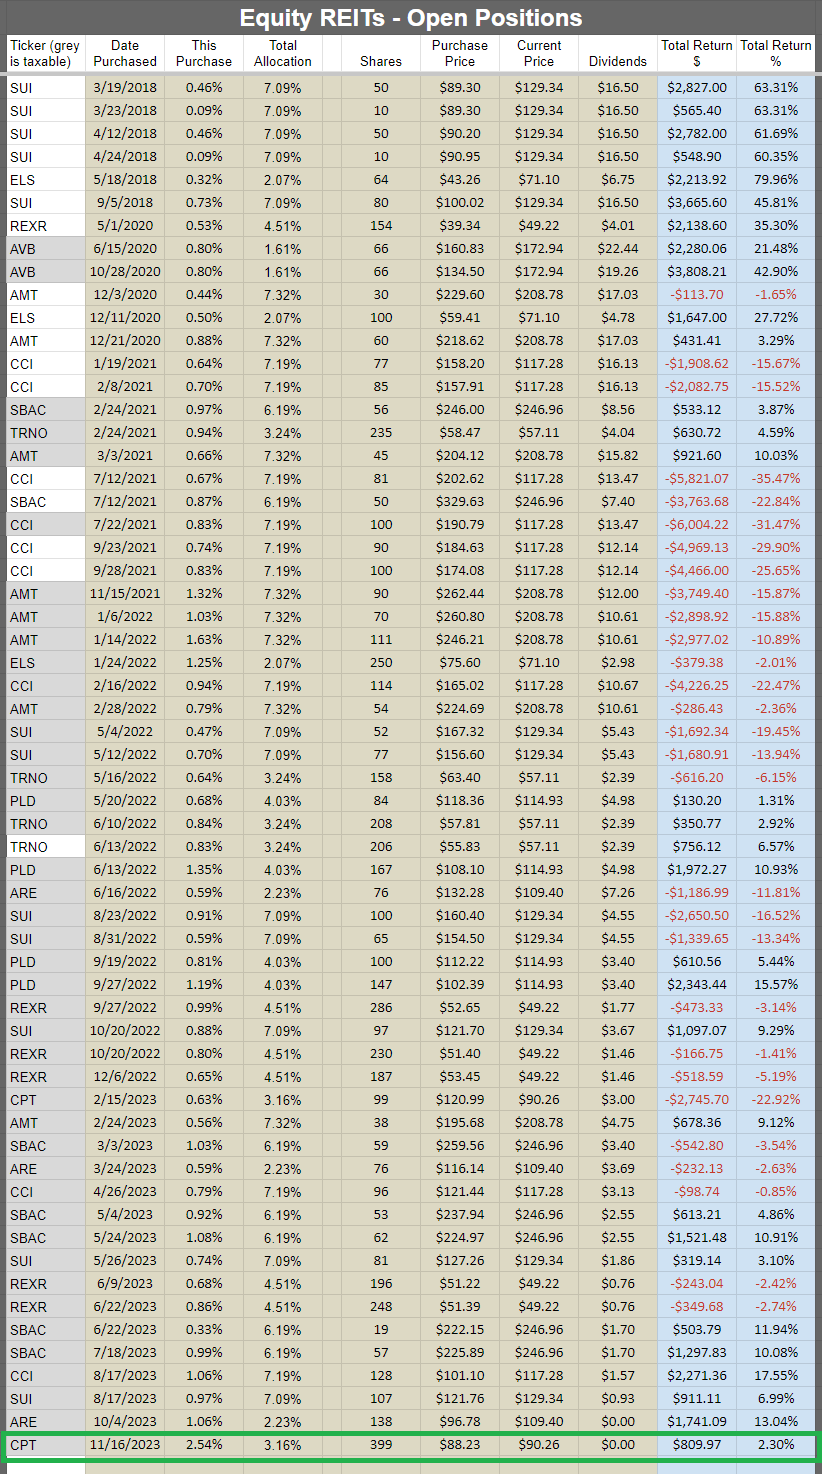
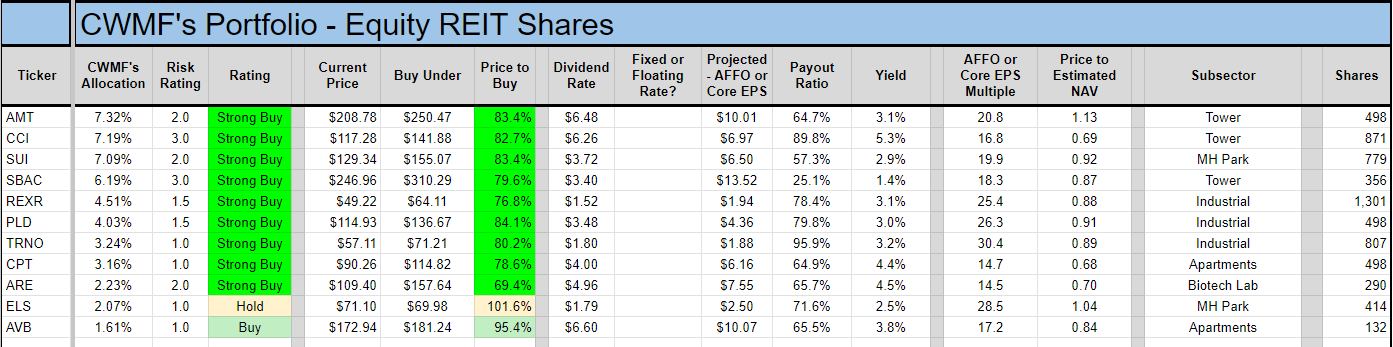
Equity REITs:
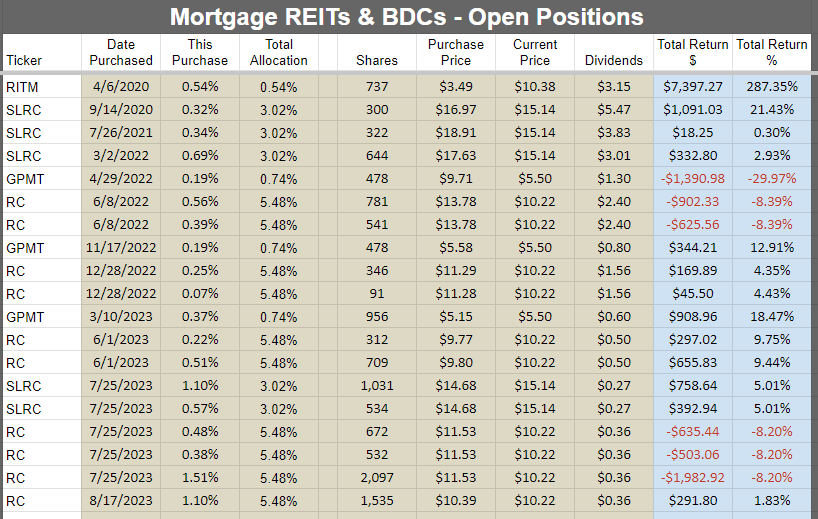
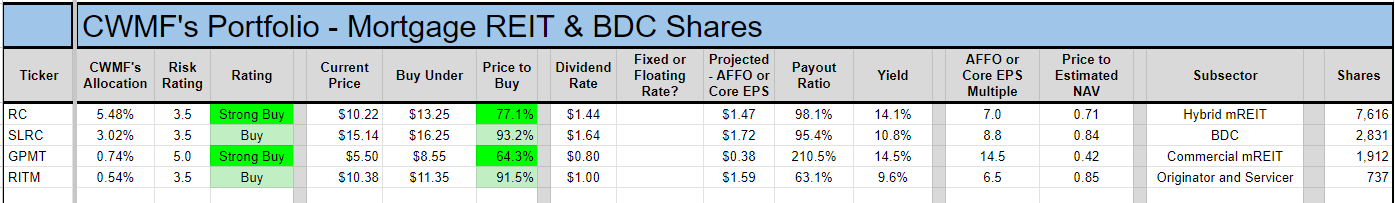
Mortgage REITs and BDCs:
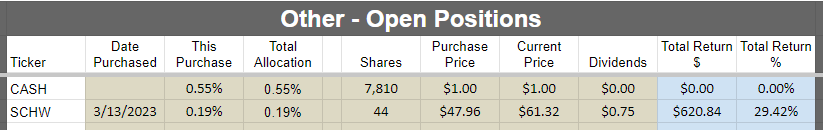
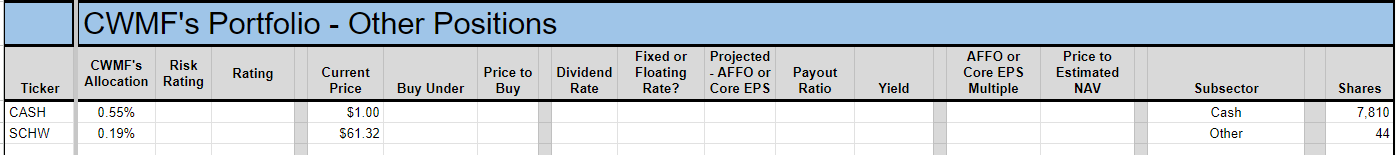
Other:
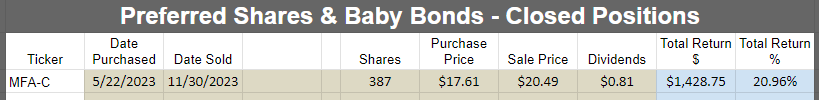
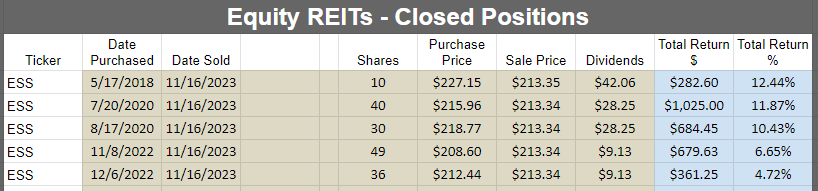
Returns on Recently Closed Positions
These are the positions closed since the last portfolio update. If you want to see positions that were closed before that, you can see the prior portfolio updates or use the Google Sheets. If we didn’t close any positions for the sector during the month, then the image will be blank. Note: By loading the Google Sheets, you can still see all of our closed positions. To reduce the size of the huge article, we’re only highlighting the recent changes.
Preferred shares and baby bonds:
Equity REITs:
Mortgage REITs and BDCs:
Other:
CWMF’s Portfolio Images
These images use the data from the end of the month. That includes the prior price and prior targets!
Preferred shares and baby bonds:
Equity REITs:
Mortgage REITs and BDCs:
Other:
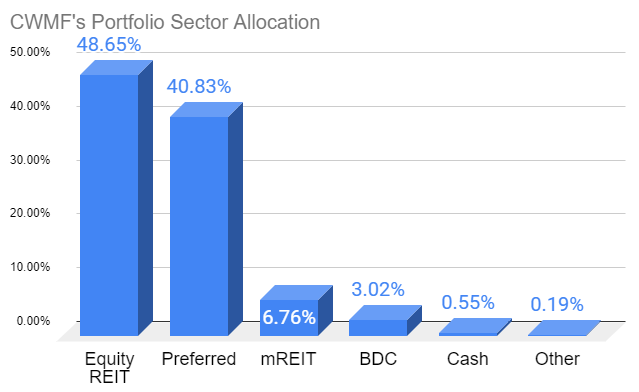
Sector Allocation Chart
The sector allocation chart helps to explain how we are thinking about risk and seeking returns:
Conclusion
This section was replaced by the Outlook section for this month.
Reminder About Cash (Repeated)
Finally, I would remind investors to make use of short-term Treasury ETFs. These are a perfectly suitable replacement for cash if you expect to know you’ll need it a few days in advance. I would normally keep at least 6 months (often more) of living expenses in cash. If you normally keep around $40k to $50k, the difference between getting paid 5% and 0.2% is around $2k per year. I’m using (SGOV) and (SHV) as my cash substitutes. Another good option is (BIL). When cash is needed, I’ll transfer it from the brokerage account over to regular checking.
Note: I use a separate account for holding this cash. It doesn’t get factored into my portfolio. It is functionally a checking account, but it is technically a brokerage account capable of owning shares. There are some alternatives for money market funds as well. Just beware of leaving significant amounts of cash in a near-0 yield checking account.
Strategy (Repeated)
For new subscribers, we should emphasize that we often treat our positions differently. We have those we consider as being primarily “Trading” positions and those where we prefer to “Buy and Hold”. A simple way to remember it is that anything with a high risk rating is probably going to be a trading position. Most of those high-risk positions are mortgage REITs and BDCs. These are two very challenging sectors where most investors (and “analysts”) simply don’t get it. Analysts who can’t predict the changes in book value for mortgage REITs or NAV for BDCs aren’t in a position to trade them. Analysts who don’t know how to evaluate the probability for dividend cuts (or raises) are in a weaker position for trading them. We have access to a great analyst (Scott Kennedy) who delivers exceptional estimates and price targets. If we only bought and never sold, we couldn’t reallocate to take advantage of the next disparity in valuations.
When we switch over to equity REITs, we usually have a long time horizon for investments. We’re thinking more about growth in AFFO per share and the long-run outlook for the sector. Consequently, we will pick REITs with lower risk ratings. The risk rating on an equity REIT correlates heavily with how much debt the REIT is using. That isn’t the only factor, but the correlation is strong. When debt levels are high, that alone can be a sufficient reason to assign a higher risk rating. Consequently, you’ll see us trading equity REIT positions far less actively. We will mostly wait for opportunities to buy a great REIT at an attractive price. We simply don’t want the mediocre equity REIT, not even at a low price. It doesn’t fit our strategy.
Preferred shares can be used in either way. However, you’ll often see our positions listing a “short” holding period. That’s because we frequently swap between different preferred shares that are at least roughly similar. For instance, we might sell NLY-F to buy NLY-I, then sell NLY-I to buy AGNCO, then sell AGNCO to buy NLY-F again. Why would we do that? They each have a risk rating of 1, trade at roughly similar prices, and will carry similar spreads when they begin floating. So what are we doing? We’re taking advantage of a change in the relative prices. By the time we’re back to the initial share, we are able to have more of them. If each time we traded between those shares we ended up with a 1% increase in the share count, we could end up with 3% more shares of NLY-F at the end of that trade than at the start. That leads to faster growth in the total portfolio. It appears that we’re selling the preferred shares quite often, but frequently it is just a change between two similar shares. We do this when we’ve found the spread in prices is large enough to let us exit one position and enter the next.
This may be different from the methods you’ve seen employed by other analysts. You may have joined us because you became tired of mediocre results. Our better results have been a function of our unique strategy.
Member discussion