
Portfolio Update - August: Rates Drop, REITs Soar
Warning! We’re in the middle of earnings season. There really isn’t much time to push out a comprehensive update.
Normally, that means this update could take weeks.
Or, I could just update the charts and share my thoughts.
We’re going for an all-time record for the fastest end-of-month update we’ve ever published: Hours after the last market close for the month.
There’s probably some typos. Sorry about that. Cost of speed.
Interest Rates
What a month!
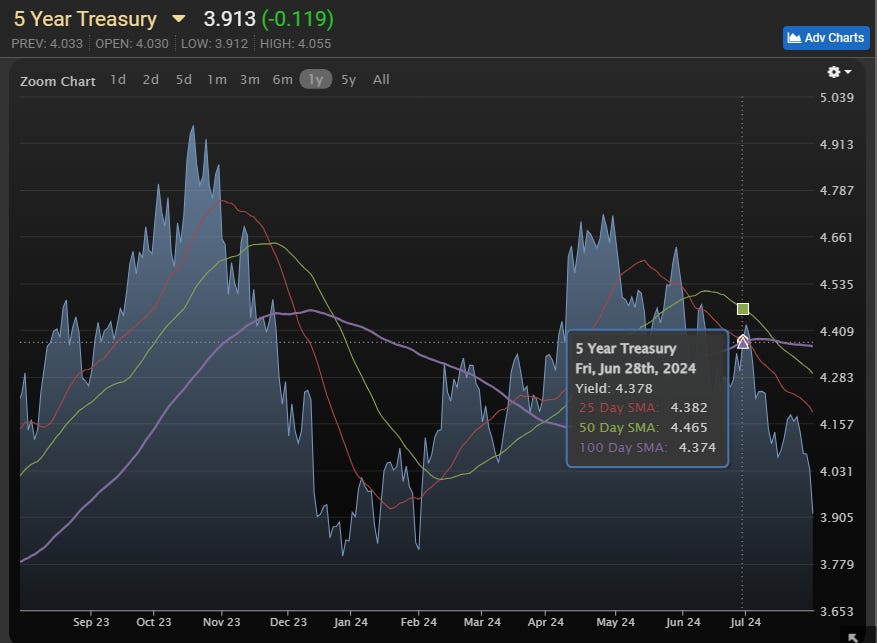
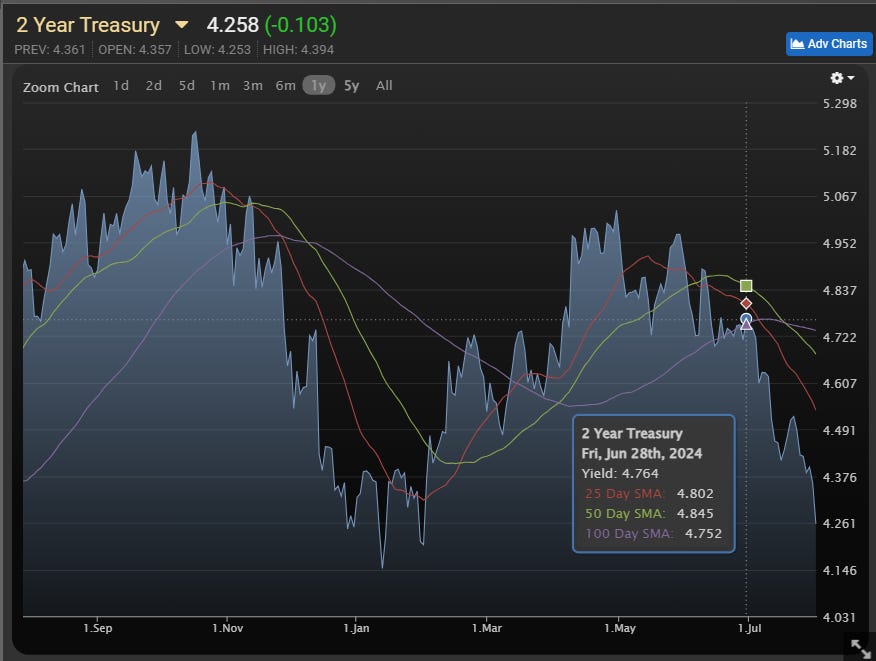
Treasury rates are around the lowest levels year-to-date.
This afternoon Jerome Powell was telling investors that a rate cut could be on the table for September if inflation continues trending down.
It’s about time. When interest rates were 0%, the debt wasn’t such a big deal. However, with much higher rates, interest expense is set to strangle the budget and leave the next generation with a legacy of debt.
That $34 trillion of debt, nope, just updated, $35 trillion of debt, was used to pay for…
Can you recall?
I’m checking my notes.
Here it is:
“A bunch of junk that wasn’t worth $35 trillion”.
Well, that’s not particularly helpful.
Using the data the government provides for forecasting (which in my experience is more likely to be optimistic than pessimistic), interest expense will grow from $240 billion in 2016 to $1,440 billion in 2033.
That is higher than an 11% compound annual growth rate in interest expense.
According to the projections, at that point, about 3.67% of GDP will go to interest expense.
That’s going to weigh on productivity.
$1.44 trillion in interest expense would exceed the total deficit from the 2009 financial collapse.
That’s not adjusted for inflation, but it provides some context for the premise of $1.44 trillion.
Despite the ongoing deficits, inflation is finally dying down.
Note: I think most people across the entire political spectrum will agree that our country got less than $35 trillion in value from the accumulated debt. We’re not going into how to fix it (just say no to political pandering), but paying out an extra trillion per year in interest expense absolutely is not part of any solution.
The charts below (from MBSLive) show the drop in Treasury yields since the end of June.
5-Year Treasuries:
2-Year Treasuries:
As interest rates fell, we also reported our best single-month gain of the year.
On the other hand, our year-to-date alpha declined slightly. A huge drop in rates can be very helpful for some of the weaker and higher-risk securities.
Our modest cash allocation (about 7.13% at the start of June) was also weighing our performance. Most of that cash is earning interest at short-term Treasury rates, but that’s still less than 0.5% for the month.
Article Starts
You can find prior installments of the Portfolio Updates on the Portfolio tab of our website.
Older editions of the Portfolio Update are unlocked for everyone. The newest release reserves the foreshadowing section for paid members.
Trade Alerts
We have a page on Substack to link all trade alert articles.
Here are The REIT Forum’s trade alerts.
Layout - Modified Order
To keep things simple for our investors, the rest of the portfolio update is divided into several segments. We run the same segments (with new content) each week.
We usually maintain the same order from month to month, but I revised the order to work better with free previews. Eventually, the order will be locked in again.
- Returns on Total Portfolio
- Sector Allocation
- Reminder About Cash
- Housekeeping
- Recently Closed Positions with Returns
- Recently Opened Positions with Returns
- All Open Positions by Sector with Returns
- Outlook
- Foreshadowing Potential Trades (paid section)
This layout maximizes transparency while keeping the foreshadowing of our potential trades within the paid section. It also loads the images together at the front, while putting the text-heavy sections together at the end.
Returns on Total Portfolio
Note: The presentation of the charts was modified slightly to enable running it through Google Sheets instead of Excel to reduce transferring data.
The chart below shows our performance since we began preparing for The REIT Forum at the start of 2016 through the end of the latest month:
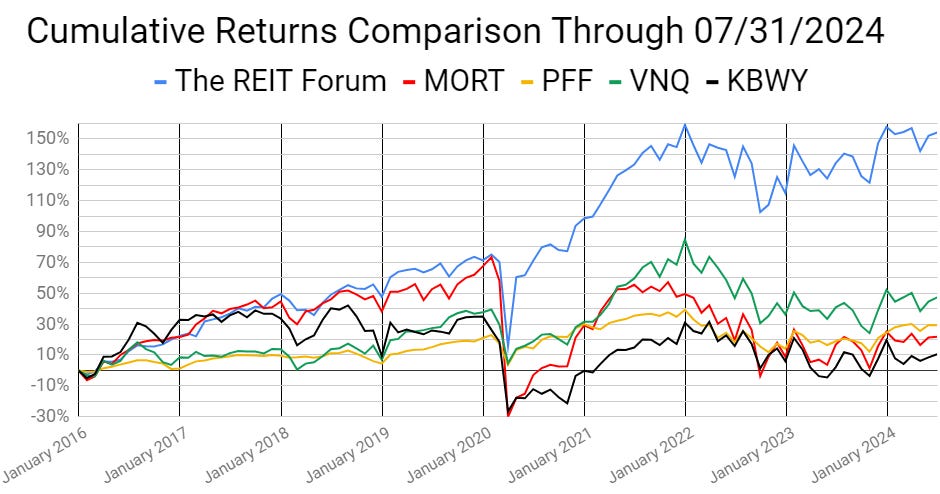
There are four major index ETFs we use for evaluating performance. They are:
- (MORT) $MORT - Major mortgage REIT ETF
- (PFF) $PFF - The largest preferred share ETF
- (VNQ) $VNQ - The largest equity REIT ETF
- (KBWY) $KBWY - The high-yield equity REIT ETF most retail investors follow
Annual comparison vs. each ETF:
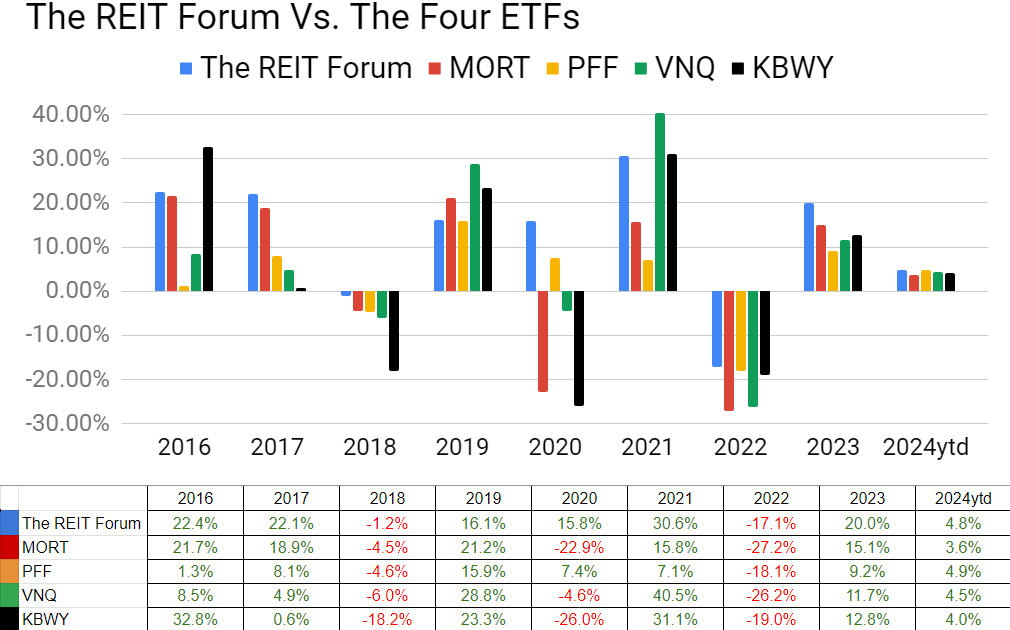
Our performance vs. the average of the ETFs:
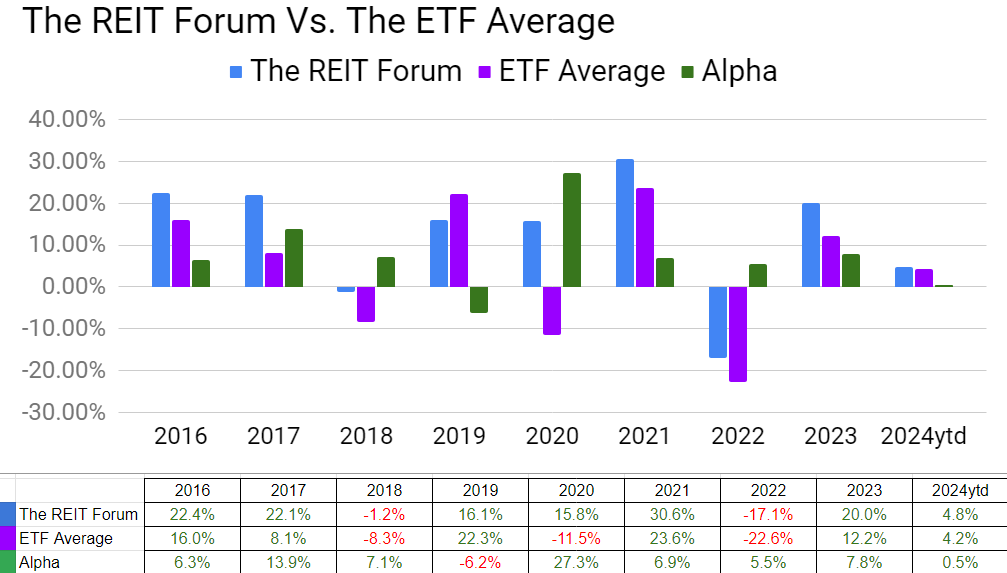
We evaluate alpha based on performance against the ETFs because it strips out the general change in our sectors.
The next chart shows the change in the value of our portfolio from month to month. We strip out the impact from contributions made during the month because, obviously, contributions are not returns.
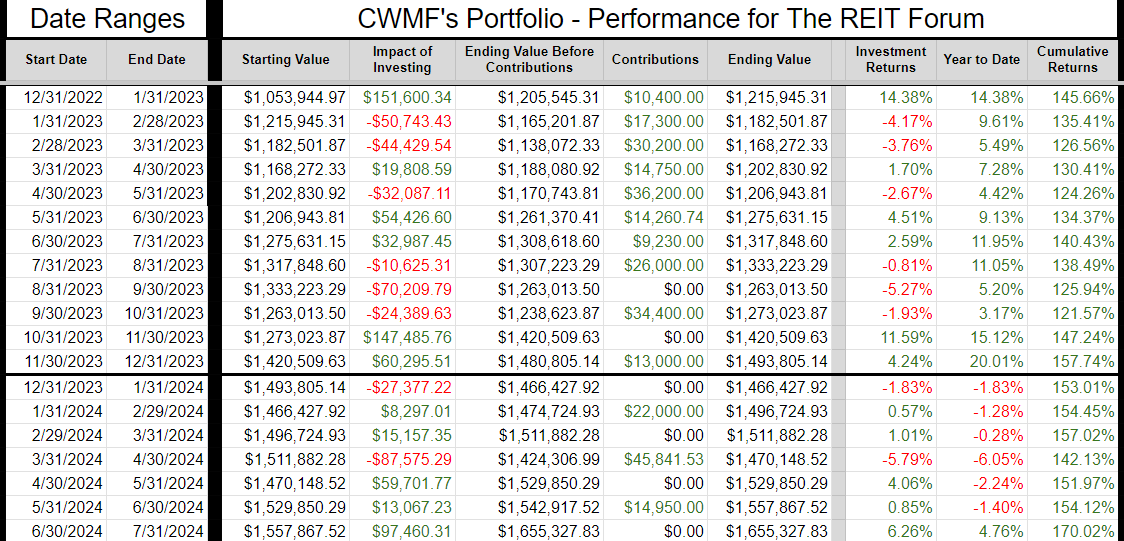
The prior year is included as well to help investors see how the calculations work.
If anyone is confused by these calculations, let me know. I believe this transparency is crucial, so I’ll include an example showing every calculation if I hear that readers have any difficulty following it.
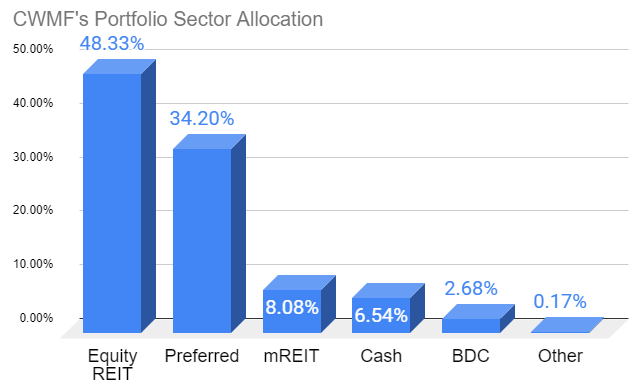
Sector Allocation Chart -
The sector allocation chart helps to explain how we are thinking about risk and seeking returns:
Reminder About Cash (repeated)
I normally keep at least 6 months or more of living expenses in “cash”. If you normally keep around $40k to $50k in “cash”, the difference between getting paid 5% and 0.2% is around $2k per year.
I’m using (SGOV), (SHV), and (BIL) as my cash substitutes. These are short-term Treasury ETFs. Prices are extremely stable. Liquidity is excellent.
I use a Schwab business account that is not part of my portfolio. The only assets it holds are actual cash and cash substitutes (those 3 ETFs).
Nearly all my expenses go through my credit card already (paid off in full each month).
I still have my checking through USAA because of the long history on those credit cards. If I need cash, I can sell Treasury ETFs and transfer the funds to my USAA account.
It takes a few days, but that’s fine.
This is a pretty nice return for cash I was going to have there anyway.
Note: Some people think you don’t need a strong credit score after getting a mortgage. I disagree. The long history on those cards is extremely useful if I want to boost someone’s credit score. If I add someone to my card, their next update will show they have a card with 20 years of perfect history.
You can get scammed this way. You are liable for the bill. They can just charge the card and walk away. This doesn’t concern me because I keep a lower limit (such as $10k) on those cards and I’m only doing it for people I trust. If one of those people betrays me, I’ll count myself lucky that I found out for only $10k. For people who can’t afford to risk that money, this would be too dangerous.
Housekeeping
We used to have a repeated section on strategy, but I wanted to shorten the update.
I’ll be posting an article that covers our strategy in greater depth and just adding a link to that post.
Recently Closed Positions with Returns
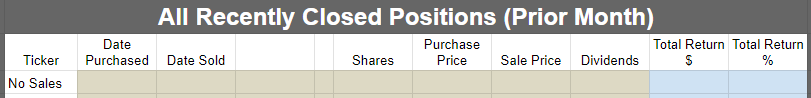
These are the positions closed during the prior calendar month. If you want to see positions that were closed before that, you can see the prior portfolio updates or use the Google Sheets.
If we didn’t close any positions for the sector during the month, then the image will be blank.
Note: By loading the Google Sheets, you can still see all of our closed positions. We only include the recently closed positions to reduce the size of the article:
Recently Opened Positions with Returns
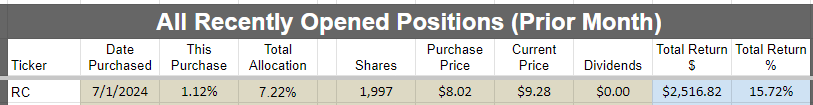
All Open Positions by Sector with Returns
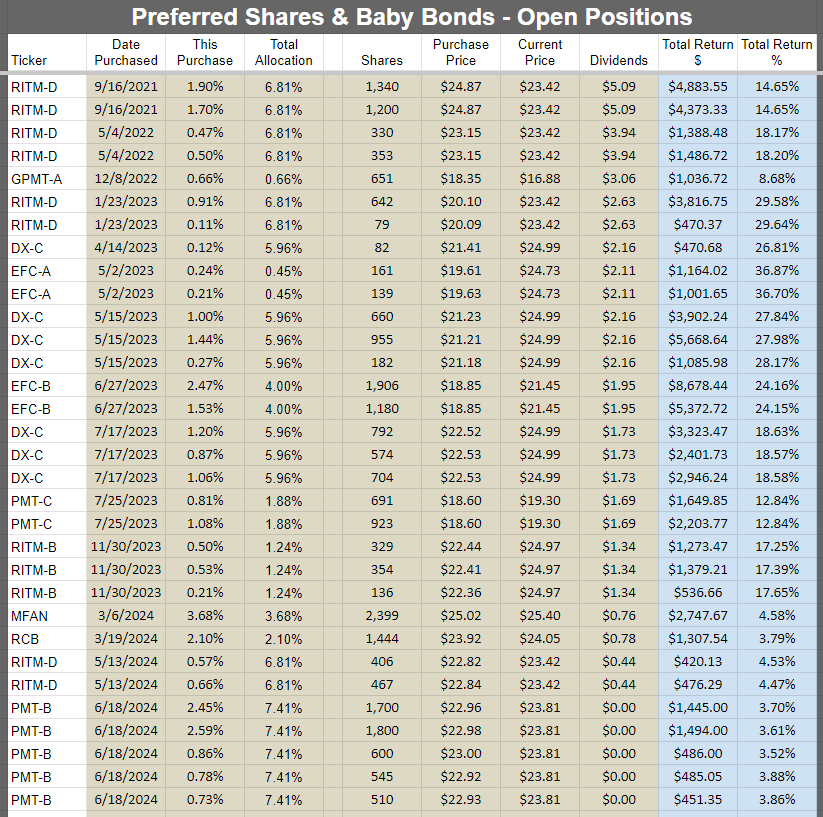
We will start with the open positions as of the end of the month. It often takes a few days to prepare this article, but the screenshots below are from the end of the prior month.
The cell with the ticker is grey if the position is in a taxable account. This was a request by a few members and there was no drawback to adding the information. All of the taxable positions are in equity REITs.
Preferred shares and baby bonds:
Equity REITs:
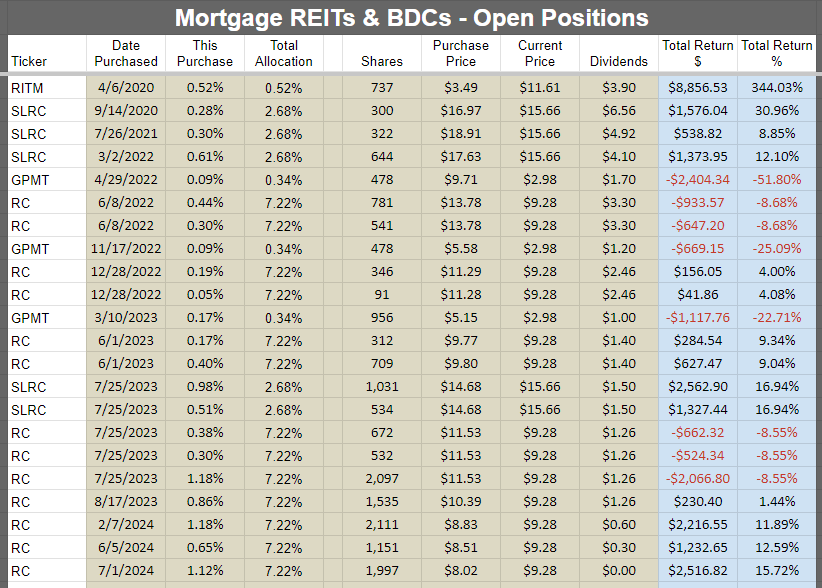
Mortgage REITs and BDCs:
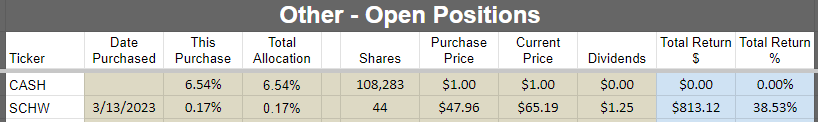
Other:
Subsequent Changes
None so far.
Outlook
The big dip in rates looks very favorable.
Foreshadowing Potential Trades
This section is usually prepared shortly before publishing. The goal is to quickly cover ideas for trades. We aim to foreshadow our trades here, though the market may move in surprising ways. While the article takes days to prepare and documents prices and performance from the end of the month, the potential trades section is written last to provide the most up-to-date pricing.
Based on the change in relative prices as of 07/31/2024 here are some of the trades on my radar.
Note: Prices are from end of day.
Paid Section Begins
At the moment, I’m most interested in looking for opportunities to play with the preferred shares and baby bonds.
There were some price swings today as we’re looking at the last day of the month. Various funds rebalancing sometimes causes a sudden surge in supply and demand. I’ve looked at the rules for adding and removing shares from an index ETF. It might seem like the share being added will soar and the share being dropped will fall. However, when I ran a test on that theory, I didn’t find a meaningful correlation. If someone modeled enough of the funds together and was able to factor in some other minor pieces (unclear which ones they are), they might be able to predict some of the swings.
That would be pretty nice.
Some of the big moves today:
- ACR-D (ACR.PR.D) up 7.32% at $23.90.
- CIM-A (CIM.PR.A) up 6.06% at $23.79.
- GPMT-A (GPMT.PR.A) up 4.2% at $16.88.
Now, you might think this because ACR-D and CIM-A are fixed rate shares. GPMT-A is fixed-to-floating, but the floating doesn’t kick in until 1/15/2027.
In each of these cases, lower rates would be quite favorable and rates were falling pretty hard today.
However, FBRT-E (FBRT.PR.E) was down 1.97%. That’s another fixed-rate share.
NYMTZ (NYMTZ) is also a fixed-rate share and it was down 0.63%.
You could blame NYMTZ’s dip on common shares of New York Mortgage Trust (NYMT) being down 1.82%. You could do that. But the worst performing mortgage REIT on the day was Chimera Investment Corporation (CIM). CIM was down 2.73% while CIM-A was up 6.06%. That’s a huge spread.
Granite Point Mortgage Trust (GPMT) and ACRES Commercial (ACR) were down 1% and 0.9% respectively.
Note: ACR is not under coverage, but the preferred shares are listed in the spreadsheet (without targets), so I’m including them in the comparison.
I’ve been interested in the occasional weakness seen in a few of the baby bonds: (RCC), (MFAN), and (MFAO).
MFAN and MFAO should be ex-dividend on 08/01/2024, so those prices should fall. If prices do decline by the ex-dividend amount, they would continue to be among the most attractive.
If the baby bond prices don’t decline (sometimes that can happen), then they would be significantly less attractive.
A difference of 2% to 3% can be material when it comes to baby bond prices.
I have been contemplating swapping my tiny position in GPMT-A for some of the lower-risk preferred shares or baby bonds.
Other Trades to Consider
I think CIM-A rallied too hard today.
CIM-A has a stripped yield of 8.52%. The upside to call value is moderate. Shares are at $23.79 and have about $.32 in dividend accrual. So you’ve got modest upside to call value, though a call is unlikely unless rates go substantially lower.
For comparison, the baby bond CIMN has a yield to maturity of about 9.28% and a yield to call of about 9.17%.
That is based on CIMN not being ex-dividend “yet”. I haven’t found confirmation of the ex-dividend date for 08/01/2024. However, the prospectus lists August 1st as a date of record for CIMN. Therefore, under T+1 settlement, the shares should be ex-dividend tomorrow morning. Pre-market trading is the same as regular market trading, so there’s no funny games to be played there.
At the time of writing, CIMN was $25.49. I modeled about $.44 in dividend accrual, so the projection would be for prices around $25.05 tomorrow morning.
I would guess that CIMN probably falls some for the ex-dividend, but I also think CIM-A will fall quite a bit simply because there wasn’t a good fundamental argument for shares to rally 6% today.
To pound home the irony, CIM-A carries an 8% coupon rate. CIMN, issued only a couple months ago, carries a 9% coupon rate.
It’s possible to have a scenario where the preferred share should have a lower yield than the baby bond. It’s also extremely rare. That situation can occur when the preferred share has a very low-fixed rate coupon.
In that situation, the upside to call value (if rates fall) has to be priced in. However, CIM-A doesn’t have that kind of upside to offset the additional risk. Therefore, I’m declaring CIMN as a better deal, adjusted for the difference in dividend accrual.
For instance, if CIMN was ex-dividend at $25.05 and CIM-A opened at $23.79, then CIMN would clearly be the better deal.
We don’t have targets on ACR-D. Regardless, I think investors who own shares should really be looking at dumping them.
High risk rating, fixed-rate share, stripped yield is only 8.29%, and upside to call value is only modest at $23.90.
Why would you want to own that? If investors can actually get out even remotely close to the $23.90 price recorded at the end of the day, that would be amazing. Getting $23.50 would be amazing. This is just wild. ACR common shares are up about 48.86% year-to-date. At $14,.32, they are still severely discounted to book value of $27.25. I did a quick check on the presentation. The common equity still appears highly leveraged. Even if the preferred shares all became common equity, the leverage would still be high. That’s a bad position for preferred shareholders, who want to see more cushion for their positions. There is absolutely no reason ACR-D should be priced as one of the lower-risk fixed-rate preferred shares. Awful risk/reward profile on ACR-D.
If ACR-D opens near $23.90, then almost anything you can buy in a brokerage account should have a better risk/reward profile.
Conclusion
Thanks for reading. I hope you find the ideas in this article helpful as you navigate the markets.
I apologize in advance for any typos. With such a large document,having at least one or two is common. If you’re reading this more than a day after publication, check the comments section for any corrections.
Member discussion