
Portfolio Update - August: A Wild Summer Already + Extra Preferred Share Commentary
One of the series we provide on our premium service is the monthly portfolio update. I shared the entire July Portfolio Update for free so readers would know what to expect in an update.
Portfolio Update Begins
- The market has been wild. Interest rates on the longer end of the curve increased, which is generally unfavorable because it implies higher rates for longer. However, credit spreads shrank as recessionary fears faded.
- Interest rates create a long-term challenge for the country because high interest rates don’t go well with a large debt accumulated over the prior decades.
- The creation of excess dollars is a big factor driving inflation. Higher rates drive even higher deficits, meaning even more dollars are being created.
- There are still plenty of opportunities on REITs that got left out of the rally. Fortunately, many of the REITs with great fundamentals fall into that category.
- Looking at preferred shares, we’ll have a moderate preference for the fixed-to-floating shares with earlier float dates. I expect those shares to generally command higher price-to-buy ratios.
The portfolio update is divided into several segments for simplicity. The recurring segments are:
- Foreshadowing Potential Trades
- Trade Alerts (links to trades)
- Returns to Date on Open Positions
- Returns on Recently Closed Positions
- Returns on Total Portfolio
- CWMF’s Portfolio Images
- Sector Allocation
- Conclusion
- Strategy (Repeated) - This explains how we invest. It helps investors understand why we place the trades we do.
Foreshadowing Potential Trades (New Section Begins)

This section is usually prepared shortly before publishing. The goal is to quickly cover ideas for trades. We aim to foreshadow our trades here, though the market may move in surprising ways. While the article takes days to prepare and documents prices and performance from the end of the month, the potential trades section is written last to provide the most up-to-date pricing.
Based on the change in relative prices as of 08/02/2023, here are some of the trades on my radar.
Housing REITs: Sun Communities (SUI), Camden Property Trust (CPT), and Mid-America Apartment Communities (MAA). Each is strong and out of favor with investors.
Does MAA create value for shareholders? Look at the chart and decide:

AFFO per share was trending higher, then surged following the pandemic. Dividends got a huge boost to try to keep up with AFFO per share. Yet shares are almost back to their pre-pandemic price. Interesting seeing as forward AFFO per share went from less than $6 to over $8. Quick question for readers. Do you believe those Sunbelt apartments are more valuable today than they were in late 2019 to early 2020? I believe they are materially more valuable. The rents are certainly much higher. Of course, the insane growth rate is probably gone. I wouldn’t expect to see another surge like that for a very long time. It’s not healthy for the economy when rents rise that rapidly.
The funny thing about an apartment REIT with minimal debt is that higher rates can enhance earnings over time. There is currently a surge in supply coming from the construction started when rates were low, but the volume of new projects getting started is plunging. This creates a “boom and bust” cycle for building. If rates remain elevated (say a 10-year rate around 4% or higher), then new permits and starts should remain low while mortgages remain out of reach for many. Both of those factors enable stronger rental growth rates. Consequently, we could see rental growth bottoming with new supply hitting the market (this will take a while), followed by a recovery as new supply dwindles.
Interest Rate Diatribe
Sure, higher Treasury yields mean investors can lock in a pretty solid fixed rate of return. That can weigh on the REITs, at least for now. If those Treasury yields remain elevated, the deficit will only get worse. We’re on the road to federal interest expense surpassing defense spending within the next decade. Not a good sign. Either way, it’s the government spending money they don’t have. One way we get the strongest military in the world and the other one we get…? We “get” suppressed inflation by raising unemployment and producing less? Gotta love producing less.
How are higher rates supposed to reduce inflation? They temporarily pull cash out of the economy.
What really drains money from the economy? A surplus.
What doesn’t cost future generations more interest expense? A surplus.
What would make higher rates a more effective tool for pulling cash out of the economy? Public savings.
We are so accustomed to public debt that the term “public savings” sounds strange.
How could a country reach public savings? Run a surplus for enough years.
While the terms “debt” and “savings” are binary, the impact isn’t binary. Bigger debts have a bigger impact. If the average rate reaches 4% on $32 trillion, it will be $1.28 trillion per year just for the interest.
That leads to more dollars existing, which is already a huge part of the problem.
Foreshadowing Potential Trades Resumed
Towers: This sector has fallen completely out of favor with the market. Carriers are also unpopular. Seems anything related to communications is currently in the dog house.
At a glance, it seems as if the cell tower REITs are suffering on the bottom line (AFFO for them) because of reduced investments in 5G. However, the real headwind for the sector in 2023 was interest expense. That’s still a headwind for American Tower (AMT) and Crown Castle International (CCI) in 2024, but year-over-year the comparison gets a bit easier. It’s a non-issue for SBA Communications (SBAC). It could even be argued as a tailwind because interest on floating-rate debt plunges as the debt is paid off throughout 2023.
Guidance for margin from “services” was reduced for CCI and AMT, though SBAC did not reduce theirs. We still anticipate carriers needing to build their 5G networks and AT&T (T) demonstrated that by signing a deal with SBAC.
I’m working on an article to demonstrate some of the differences driving recent growth rates. However, it can also demonstrate why we expect growth to continue.
Industrial: Rexford (REXR) and Terreno (TRNO) lead the list again. Those AFFO multiples can seem high, but that’s because the current AFFO is based on leases below market rates. Adjusting for market rates on leases would drive AFFO much higher. Consequently, these REITs are looking at a prolonged period of high growth rates in revenue and same-property NOI even if industrial rents stopped increasing. Given the shift towards e-commerce and the additional space e-commerce requires compared to traditional retail, it’s unlikely that industrial rents will freeze for several years. Due to the mismatch between supply growth and demand growth over the next decade, I expect rents will continue to move materially higher. Some years we will see rents rise much more than others, but over any period longer than 2 to 3 years I would expect rents to trend higher.
Foreshadowing potential BDC trades
Top choice in the sector today is still SLR Investment Corp. (SLRC). Not surprising as it’s also the share we purchased recently. Ares Capital (ARCC) also dipped into the bullish range by a hair. We’re even seeing Prospect Capital (PSEC) entering the bullish range. I’ll probably stick to lower-risk shares, but could make a small trade here. The technicals (recent weakness) are favorable, but I would really need to review each of Scott’s pieces on PSEC before touching it. As it stands, the recent weakness relative to the sector is nice but the discount to targets is small and there are quite a few shares where I can get bigger discounts at lower risk ratings.
Foreshadowing potential mortgage REIT trades:
I don’t see any coming at the moment for common shares. I took some big gains on Rithm Capital (RITM) in July and reallocated between Ready Capital (RC), SLR Investment (SLRC), and PMT-C (PMT.PC). The mortgage REIT sector has been sliding since we made our swap. I could add to our position in RC, but have a decent position already from a combination of the swap in July and some earlier purchases.
Foreshadowing potential preferred share trades:
I’ll be checking relative prices frequently. There’s plenty of opportunity for volatility here. Volatility is generally seen as bad, but it can be great when similar shares change prices at different times. We look for those opportunities to swap between shares and enhance returns. This is certainly an area I could be active in. Based on the way interest rates have been moving lately, I’ll probably have a preference for fixed-to-floating shares with earlier reset dates. I’ll still consider others, but if discounts to targets are roughly similar (say within about 2%), then I’ll be more likely to pick a share that floats sooner. That’s not a hard rule, just rough guidance for how I’m looking at things today.
For instance:
- RITM-A (RITM.PA) is $22.50 (92.2% of target). Floats 8/15/2024.
- RITM-B (RITM.PB) is $22.06 (92.0% of target). Floats 8/15/2024.
- RITM-C (RITM.PC) is $19.84 (90.1% of target). Floats 2/15/2025.
RITM-C has the bigger discount, but the later floating date. That makes this pretty comparable. Over the last several the months the market tended to overvalue RITM-A and RITM-B relative to RITM-C. In prior periods, we sometimes so it go in the opposite direction. However, I would lean towards RITM-A and RITM-B here because of the earlier floating date. In many cases, the earlier floating date appears to be overvalued by the market. It’s nice to be in the share before it becomes overvalued relative to a peer because that creates an opportunity to swap out of it at a more favorable exchange ratio. We’ve seen that with the AGNC preferred shares. Simply look at AGNCN (AGNCN), AGNCM (AGNCM), AGNCO (AGNCO), and AGNCP (AGNCP).
That order is both “from earliest floating date to latest floating date” and “from smallest discount to targets to largest discount to targets”.
However, the market isn’t always choosing to favor the share that floats sooner. CIM-C (CIM.PC) takes longer to float than CIM-B (CIM.PB) and CIM-D (CIM.PD). The gap is 1.5 years. Yet the market has been picking CIM-C:
- CIM-B at $21.46 is 86.3% of our target
- CIM-C at $19.58 is 87.9% of our target
- CIM-D at $21.15 is 87.1% of our target.
In this case, CIM-B and CIM-D are clearly superior to CIM-C. They float 1.5 years sooner (better for sentiment) and they have a bigger discount to targets (better for fundamentals).
Other preferred share ideas:
Swap from NLY-G (NLY.PG) into NLY-I (NLY.PI). The gap in valuations is unusually large.

That chart makes it pretty clear that NLY-I is a better deal than NLY-G.
Say someone had two accounts with $25,000 each. One account buys 1,000 NLY-I and the other buys NLY-G.
Which account has a higher cash balance left? NLY-I.
Which account has a higher cash balance in August 2024 while NLY-I is building up to the first floating rate dividend? NLY-I.
Which account has a higher cash balance at every possible measuring date so long as there is no call? NLY-I.
What if there is a call? If both shares are called after NLY-I begins floating, the account with more cash is NLY-I.
What if only NLY-I gets called? The annualized yield to call on NLY-I is over 15%. Not something to complain about.
So I’m making the call. NLY-I at $23.34 is a materially better investment than NLY-G at $24.91.
If you still want to see a big dividend yield number today, NLY-F (NLY.PF) is $25.00. It’s only $.09 more than NLY-G. The difference in floating spreads contributes an extra $.20525 to NLY-F (compared to NLY-G) each year. It only takes 2 quarterly dividends for NLY-F to recover the larger premium vs NLY-G. We’ve already accrued a large chunk of the first dividend.
Out of the 3 shares, NLY-I is the best deal (only modestly ahead of NLY-F); NLY-G is the worst deal by a significant margin.
Foreshadowing potential baby bond trades:
A month ago, we mentioned looking to open a position in RCA. We did that in July. We’re just holding the shares to maturity. We should see cash show up in our account soon.
Trade Alerts
Below you’ll see links to our trades from the month:
- 7/03/2023: Trade Alert: PMT-C (before launching service)
- 7/10/2023: Trade Alert: DX
- 7/17/2023: Trade Alert: AGNCP, DX-C
- 7/18/2023: Trade Alert: SBAC
- 7/24/2023: Trade Alert: RCA
- 7/25/2023: Trade Alert: RITM, RC, SLRC, PMT-C
Returns to Date on Open Positions
We will start with the open positions as of the end of the month. It often takes a few days to prepare this article, but the screenshots below are from the end of the prior month.
The cell with the ticker is grey if the position is in a taxable account. This was a request by a few members and there was no drawback to adding the information. All of those positions are in equity REITs.
Positions closed between the end of the month and publication (if any) have the ticker highlighted in orange.
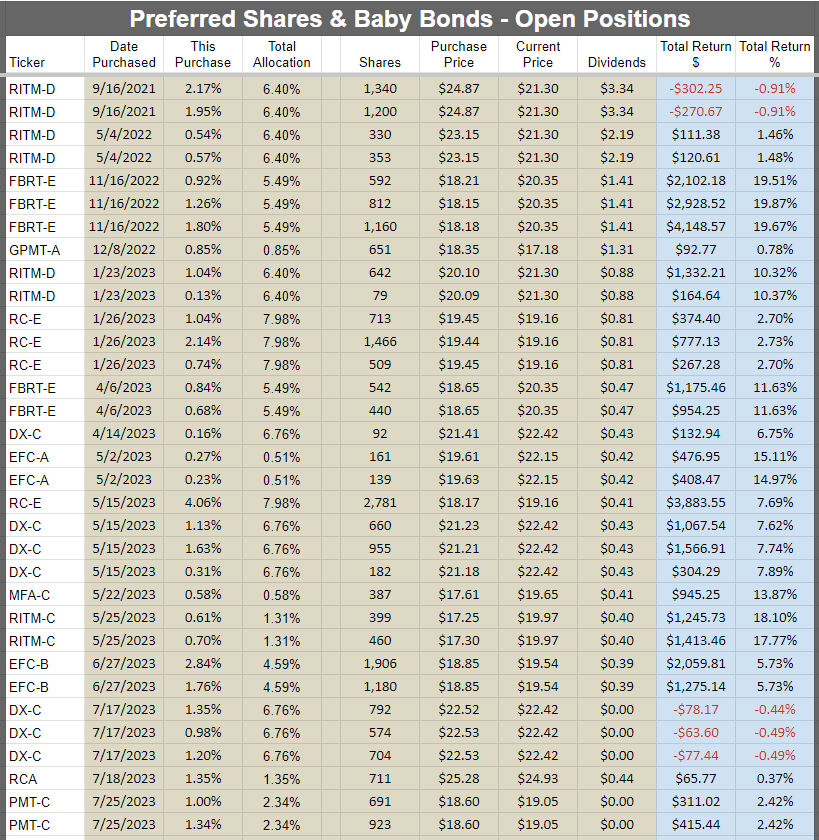
Preferred shares and baby bonds:
Equity REITs:

Mortgage REITs and BDCs:

Other:

Returns on Recently Closed Positions
These are the positions closed since the last portfolio update. If you want to see positions that were closed before that, you can see the prior portfolio updates or use the REIT Forum Google Sheets. If we didn’t close any positions for the sector during the month, then the image will be blank. Note: By loading the Google Sheets, you can still see all of our closed positions. To reduce the size of the huge article, we’re only highlighting the recent changes.
Preferred shares and baby bonds:
Equity REITs:

Mortgage REITs and BDCs:

Other:

Total Portfolio Returns
Our performance since we began preparing for The REIT Forum at the start of 2016 is shown below and runs through the end of the latest month:
Here are our results through 07/31/2023:

We thoroughly beat the four major indexes covering our types of assets:
- MORT - Major mortgage REIT ETF
- PFF - The largest preferred share ETF
- VNQ - The largest equity REIT ETF
- KBWY - The high-yield equity REIT ETF most retail investors follow
Annual comparison vs. each ETF:

We’re still ahead of all four of the index ETFs we track. That’s great.

We rallied in July, but not as much as the ETFs for our sectors. That cut into our alpha year-to-date. What played into that? Probably the decline in towers while many other stocks were going higher.
The next chart shows the change in the value of our portfolio from month to month. We strip out the impact from contributions made during the month because obviously, contributions are not returns.

The prior year is included as well to help investors see how the calculations work. You can always access this tab, with our entire record, in the REIT Forum Google Sheets. It is called “Returns Chart” and it is the tab all the way to the right.
CWMF’s Portfolio Images
You can access this spreadsheet at any point by clicking the link labeled “CWMF’s Portfolio” under “Investing Resources''. These images use the data from the end of the month.
Preferred shares and baby bonds:

Equity REITs:

Mortgage REITs and BDCs:

Other:

Sector Allocation Chart
The sector allocation chart helps to explain how we are thinking about risk and seeking returns:

Conclusion
Several good equity REITs for long-term investors. For higher yields, consider baby bonds or preferred shares. Regarding preferred shares, I will prefer picking shares that will start floating sooner (all else equal).
Just looking for the bumps we tend to see as the floating rate approaches. However, that earlier floating date needs to be supported by fundamentals (as shown in our targets) and I’d like to see some favorable technical factors (underperforming similar shares or recent strength in common shares).
Since the start of June, we’ve seen two things that shouldn’t go together. We saw rates ripping higher (despite year-over-year inflation falling as monthly values remained low). Despite higher rates, we saw investors bidding up shares of the REITs in KBWY. The ETF is focused on picking by dividend yield, which leads to picking REITs with less dividend sustainability. Many have more debt and lower-quality properties. That combination during a period of increasing interest rates leads to increasing interest expense and declining AFFO. Higher rates can increase interest expense for any company with debt, but those with longer debt maturities and less total debt will be less exposed. I have a preference for REITs that are less exposed to the headwinds. Ideally, they would also be priced as if they are facing dramatic headwinds.
I’m feeling good about the opportunities we’re seeing now. I’ve often said that the ideal recovery is one where some positions rally before others. We want to have opportunities to buy new positions and opportunities to swap between positions. Those are favorable long term, even though it doesn’t always seem favorable in the short term.
Strategy (Repeated)
For new subscribers, we should emphasize that we often treat our positions differently. We have those we consider as being primarily “Trading” positions and those where we prefer to “Buy and Hold”. A simple way to remember it is that anything with a high risk rating is probably going to be a trading position. Most of those high-risk positions are mortgage REITs and BDCs. These are two very challenging sectors where most investors (and “analysts”) simply don’t get it. Analysts who can’t predict the changes in book value for mortgage REITs or NAV for BDCs aren’t in a position to trade them. Analysts who don’t know how to evaluate the probability for dividend cuts (or raises) are in a weaker position for trading them. We have access to a great analyst (Scott Kennedy) who delivers exceptional estimates and price targets. If we only bought and never sold, we couldn’t reallocate to take advantage of the next disparity in valuations.
When we switch over to equity REITs, we usually have a long time horizon for investments. We’re thinking more about growth in AFFO per share and the long-run outlook for the sector. Consequently, we will pick REITs with lower risk ratings. The risk rating on an equity REIT correlates heavily with how much debt the REIT is using. That isn’t the only factor, but the correlation is strong. When debt levels are high, that alone can be a sufficient reason to assign a higher risk rating. Consequently, you’ll see us trading equity REIT positions far less actively. We will mostly wait for opportunities to buy a great REIT at an attractive price. We simply don’t want the mediocre equity REIT, not even at a low price. It doesn’t fit our strategy.
Preferred shares can be used in either way. However, you’ll often see our positions listing a “short” holding period. That’s because we frequently swap between different preferred shares that are at least roughly similar. For instance, we might sell NLY-F to buy NLY-I, then sell NLY-I to buy AGNCO, then sell AGNCO to buy NLY-F again. Why would we do that? They each have a risk rating of 1, trade at roughly similar prices, and will carry similar spreads when they begin floating. So what are we doing? We’re taking advantage of a change in the relative prices. By the time we’re back to the initial share, we are able to have more of them. If each time we traded between those shares we ended up with a 1% increase in the share count, we could end up with 3% more shares of NLY-F at the end of that trade than at the start. That leads to faster growth in the total portfolio. It appears that we’re selling the preferred shares quite often, but frequently it is just a change between two similar shares. We do this when we’ve found the spread in prices is large enough to let us exit one position and enter the next.
This may be different from the methods you’ve seen employed by other analysts. You may have joined us because you became tired of mediocre results. Our better results have been a function of our unique strategy.
Member discussion