
Portfolio Update - April: Mild March Meets Wild April
March was nothing compared to what we’ve seen in the first few weeks of April.
Our alpha (our performance minus ETF average for our sectors) year-to-date looked good through the first two months.
This was the year-to-date alpha when measured on a few dates.
- End of February: 3.16%
- End of March: 1.35%
- So far in April (as of 4/22/2024): 1.42%
With the drop in early April, I’m a bit surprised we aren’t further ahead. Our positioning is a bit more defensive.
On the other hand, some of our equity REIT picks have seen prices react more to changes in interest rates.
Article Starts
You can find prior installments of the Portfolio Updates on the Portfolio tab of our website.
Older editions of the Portfolio Update are unlocked for everyone. The newest release reserves the foreshadowing section for paid members.
Trade Alerts
We have a page on Substack to link all trade alert articles.
Here are The REIT Forum’s trade alerts.
Layout - Modified Order
To keep things simple for our investors, the portfolio update is divided into several segments. We run the same segments (with new content) each week.
We usually maintain the same order from month to month, but I revised the order to work better with free previews. Eventually, the order will be locked in again.
- Returns on Total Portfolio
- Sector Allocation
- Reminder About Cash
- Housekeeping
- Recently Closed Positions with Returns
- Recently Opened Positions with Returns
- All Open Positions by Sector with Returns
- Outlook
- Foreshadowing Potential Trades (paid section)
This layout maximizes transparency while keeping the foreshadowing of our potential trades within the paid section. It also loads the images together at the front, while putting the text-heavy sections together at the end.
Returns on Total Portfolio
Note: The presentation of the charts was modified slightly to enable running it through Google Sheets instead of Excel to reduce transferring data.
The chart below shows our performance since we began preparing for The REIT Forum at the start of 2016 through the end of the latest month:
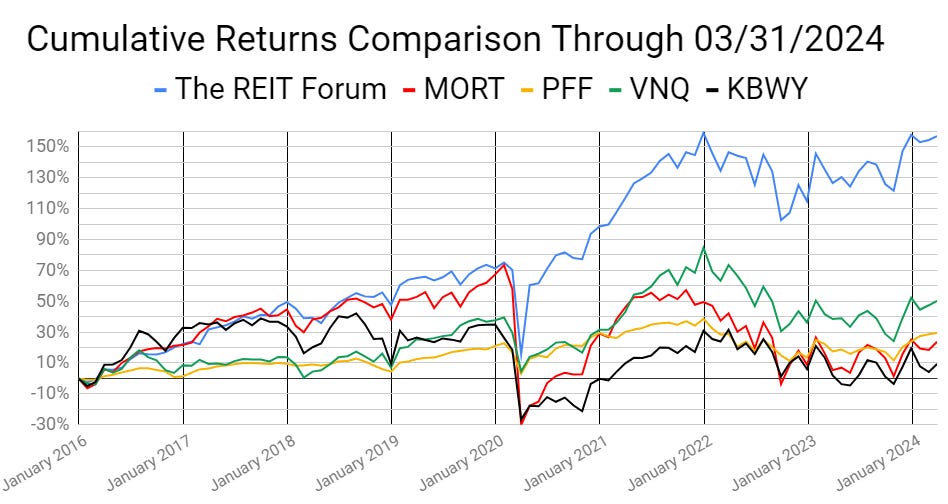
There are four major index ETFs we use for evaluating performance. They are:
- (MORT) $MORT - Major mortgage REIT ETF
- (PFF) $PFF - The largest preferred share ETF
- (VNQ) $VNQ - The largest equity REIT ETF
- (KBWY) $KBWY - The high-yield equity REIT ETF most retail investors follow
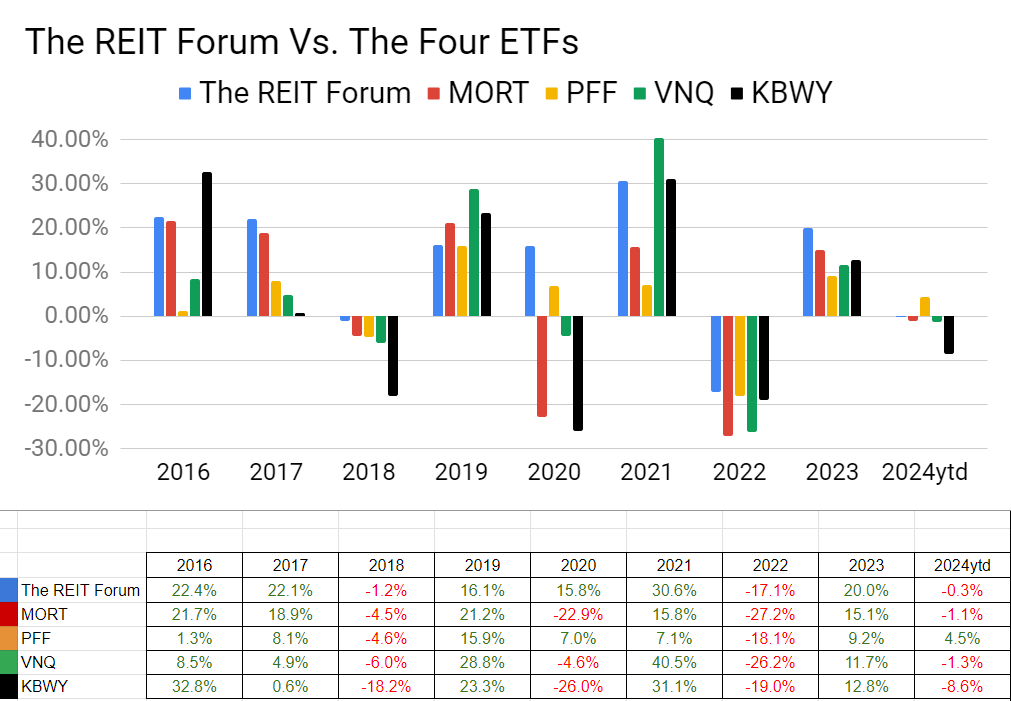
Annual comparison vs. each ETF:
Our performance vs. the average of the ETFs:
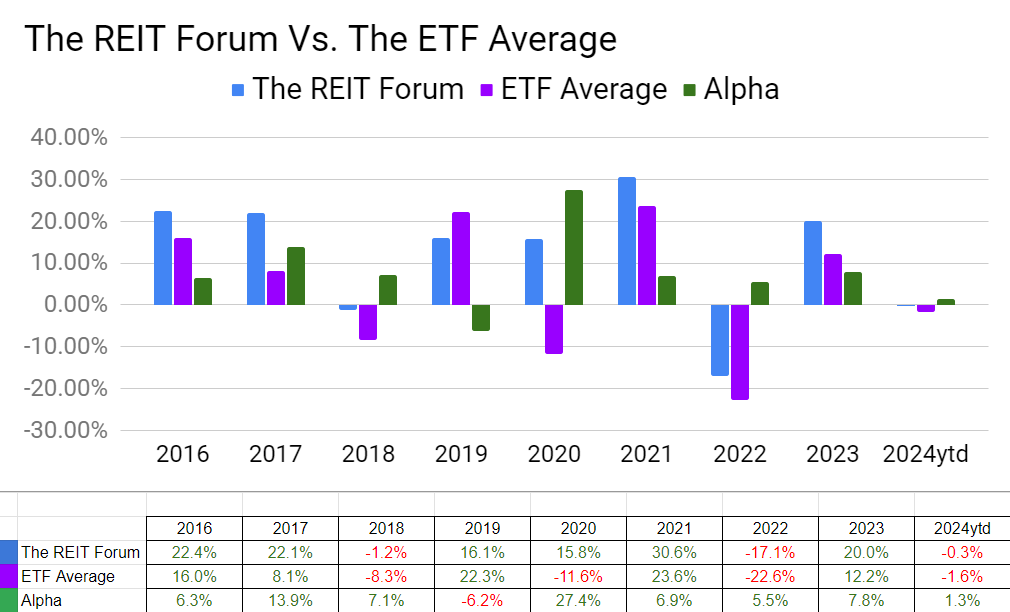
We evaluate alpha based on performance against the ETFs because it strips out the general change in our sectors.
The next chart shows the change in the value of our portfolio from month to month. We strip out the impact from contributions made during the month because, obviously, contributions are not returns.
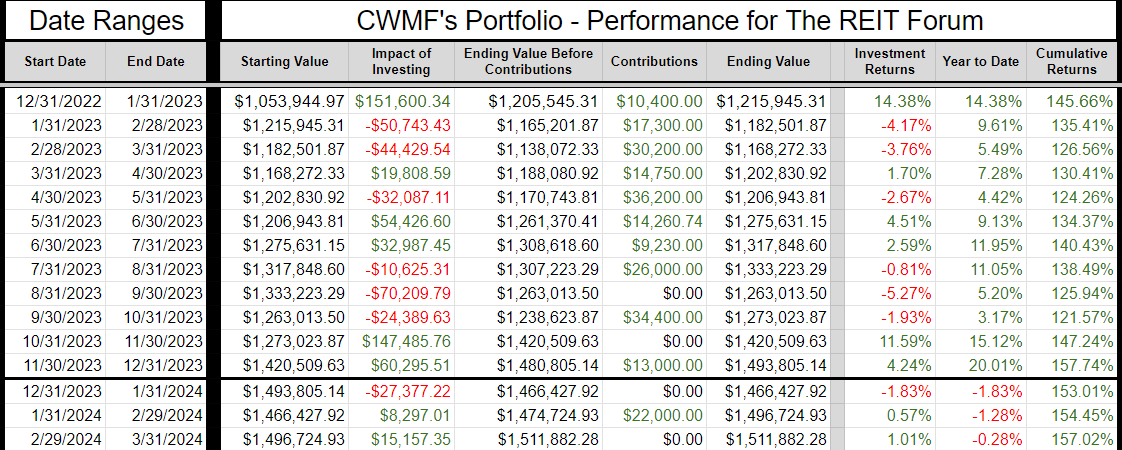
The prior year is included as well to help investors see how the calculations work.
If anyone is confused by these calculations, let me know. I believe this transparency is crucial, so I’ll include an example showing every calculation if I hear that readers have any difficulty following it.
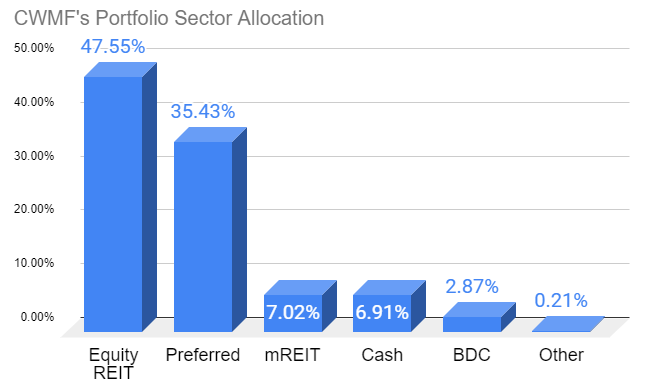
Sector Allocation Chart
The sector allocation chart helps to explain how we are thinking about risk and seeking returns:
Reminder About Cash (repeated)
I normally keep at least 6 months or more of living expenses in “cash”. If you normally keep around $40k to $50k in “cash”, the difference between getting paid 5% and 0.2% is around $2k per year.
I’m using (SGOV), (SHV), and (BIL) as my cash substitutes. These are short-term Treasury ETFs. Prices are extremely stable. Liquidity is excellent.
I use a Schwab business account that is not part of my portfolio. The only assets it holds are actual cash and cash substitutes (those 3 ETFs).
Nearly all my expenses go through my credit card already (paid off in full each month).
I still have my checking through USAA because of the long history on those credit cards. If I need cash, I can sell Treasury ETFs and transfer the funds to my USAA account.
It takes a few days, but that’s fine.
This is a pretty nice return for cash I was going to have there anyway.
Note: Some people think you don’t need a strong credit score after getting a mortgage. I disagree. The long history on those cards is extremely useful if I want to boost someone’s credit score. If I add someone to my card, their next update will show they have a card with 20 years of perfect history.
You can get scammed this way. You are liable for the bill. They can just charge the card and walk away. This doesn’t concern me because I keep a lower limit (such as $10k) on those cards and I’m only doing it for people I trust. If one of those people betrays me, I’ll count myself lucky that I found out for only $10k. For people who can’t afford to risk that money, this would be too dangerous.
Housekeeping
We used to have a repeated section on strategy, but I wanted to shorten the update.
I’ll be posting an article that covers our strategy in greater depth and just adding a link to that post.
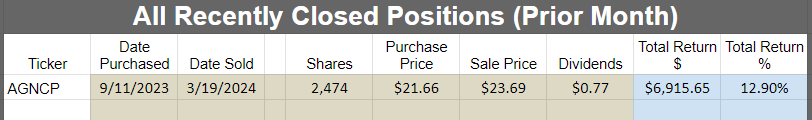
Recently Closed Positions with Returns
These are the positions closed during the prior calendar month. If you want to see positions that were closed before that, you can see the prior portfolio updates or use the Google Sheets.
If we didn’t close any positions for the sector during the month, then the image will be blank.
Note: By loading the Google Sheets, you can still see all of our closed positions. We only include the recently closed positions to reduce the size of the article:
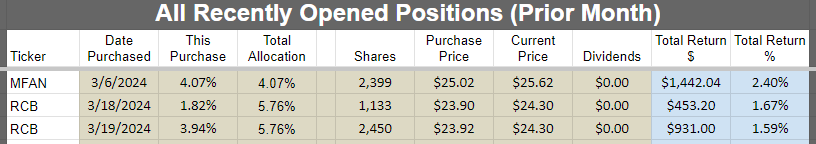
Recently Opened Positions with Returns
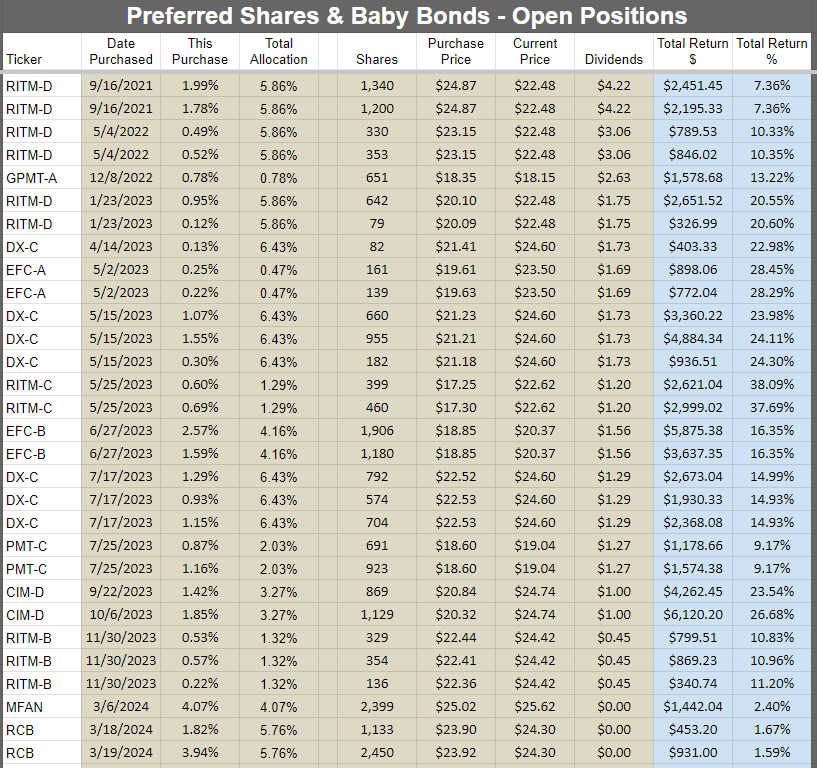
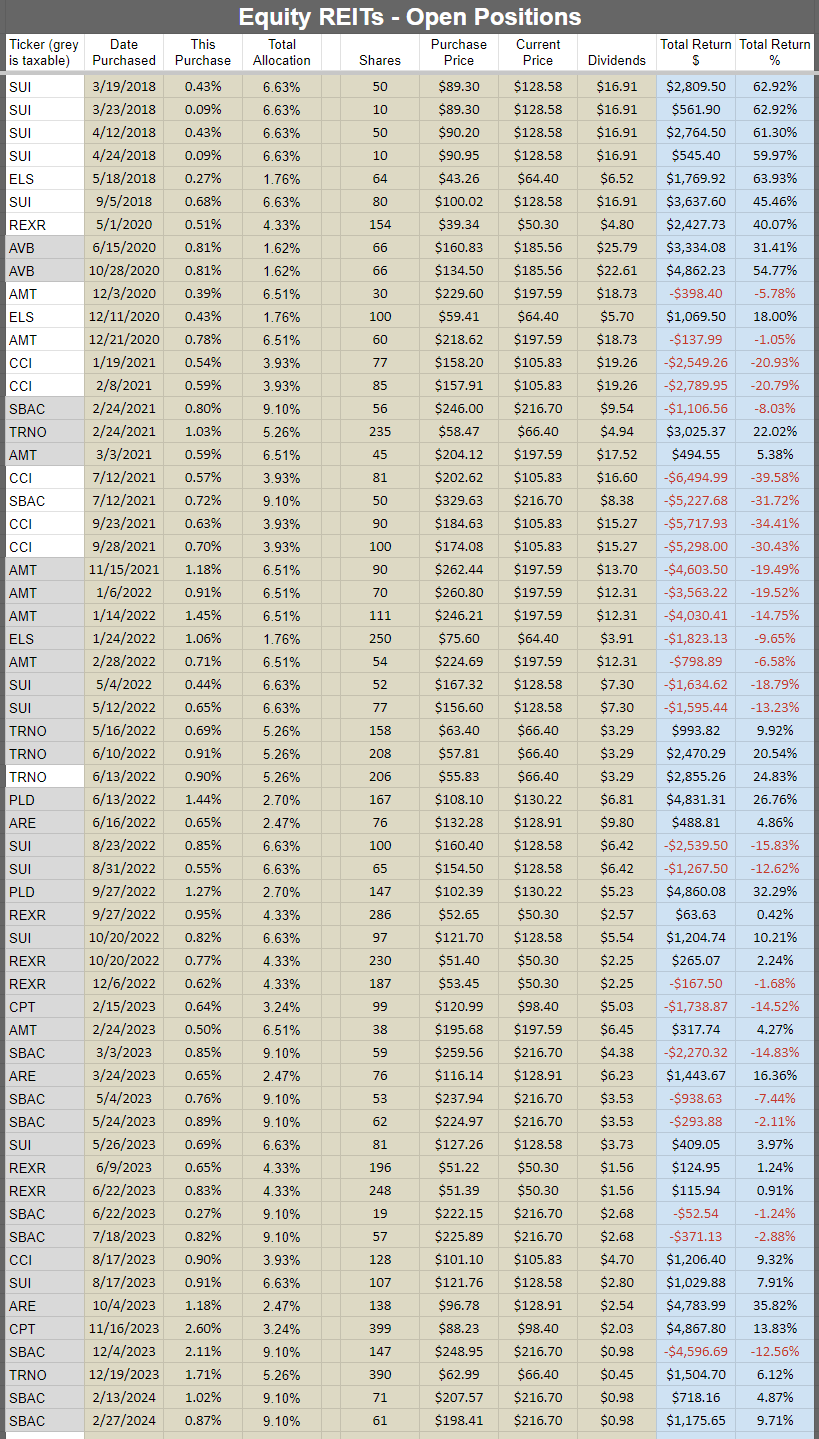
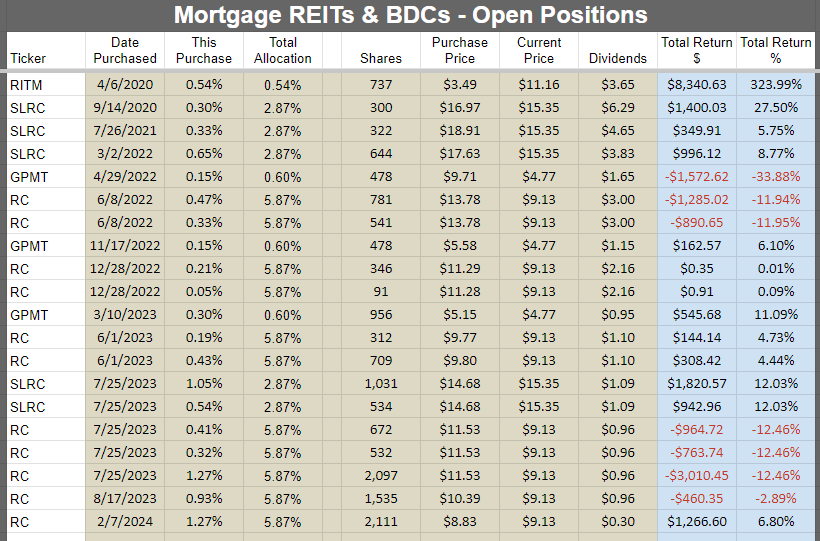
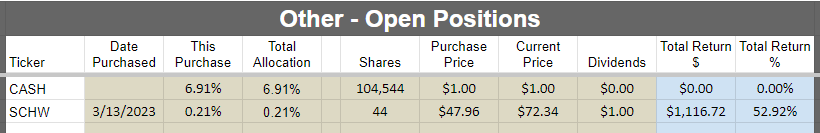
All Open Positions by Sector with Returns
We will start with the open positions as of the end of the month. It often takes a few days to prepare this article, but the screenshots below are from the end of the prior month.
The cell with the ticker is grey if the position is in a taxable account. This was a request by a few members and there was no drawback to adding the information. All of those positions are in equity REITs.
Preferred shares and baby bonds:
Equity REITs:
Mortgage REITs and BDCs:
Other:
Subsequent Changes
I purchased another 144 shares of Prologis (PLD) on April 18th, 2024.
That was my only trade so far this month.
Outlook
Yet another month of caution, but as of mid April we’re starting to get more opportunities popping up. The surge in interest rates had a pretty significant negative impact on prices.
It would be nice to see that surge slowing down, but it creates a compelling long-term situation.
The government keeps printing money to pay interest, so the amount of money is going up. That leads to weaker dollars.
In the short-term, the higher interest rates strengthen dollars (international flows) and weaken consumer demand (poor people can’t afford things).
In the long-term, it means a bigger national debt and devaluation of the dollar.
The higher rates also reduce new construction in real estate, which leads to less supply.
Due to less new supply of real estate meeting a greater amount of dollars, the long-term trend should clearly go higher.
Of course, we don’t expect to be perfectly timing the bottoms. We simply put capital to work in attractive opportunities and wait for the thesis to play out.
My favorite part about volatility is when it leads to similar preferred shares trading at materially different prices. The risk/reward profile on exploiting those opportunities is excellent.
Foreshadowing Potential Trades
This image will get more epic each month. This is level 5:

Note on target updates:
- Target updates are a constant process. Swings in interest rates, positive or negative developments, and new research can all push targets higher or lower.
- Preferred share targets update daily for dividend accrual and drop on ex-dividend dates. We also adjust targets for swings in interest rates and risk levels.
This section is usually prepared shortly before publishing. The goal is to quickly cover ideas for trades. We aim to foreshadow our trades here, though the market may move in surprising ways. While the article takes days to prepare and documents prices and performance from the end of the month, the potential trades section is written last to provide the most up-to-date pricing.
Based on the change in relative prices as of 04/22/2024 here are some of the trades on my radar.
Foreshadowing potential equity REIT trades
Industrial:
This has been pretty wild recently. I started on this section on 4/17/2024, but the industrial REIT reports for Q1 2024 were coming in and I had to pause this section and start over. I was looking at Rexford (REXR) , but then Prologis (PLD) underperformed by a significant margin. I responded by buying PLD instead.
The difference in the discounts to our targets for the sector shrank quite a bit over the last week or so due to the gap in performance. I covered this quite a bit last week, so I won’t reiterate it all here.
Our total position in PLD is still only about 3.31%.. I’m comfortable with quite a bit more than that. Weakness in the share price could be an opportunity to increase the position again.
I continue to like the long-term outlook for industrial real estate as the shift to e-commerce creates a long-term tailwind for the sector. Since e-commerce stores product within the warehouse until sold (rather than in retail locations), e-commerce requires far more industrial space per dollar of sales. That’s great for industrial landlords, because each year the market needs more industrial space.
Housing:
I’ve been looking at Mid-America Apartment Communities (MAA) as a long-term play. The hard part about MAA is they seem to have a hard time going on sale without something else getting beat up worse.
Still expecting a challenging landscape lasting at least into 2025. Not rushing to buy, but certainly interested. Shares are around $127.27, which is 16.1x consensus AFFO of $5.88.
Towers: Our position in the tower REITs is pretty big. I’m not ruling out an increase though. Shares have been beat up hard over the last couple of years and especially so far in 2024. When rates eventually drop, it could push prices significantly higher. Interest rates are a big part of the story here because it can impact the REITs refinancing and it can impact the carriers. Revenue growth is strongly related to the carriers deploying new equipment.
Other: Alexandria (ARE) earnings for Q1 2024 should be today after the market closes. The strong balance sheet is helping to protect them from higher rates, but higher rates can still weigh on sentiment. I’ll provide an update after earnings. Might be this afternoon. Might be tomorrow.
Foreshadowing potential BDC trades
Probably not placing any trades.
Foreshadowing potential mortgage REIT trades:
Check the weekly updates. There are quite a few things in our target ranges. If Scott opens or increases a position I may follow him in. I would still prefer to be playing with the agency mortgage REITs over the hybrid mortgage REITs. But the market refuses to put the agency mortgage REITs at significant discounts. Well, it refuses to put the better ones at significant discounts to book value. The ones that do trade at lower price-to-book ratios are ones we already identified as mortgage REITs that should trade at lower ratios.
Foreshadowing potential preferred share or baby bond trades:
I may be active in this space. I would like to get some trades in. Liquidity can make it more difficult, but the weaker liquidity is also part of the reason we can find some of these opportunities. It’s an abundance of buyers or an abundance of sellers pushing the market in a way that creates an opportunity for us.
I would encourage members to use the spreadsheets as a tool here. Until we see the momentum in Treasury yields die down, I’ll probably be focused more on fixed-to-floating shares (preferably with an upcoming float date) and baby bonds over fixed-rate shares.
There may be a few minor target adjustments for fixed-to-floating shares:
- Shares that are very close to floating may see slight increases.
- Shares with longer to wait may see slight decreases.
- Performance of common shares may also have a small impact as it signals market appetite for that company.
Conclusion
Thanks for reading. I hope you find the ideas in this article helpful as you navigate the markets.
I’m keeping it a bit brief because we’ve got several other articles to prioritize.
Member discussion