
PLD: Prologis Raises Almost Everything But The Price + REXR Preview
Summary
- PLD’s Q1 results were legitimately good. To find any fault, we have to turn the earnings call. Even then, we have to be pretty picky to find fault.
- Guidance on major earnings metrics increased slightly.
- The second-highest same-property NOI for PLD’s history was outshined by record leasing spreads.
- Outlook for market rent growth in the second half cools by about 1%. Southern California still facing pressure from labor disruptions.
- See the end for REXR preview.
Prologis (PLD) is in a strange week. The raw numbers in the earnings report were positive. Shares rallied premarket. As soon as the market opened, shares plunged. Why? Probably due to concerns with data from the earnings call.
The REIT Forum is a reader-supported publication. To receive new posts and support my work, consider becoming a free or paid subscriber.
Core FFO Guidance
First, we’re looking at fundamentals. They were strong:
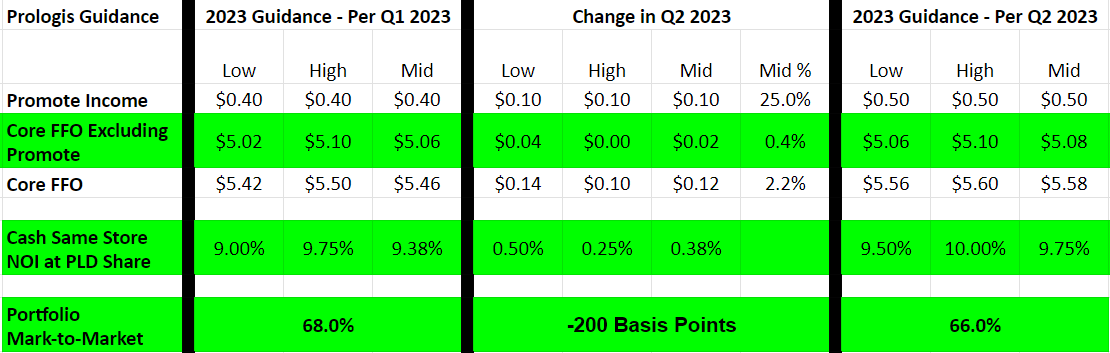
Headlines focused on Core FFO, but we want to exclude the “Promote” income. Therefore, guidance was up 0.4% rather than 2.2%. Still good, but a smaller gain.
The midpoint of guidance at $5.08 would represent 10.2% growth in “Core FFO Excluding Promote” per share. That’s great for a year where:
- Interest rates ripped higher (only modest floating-rate debt).
- New supply (industrial real estate) is projected to be unusually high.
Consensus estimates will need to increase since the consensus estimates include promote income. However, the same increase in Core FFO guidance would’ve been more powerful if it was $.02 from promote income and $.10 from other factors.
Note: Promote income is still useful. It’s still profit for us as shareholders. It just doesn’t offer the same reliability as adding rent.
Mark-to-Market
PLD estimates market rents increased by 1.5% in the quarter, while their leasing drove in-place rents up by about 2.5% across the total portfolio. That is not for the year. That was a single quarter.
Market Rent Growth
PLD provides some commentary forecasting how much they think market rents will change during the year, based on projected supply and demand. Unfortunately, this comes through the earnings call so the presentation can change or be skipped in some quarters. The projected rent growth came down slightly.
Q1 2023 earnings call: Projected 10% for the United States and 9% globally.
Q2 2023 earnings call: Projected 7% to 9% globally (8% midpoint).
For the first half of 2023, overall market rent growth has been about 5%.
Mark-to-Market
Quick formula: Market Rent = Market Rent / In Place Leases - 1
Example: $166 / $100 -1 = 66%.
This is used to approximate how much the average lease for the portfolio needs to increase for the entire portfolio to be at market rents.
Based on management’s expectations for market rent growth and for leasing during 2023, In the Q1 2023 call, PLD projected mark-to-market would end 2023 around 70%. Consequently, the portfolio mark-to-market slipping from 68% to 66% can be viewed negatively, even though market rents increased another 1.5% and PLD recorded all-time leasing spreads.
Remember that those all-time leasing spreads drove rents higher. That increases the denominator, so the remaining mark-to-market is lower.
Therefore, we have positive news on leasing and slightly negative news on projected rent growth.
Net Operating Income Guidance
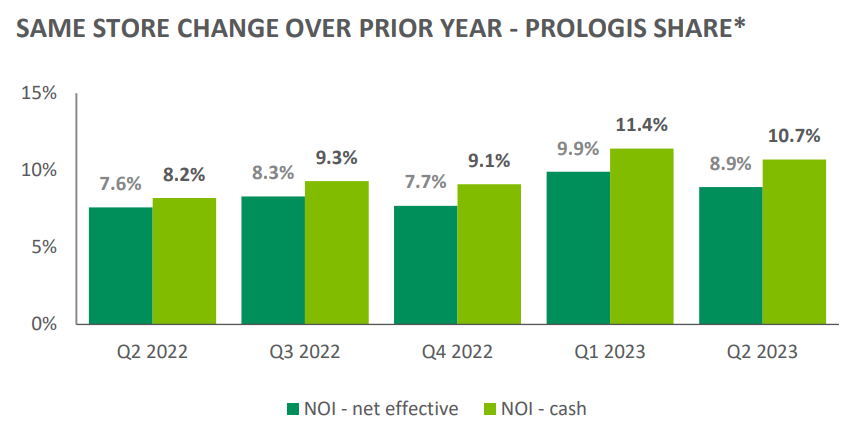
Cash same-store NOI guidance was up another 38 basis points. That’s great and it comes on the back of PLD delivering 10.7% in the quarter. I did some quick math and I think PLD will probably land slightly above the midpoint of their range (over 9.75%, under 10%).
I compared the full-year guidance as of each quarter with the results through that period. That allows us to determine the implied guidance for the rest of the year:
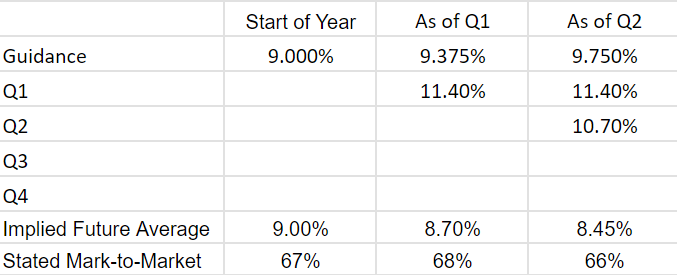
Despite increasing guidance, the implied future average is going down. The tricky part about this is the way leases work. PLD just established record leasing spreads in back-to-back quarters. Thanks to those higher leases, same-store NOI should see a nice boost from those properties.
However, the higher leases are weighed against a dip in occupancy:
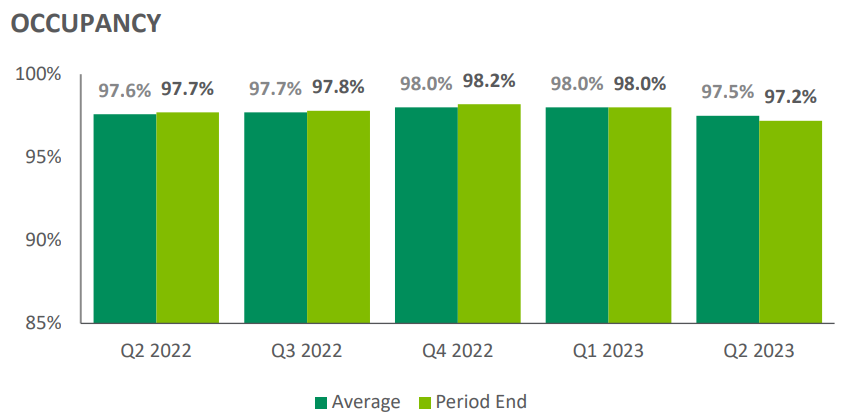
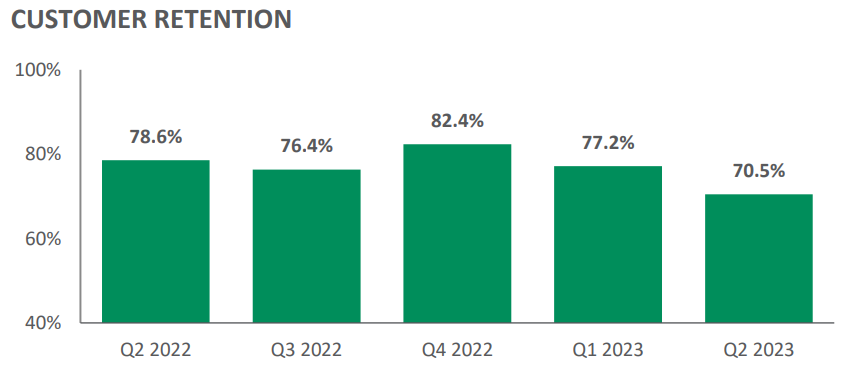
That dip comes as retention slipped:
That dip could be related to PLD choosing to push rental rates harder during the quarter.
Leasing Spreads By Quarter
As we previewed during the most recent industrial update, PLD was setting new records for leasing spreads in the quarter.
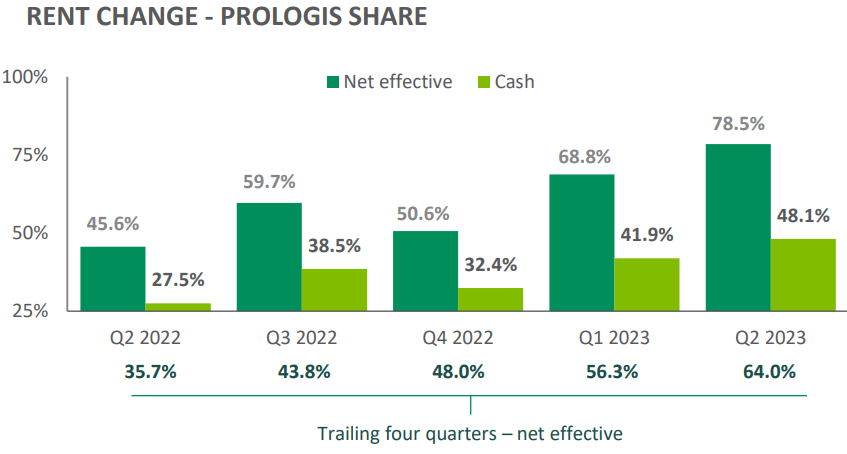
Note: PLD refers to this as “rent change”, which could be confusing since it refers to the spread on new and renewal leases rather than “market rent change”.
That kind of growth was not typical several years ago.
Cash same-store NOI growth for the quarter was 10.7%. It was the second-best on record:
Commentary About Growth
Some investors believe industrial real estate is already past its peak. Was Q2 2023 the peak for leasing spreads? It might well be. That’s a very hard number to beat.
However, CEO Hamid Moghadam provided some great comments on the topic. I’ll use the Motley Fool transcripts because I think they get better proofreading. Here is the first quote:
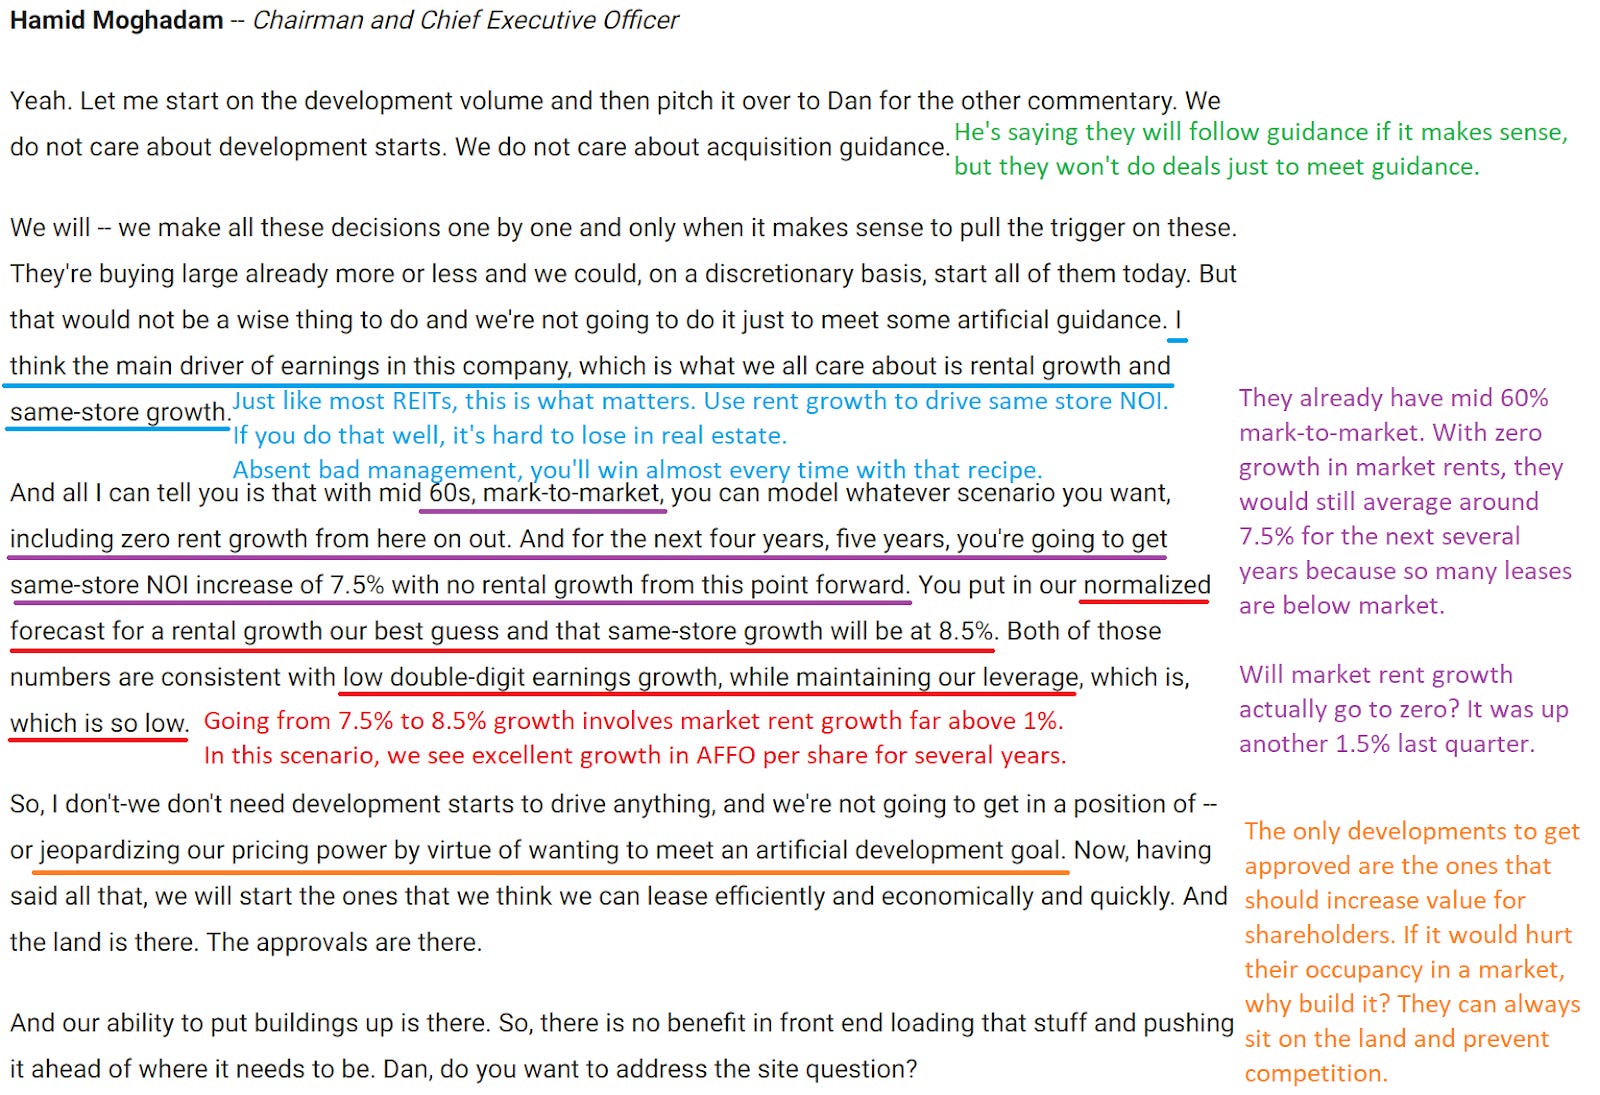
PLD is not alone in reducing development. Starts were down 40% in their U.S. markets and 50% in Europe. Global vacancy is projected to reach the mid-4s (between 4% and 5%) around the end of 2023. In 2024, a significant reduction in new supply should reduce vacancy. We can be confident about low new supply because PLD shares insights on global development activity for industrial real estate.
Besides PLD being ready to reduce developments, they’re looking to prioritize pushing rents over occupancy:
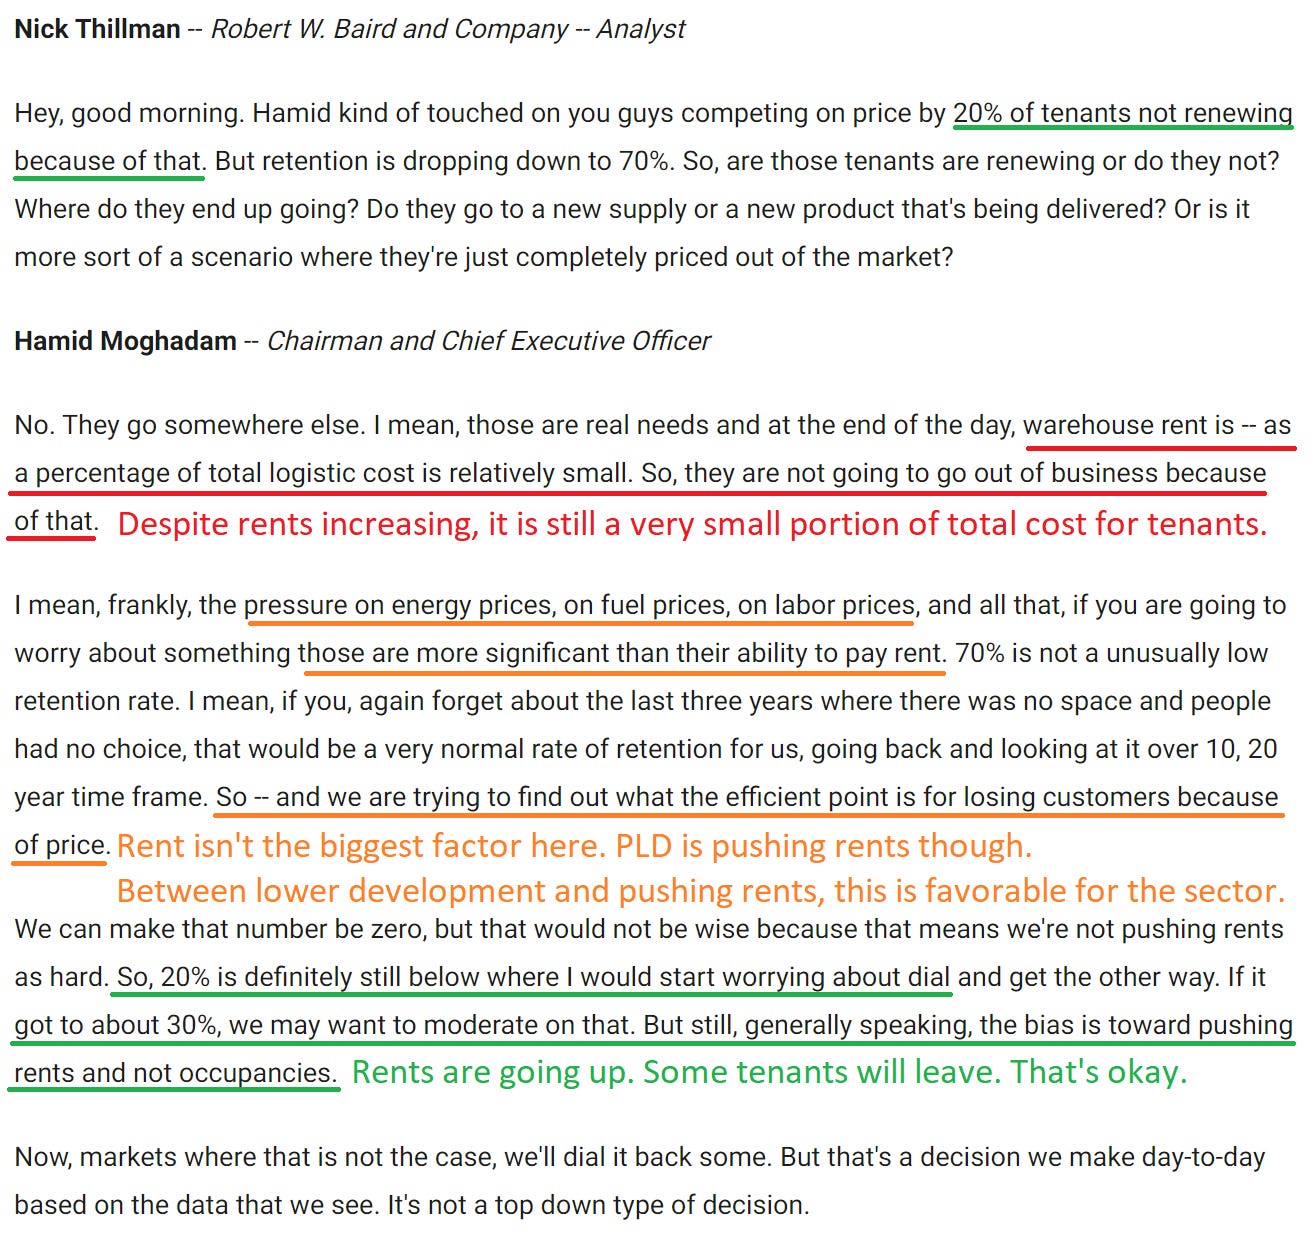
That’s positive for the sector. Less development and the biggest player in the market is looking to push rents. When you think about 2024 having far less new industrial real estate hitting the market, pushing rents makes sense. Occupancy could tick up now, but the environment for leasing should improve.
Can we really say that after record leasing spreads?
Southern California
Finally, we’re going to touch on Southern California:
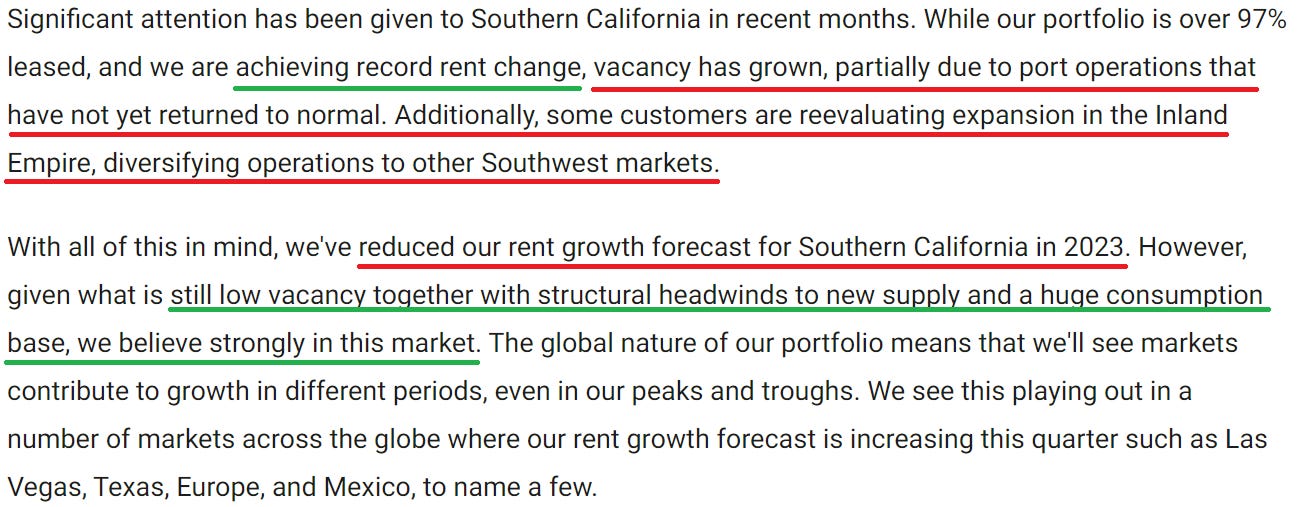
PLD’s increase in net effective rents (larger than cash rents) for their Southern California properties was +181%. Hardly a weak market. The reduction in forecasts comes from a high level, though PLD didn’t provide specifics on this metric. However, PLD did reference that:
“It’s kind of like adding 2% to 3% in one direction or the other to a number that’s north of 100%. So, I think we’re focusing on the wrong issues.”
The reduction in projected rent growth could excite bears. However, Hamid Moghadam remains focused on the fundamentals:
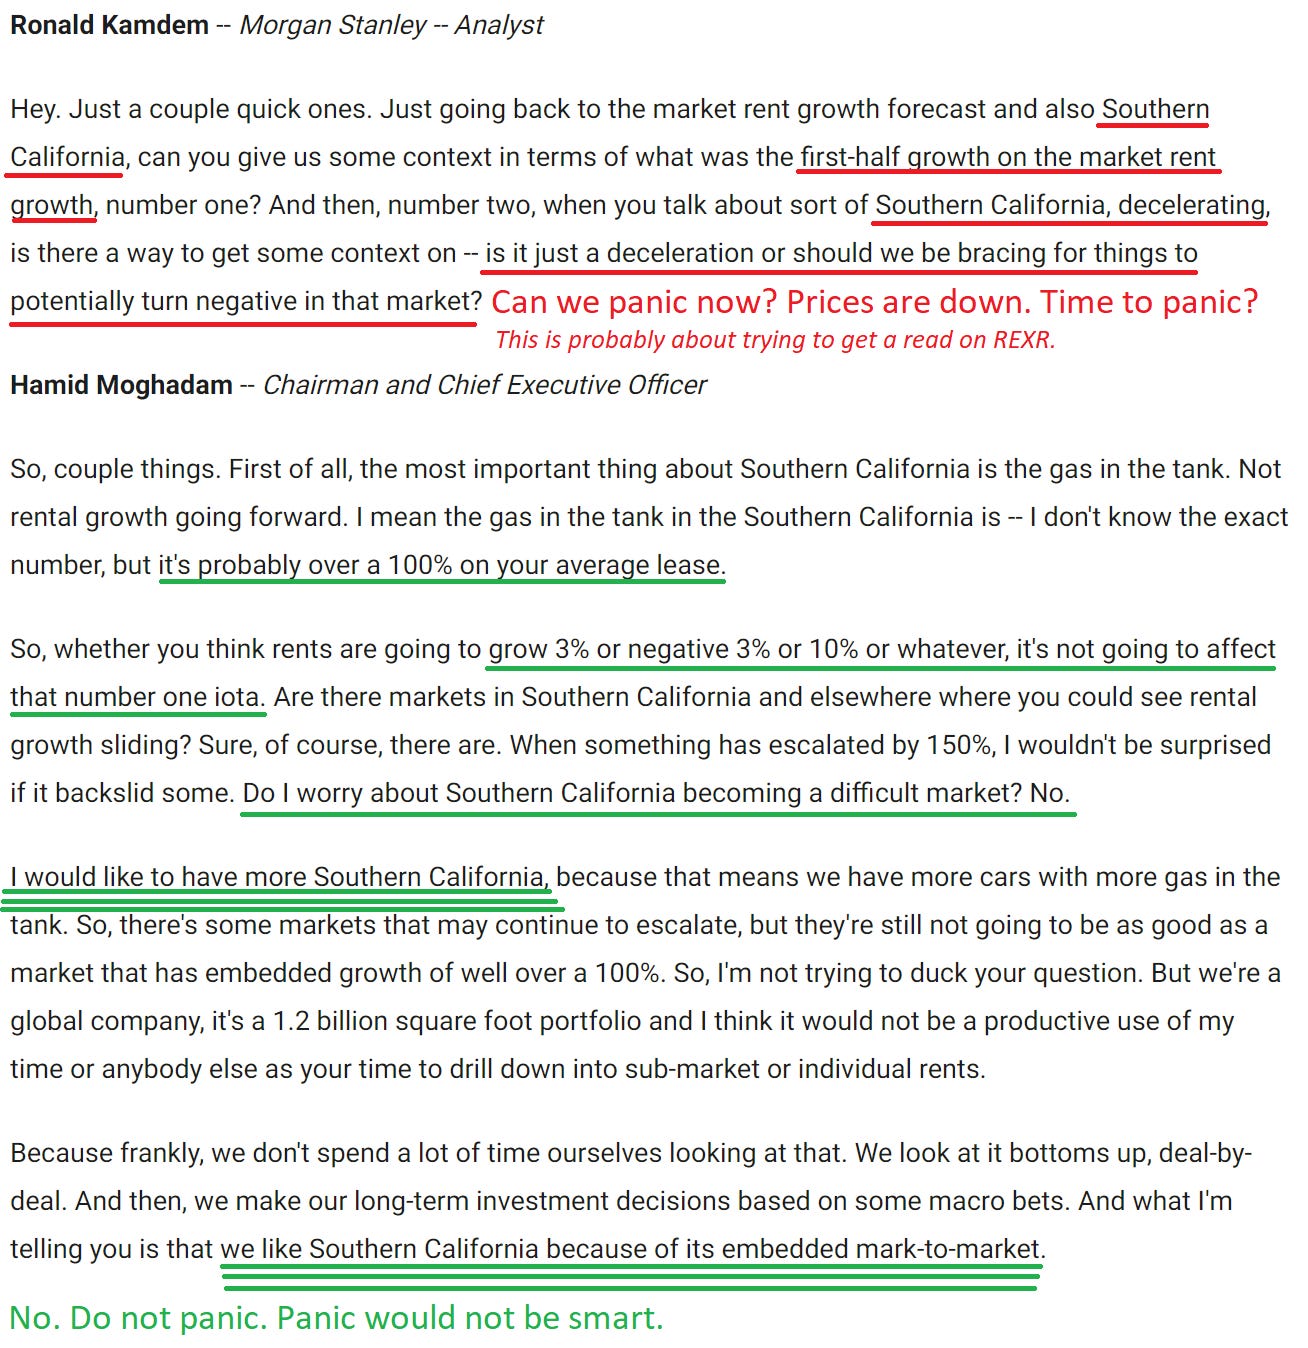
So, that’s a big “no” on panic.
But why is California seeing a reduction in occupancy? No, it isn’t because no one lives there anymore. Thank you for that insightful suggestion. It is about labor strikes, dock workers, and an extremely successful union. Successful in that sense is based on average pay of $195k plus benefits of $102k. Beyond the high pay, disruptions are creating an incentive for moving goods in vastly less direct routes.
Conclusion
Slight increase in guidance for Core FFO Excluding Promote Income. Increase in same-store NOI projections. Second-highest same-store NOI for the REIT (trailing only Q1 2023). New all-time record leasing spreads for the REIT.
The market seemed to hate the quarter, but there just isn’t much negative to say. Global market rent growth forecasts fell from 9% to 8%. How does that justify a big swing? Market rents are important, but 1% doesn’t really matter when you’re comparing 66% and 67%. That simply isn’t material to the thesis.
What other industry could deliver 7.5% growth in same-property NOI for the next 4 to 5 years even if rents were flat? None. Forecasting 8.5% growth in same-property NOI for the next few years? None. Double-digit growth rates in AFFO per share? There are very few REITs doing that, except for industrial REITs. I expect to see quite a few industrial REITs average double-digit AFFO growth rates over the next few years.
As earnings guidance was only slightly increased and market rent growth forecasts were down, this can’t be a 10/10. On the other hand, all-time record leasing spreads supporting double-digit AFFO growth rule out anything below 8/10. I don’t usually like to go into half points, but I think it’s reasonable here.
In June, we had late-quarter updates on leasing spreads from PLD and Rexford (REXR).
PLD’s preview had 87.5% leasing spreads. I think that raised expectations. While 78.5% for Q2 2023 is great, it came in below the prior quarter-to-date figure. Due to the elevated expectations, I think 9/10 is still a bit too high. That puts PLD at an 8.5 / 10 for the quarter.
REXR Preview
Rexford (REXR) released results tonight.
Guidance for Core FFO was up 0.7% (slightly more, but the difference is a rounding error). In June, REXR previewed leasing spreads at 73% on a cash basis and 94% on a GAAP basis.
REXR ended the quarter at 74.8% on a cash basis and 96.8% on a GAAP basis.
Ending same-property occupancy was 98.1%. Average for the quarter was 98%. So REXR achieved those spreads (all-time, all-REIT record to the best of my knowledge) while squeaking out a teeny tiny gain in same-property occupancy. I don’t see any way to spin that as a negative. Despite all the challenges in Southern California, REXR delivered.
Average same-property occupancy was 98%. For comparison, Q1 2023 same-property ending occupancy was 98%. Therefore, same-property occupancy was roughly flat.
Net effective mark to market dipped from 66% to 63%. Down 3%, but that’s after they signed a bunch of new leases at massive spreads.
I’ll want to see the earnings call before assigning a grade, but so far REXR’s results are looking good. Somewhere in the 8 to 10 range, depending on the commentary. Feeling great about these results.
Next Up
I’ll be working on the update for Crown Castle International (CCI) next.
The REIT Forum is a reader-supported publication. To receive new posts and support my work, consider becoming a free or paid subscriber.
Member discussion