REXR and PLD Update Q2 2024

There were no big surprises in the numbers for Prologis (PLD) or Rexford (REXR) .
Guidance was nearly unchanged. Here are the changes:
- PLD: Tightened range for Core FFO excluding net promote income. Old range: $5.45 to $5.55. New range: $5.46 to $5.54. Same midpoint at $5.50.
- REXR: Raised bottom end of range for Core FFO. Old range: $2.31 to $2.34. New range: $2.32 to $2.34. Midpoint increased $.005 to $2.33.
Note: We don’t care about guidance for net income. We already have Core FFO, which is a superior metric for analysis.
That’s it.
Everything else is commentary.
Since there were no major changes and these REITs operate in the same sector, REXR and PLD are great candidates for a combined update.
Two Southern Californias
Both REITs own space in California, but the portfolios are not the same:
- PLD is a global industrial REIT with many large properties.
- REXR is the Southern California industrial REIT focused on “small” properties.
We hear PLD and REXR discussing the Southern California market in different terms.
PLD references the “weakening” in California much more. This is weakening in market rents relative to a year or two ago.
However, PLD also mentions that the demand is stable (and vacancy lower) in the properties smaller than 100,000 square feet:
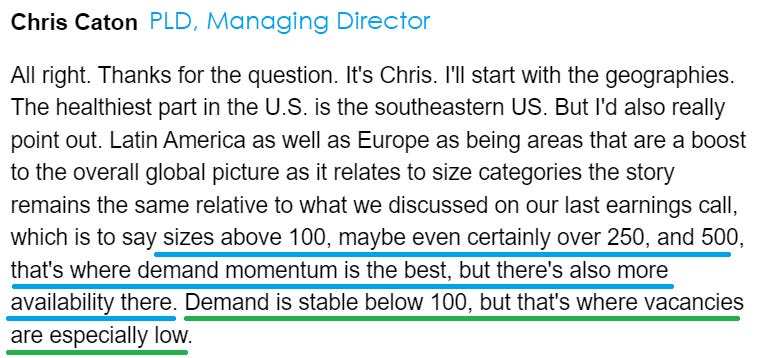
Source: Seeking Alpha Transcript of PLD Q2 2024 Earnings Call
PLD sees the demand momentum improving for their portfolio of larger properties.
Smaller properties have less “momentum”, as they already have superior occupancy.
While some factors can push the entire market for Southern California, the different sizes of industrial real estate have different customer bases.
REXR’s niche is small infill properties in Southern california. The amount of industrial real estate in REXR’s market is regularly shrinking because infill real estate is so valuable.
Even with industrial rents growing, it’s hard for them to achieve the same level of rent per acre as taller structures. If a location is extremely valuable, the developer can usually extract more value with a skyscraper than with an industrial building, which is only a few stories tall. Consequently, over time, some of the industrial properties will be replaced with other uses. That maintains a persistent imbalance between supply and demand.
REXR Projections
REXR provides multi-year guidance on some metrics.
That’s a great strategy. More REITs should do it.
REXR projects that with zero new acquisitions, they would be able to grow cash NOI (Net Operating Income) by $229 million across the next 3 years.
Of course, they will most likely continue to have new acquisitions since it is a significant part of their model.
REXR’s projection for $229 million of incremental NOI is split between 4 categories:
- Development: $95 million
- Mark-to-market (rolling leases over): $82 million
- Escalators: $47 million
- Recent acquisitions: $5 million
The recent acquisitions are acquisitions that already happened, but they were factored into the run rate for 2024 Q2 net operating income.
REXR also provided guidance at the start of the year forecasting a 3-year compound annual growth rate for Core FFO per share in the 11% to 13% range.
That includes 2024, where the projected growth rate is significantly lower (6.4% using the latest guidance with trailing Core FFO per share rounded).
When REXR made that initial projection, they were only projecting 4.3% for 2024. The increased guidance for 2024 is a positive sign, though it is at least partially offset by a decrease in market rents.
Mark-to-Market for Both
When we talk about industrial REITs, one of the major factors is the difference between market rates for their real estate and contracted rates. A significant portion of the portfolio for most industrial REITs (including these two) is on older leases that are well below market rate. As those leases expire, they are either renewed or replaced (new tenant) at much higher rates.
Thankfully, it has become standard practice to tell analysts the mark-to-market on the portfolio.
- REXR’s mark-to-market: 38%
- PLD’s mark-to-market: 42%
Finding PLD’s mark-to-market generally involves listening to the earnings call or pulling up the transcript.
REXR does an outstanding job of demonstrating their mark-to-market with two graphics.
The first one shows market rent growth by location within California:
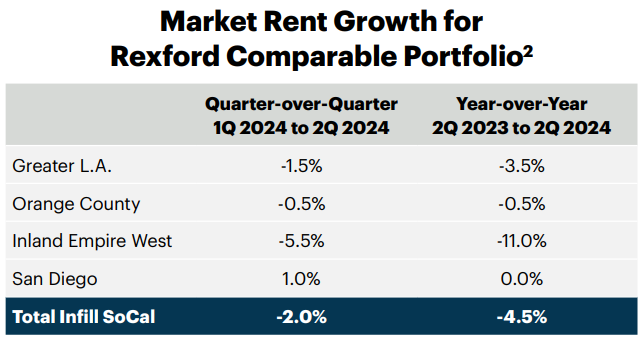
That’s an outstanding graphic.
It is designed to represent properties in these markets comparable to REXR’s portfolio and gives us a weighted average.
The next graphic helps us bring it all together. As an analyst, I want to see more graphics like this:
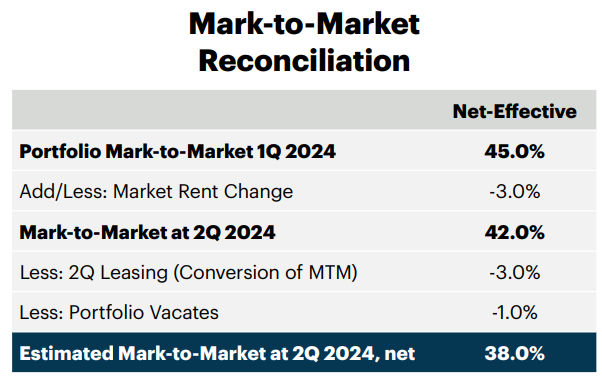
Note 1: Market rent fell by about 2% compared to the prior value. However, it represents a 3% change for REXR because we have a different denominator.
Note 2: The term “net effective” is used instead of cash. That’s fine. We get spreads presented in both net effective terms and cash terms.
This presentation demonstrates that the mark-to-market on the portfolio decreased from 45% to 38%. That is a difference of 700 basis points. 100 basis points is akin to adding or subtracting 1% from a number. We use basis points for clarity. This should probably get a tiny section in one of our guides. It might even have one already.
For a few years, industrial rents were surging higher. Lately they’ve been dipping. While we would prefer to see them increasing, an occasional decrease isn’t terrifying. As we know from Prologis, there’s a huge amount of new supply around the world. The customers who are able to relocate out of the more valuable infill developments will do that.
The additional supply was driven by a combination of lower cap rates (higher prices for new supply) and cheaper financing a few years ago. Developers responded to the incentive and ramped up production globally.
We can also see that the mark-to-market was decreased by 300 basis points as a result of rolling leases over to the new higher rates.
That simply means that leases expired and REXR signed a new lease with the tenant at a higher rate.
Leasing Spreads
For REXR, the leasing spreads during the quarter were:
- 68% on a GAAP basis
- 49% on a cash basis
Those are huge leasing spreads.
We also saw a 100 basis decline related to some tenant that was below market moving out.
Since REXR’s same property occupancy ended Q1 2024 at 96.4% and ended Q2 2024 at 97.3%, I really don’t see that as an issue. They simply had a tenant who wasn’t ready to pay market rates.
For PLD, the leasing spreads were even hotter:
- 73.9% on a net effective basis
- 51.4% on a cash basis
The cash spreads should typically be the lowest spread because of built in escalators. The cash spread uses the cash rent in the final year of the old contract vs. the cash rent in the first year of the new contract. The GAAP spread uses the “straight-line” rent method. There are legitimate reasons for GAAP to require straight-line accounting, but most of the time it is an annoyance. To keep it simple, you can see these spreads and know that they are outstanding.
Other REXR Note
REXR’s CFO (Chief Financial Officer), Laura Clark, will move to a COO (Chief Operating Officer) role.
I’m not thrilled by adding another C suite position (more overhead), but I do love the change in roles.
In most companies:
The CFO is regularly on the earnings call and provides analysts with more insight into the REIT.
The COO is usually not on the earnings call.
Perhaps you already read between the lines?
I mean no offense, but Laura Clark has been one of the least helpful CFO’s in the analyst Q&A segment of earnings calls.
These are excerpts (not full quotes) from her comments on the Q2 2024 earnings call:
- “...we don't guide on a quarterly occupancy rate.” Note: It would not be particularly hard to guide on though.
- “It certainly varies and the commencement of those is included within our current guidance.” Note: This tells analysts basically nothing.
- “And so that will occur over the coming years and we're not going to guide on the mark-to-market going forward by here.” Note: Mark-to-market going forward is one of the most useful metrics for analysts covering equity REITs. They absolutely should guide on this.
- “Just as a reminder, we closed on the convertible issuance that we did at the end of last quarter, and we held higher cash balances associated with that $1.15 billion issuance, and that resulted in higher interest income. And we don't expect to hold cash at the same levels in the second half. So, that's about $0.01.” Note: The question was about the headwind to Core FFO per share in the second half of the year. If they hold lower cash balances because of investing, they would lose net interest income but gain net operating income from real estate. This answer isn’t explaining much.
- “So you would expect that we'll be able to continue to achieve leasing -- higher leasing spreads as we're rolling these leases, but we're certainly not going to guide around leasing spread expectations beyond this year or the mark-to-market.” Note: More guidance is better than less guidance. More guidance makes analysts more confident in their models, which can encourage higher price targets. When REXR trades above NAV, they can issue new shares to run their acquisition pipeline.
- “But I do want to -- I do think it's important to point out that Rexford has a very differentiated driver of growth beyond the mark-to-market. And that's more significant than the mark-to-market impact, and that's through our repositioning and redevelopment. -- and the value that we're able to -- that we had there. And that really is the true differentiator of Rexford that enables us to drive leading FFO per share growth as we have demonstrated over the past five years.” Note: These projects are also fueled by being able to issue equity above NAV. When such a large emphasis is placed on redevelopment and repositioning, we should have extremely explicit charts and tables of data.
Note: Quotes from Seeking Alpha transcript. In some cases I will personally verify particularly important quotes or quotes where I have reason to doubt the transcript was accurate. These quotes don’t meet either criteria.
Given those factors, I think a CFO focused on helping investors and analysts with modeling data would be more useful. Laura Clark’s skills may be utilized more effectively in the COO role. An important part of REXR’s success since their IPO was a result of providing extensive forward-looking data, achieving a premium to NAV, issuing new equity above NAV, and prudently investing that capital.
Targets
Overall, these were decent quarters.
The dip in industrial rents seems negative, but PLD has been warning investors to expect a dip due to the elevated supply.
We’re adjusting targets for REXR up by 0.5% primarily for the slight boost in guidance while reiterating targets for PLD:
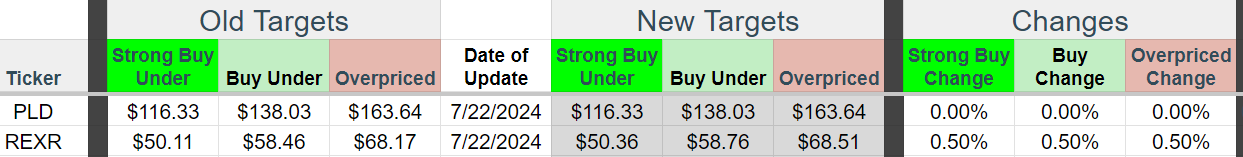
There is no change to risk ratings.
Among the industrial REITs we cover, I still think REXR has the most appealing valuation. For better or worse, it’s also worth noting that the sector jumped higher over the last few weeks as interest rates dipped. Interest rates may continue to be a significant factor pushing valuations higher or lower.
At the time of publication:
- REXR: $49.68.
- PLD: $126.66
- Terreno (TRNO) $68.64.
- EastGroup Properties (EGP) $191.25.
I am long REXR, PLD, and TRNO.
Member discussion