
Portfolio Update - July: Rates Finally Falling
Summary:
Interest rates ended the month lower and fell much harder in July. Lower rates drove our sector higher.
Upcoming article on Agree Realty with reader questions on acquisitions, shareholder friendliness, and growth.
Long discussion about potential trades for our paid subscribers. Also includes one preferred share we think investors should exchange for a peer.
Interest Rates
Rates ended the month modestly lower. across the curve.
That was a positive factor for our portfolio and our indexes.
So far in early July, we’ve seen a further reduction in rates.
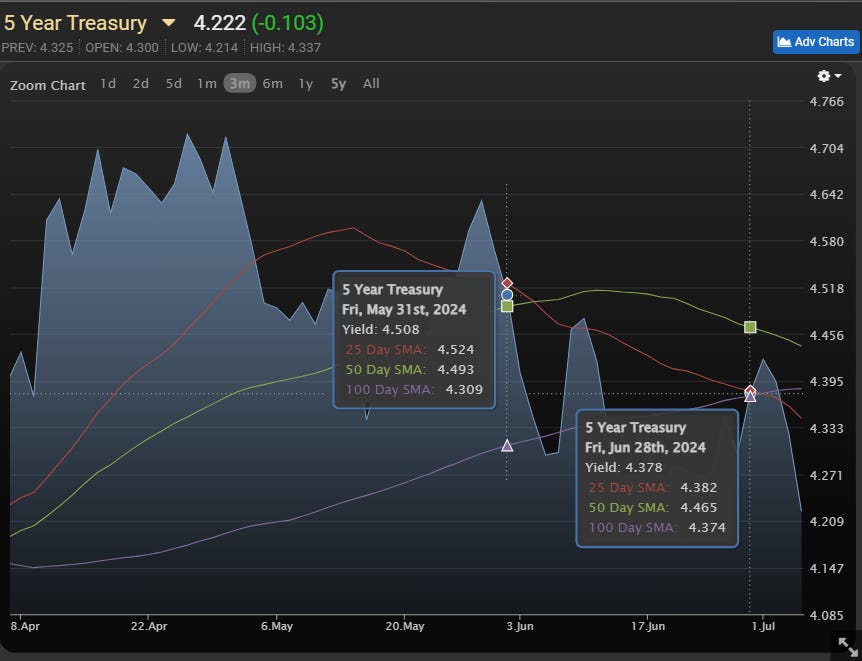
Source: MBSLive
Note: As of 7/16/2024 in the afternoon, the 5-year Treasury is down quite a bit further. The 5-year Treasury yields 4.08% now, which is a material difference.
Those numbers were updated right before uploading.
Upcoming Article
I have an article on Agree Realty (ADC) coming up. I’ll be answering reader questions. If you have questions about ADC and haven’t asked them yet, please add them as a comment to this post. I’ll be finalizing the list of questions soon so I can prepare the article.
- How accretive are their current acquisitions?
- I see the CEO of Agree Realty often on SA answering comments on ADC articles, usually in a polite and friendly manner. Is this just PR or is the ADC one of the most small shareholder friendly?
- Both good questions I’d like to hear Michael’s response on. A 3rd question I have is what do you think the growth of ADC’s dividend might be over the next 3-5 years and how would the company perform should the country fall into a recession due to current fed policy?
- Is not ADC a little overpriced at 62 with a slow growing 5% dividend, even more if compared with O?
- ADC and NNN are in the same retail REIT subsector with investment grade credit ratings and a similar size. Which one do you think is in a better position to perform well going forward?
- I purchased 100 shares of ADC at $58 a share, with the intention to hold it for the income. However, I have no objection to selling it and rolling the cash into another investment if it becomes overvalued. So my question is, at what price is ADC considered to be overvalued? Also, how is ADC valued? By that I mean is it nav or affo, or some other metric. My knowledge is scant, but I am learning.
- ADC or ADC preferred...that is the question? or perhaps a bit of both?
- Would greatly appreciate your expertise on fundamentals and growth arguments on ADC compared with those for 'the turnaround case?' WPC.
Note: For non-paid members who get the preview version of this article (excludes “potential trades” section), you can still reply to our invitation for reader questions on Agree Realty. That post has comments open for everyone.
Recent Preferred Share Updates
We recently modified targets for several preferred shares and some baby bonds. Most of the adjustments were relatively small, but shares tend to trade pretty close to targets in this sector so even a modest change can be important.
Article Starts
You can find prior installments of the Portfolio Updates on the Portfolio tab of our website.
Older editions of the Portfolio Update are unlocked for everyone. The newest release reserves the foreshadowing section for paid members.
Trade Alerts
We have a page on Substack to link all trade alert articles.
Here are The REIT Forum’s trade alerts.
Layout - Modified Order
To keep things simple for our investors, the rest of the portfolio update is divided into several segments. We run the same segments (with new content) each week.
We usually maintain the same order from month to month, but I revised the order to work better with free previews. Eventually, the order will be locked in again.
- Returns on Total Portfolio
- Sector Allocation
- Reminder About Cash
- Housekeeping
- Recently Closed Positions with Returns
- Recently Opened Positions with Returns
- All Open Positions by Sector with Returns
- Outlook
- Foreshadowing Potential Trades (paid section)
This layout maximizes transparency while keeping the foreshadowing of our potential trades within the paid section. It also loads the images together at the front, while putting the text-heavy sections together at the end.
Returns on Total Portfolio
Note: The presentation of the charts was modified slightly to enable running it through Google Sheets instead of Excel to reduce transferring data.
The chart below shows our performance since we began preparing for The REIT Forum at the start of 2016 through the end of the latest month:
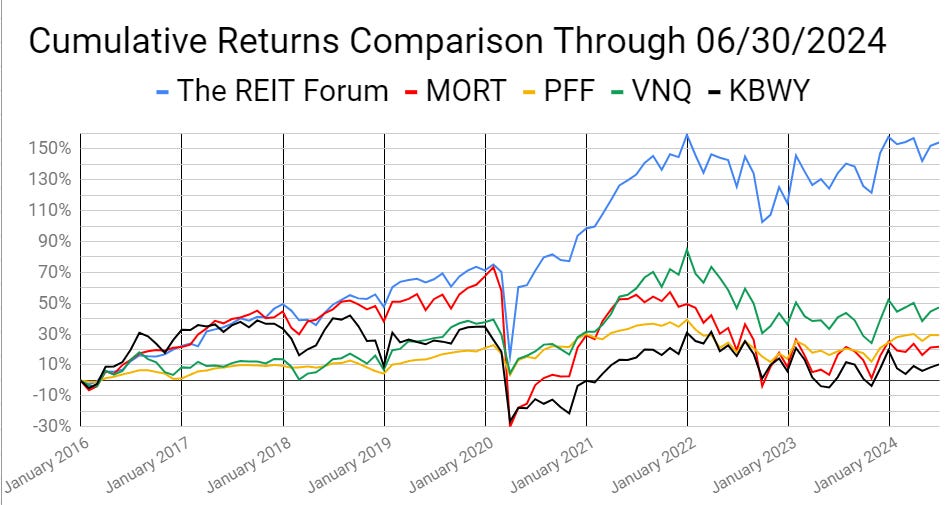
There are four major index ETFs we use for evaluating performance. They are:
- (MORT) $MORT - Major mortgage REIT ETF
- (PFF) $PFF - The largest preferred share ETF
- (VNQ) $VNQ - The largest equity REIT ETF
- (KBWY) $KBWY - The high-yield equity REIT ETF most retail investors follow
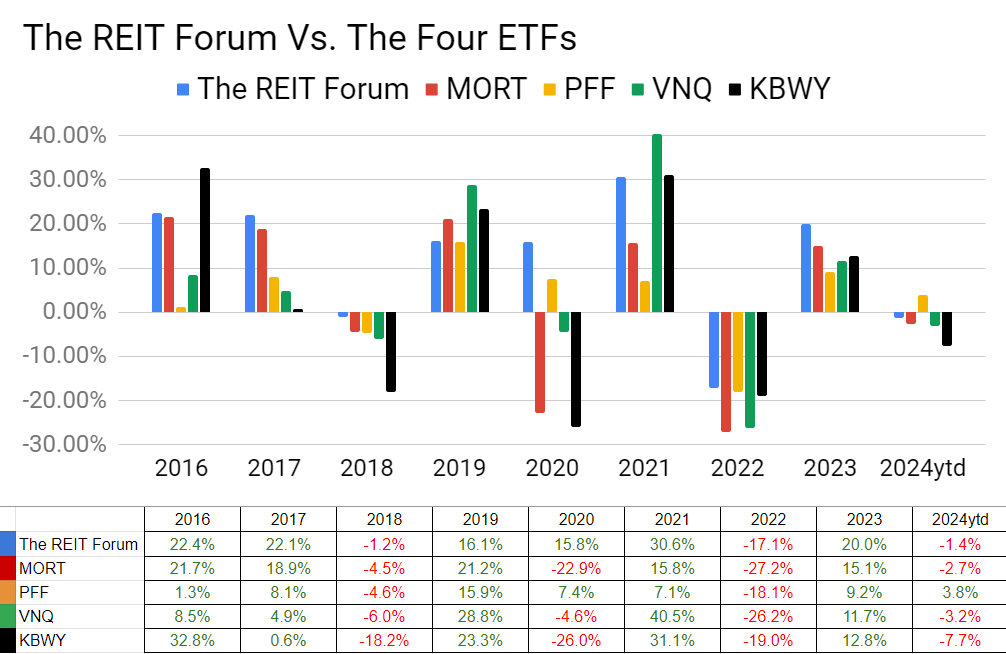
Annual comparison vs. each ETF:
Our performance vs. the average of the ETFs:
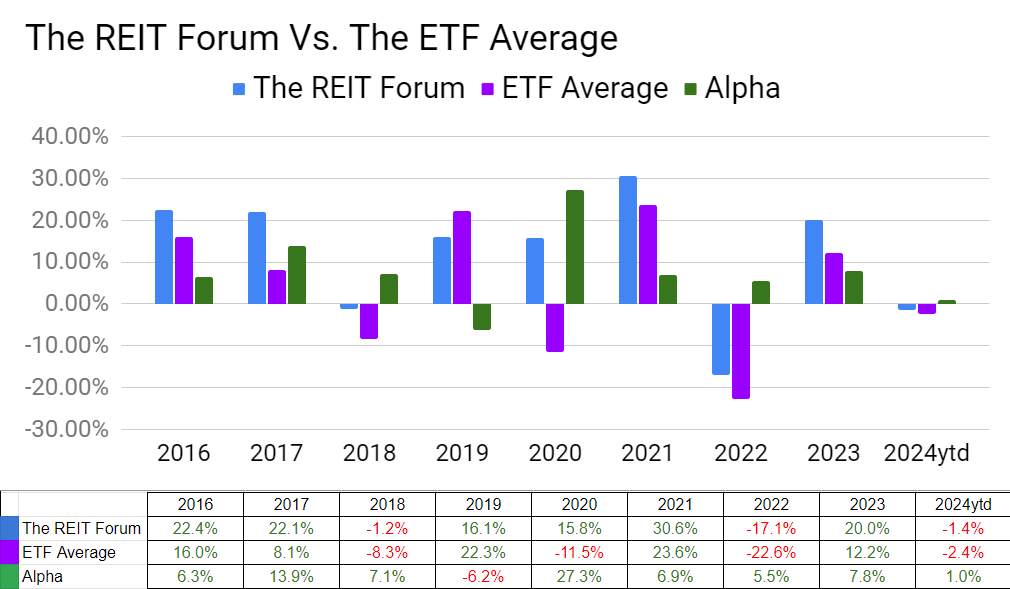
We evaluate alpha based on performance against the ETFs because it strips out the general change in our sectors.
The next chart shows the change in the value of our portfolio from month to month. We strip out the impact from contributions made during the month because, obviously, contributions are not returns.
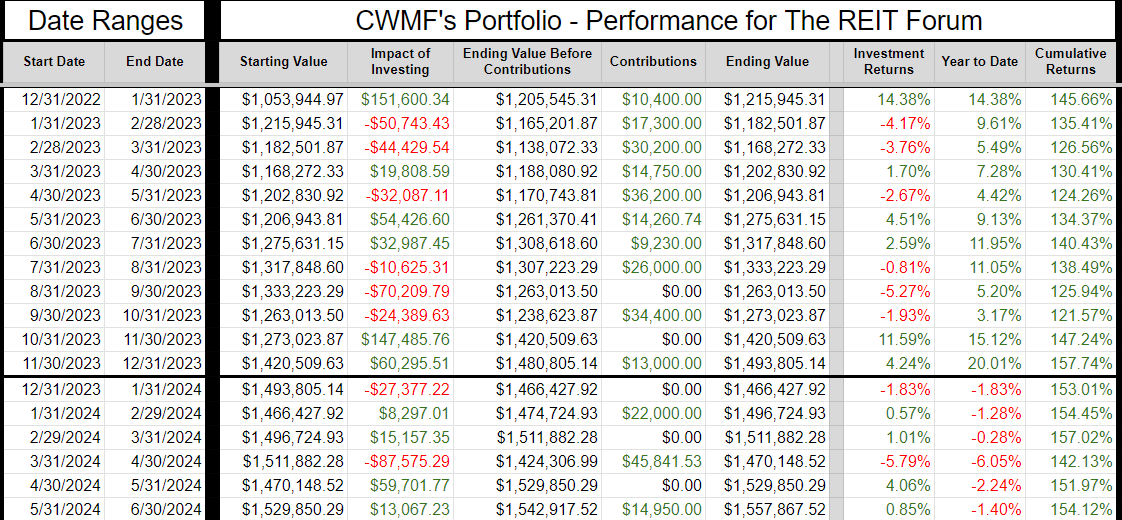
The prior year is included as well to help investors see how the calculations work.
If anyone is confused by these calculations, let me know. I believe this transparency is crucial, so I’ll include an example showing every calculation if I hear that readers have any difficulty following it.
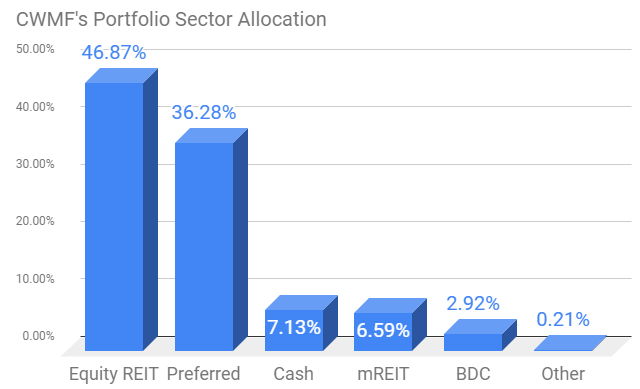
Sector Allocation Chart -
The sector allocation chart helps to explain how we are thinking about risk and seeking returns:
Reminder About Cash (repeated)
I normally keep at least 6 months or more of living expenses in “cash”. If you normally keep around $40k to $50k in “cash”, the difference between getting paid 5% and 0.2% is around $2k per year.
I’m using (SGOV), (SHV), and (BIL) as my cash substitutes. These are short-term Treasury ETFs. Prices are extremely stable. Liquidity is excellent.
I use a Schwab business account that is not part of my portfolio. The only assets it holds are actual cash and cash substitutes (those 3 ETFs).
Nearly all my expenses go through my credit card already (paid off in full each month).
I still have my checking through USAA because of the long history on those credit cards. If I need cash, I can sell Treasury ETFs and transfer the funds to my USAA account.
It takes a few days, but that’s fine.
This is a pretty nice return for cash I was going to have there anyway.
Note: Some people think you don’t need a strong credit score after getting a mortgage. I disagree. The long history on those cards is extremely useful if I want to boost someone’s credit score. If I add someone to my card, their next update will show they have a card with 20 years of perfect history.
You can get scammed this way. You are liable for the bill. They can just charge the card and walk away. This doesn’t concern me because I keep a lower limit (such as $10k) on those cards and I’m only doing it for people I trust. If one of those people betrays me, I’ll count myself lucky that I found out for only $10k. For people who can’t afford to risk that money, this would be too dangerous.
Housekeeping
We used to have a repeated section on strategy, but I wanted to shorten the update.
I’ll be posting an article that covers our strategy in greater depth and just adding a link to that post.
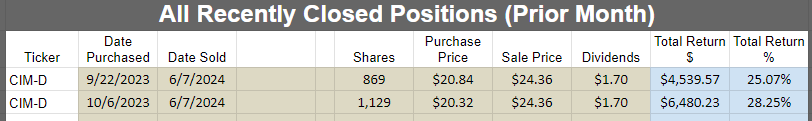
Recently Closed Positions with Returns
These are the positions closed during the prior calendar month. If you want to see positions that were closed before that, you can see the prior portfolio updates or use the Google Sheets.
If we didn’t close any positions for the sector during the month, then the image will be blank.
Note: By loading the Google Sheets, you can still see all of our closed positions. We only include the recently closed positions to reduce the size of the article:
Recently Opened Positions with Returns
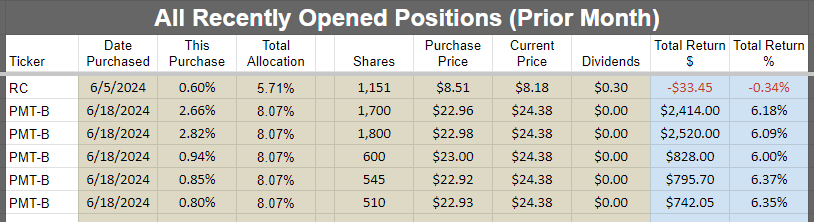
Note: We purchased additional shares of Ready Capital (RC) on 07/01/2024 at $8.02. Since that is part of July, it doesn’t go in the image for June’s trades.
All Open Positions by Sector with Returns
We will start with the open positions as of the end of the month. It often takes a few days to prepare this article, but the screenshots below are from the end of the prior month.
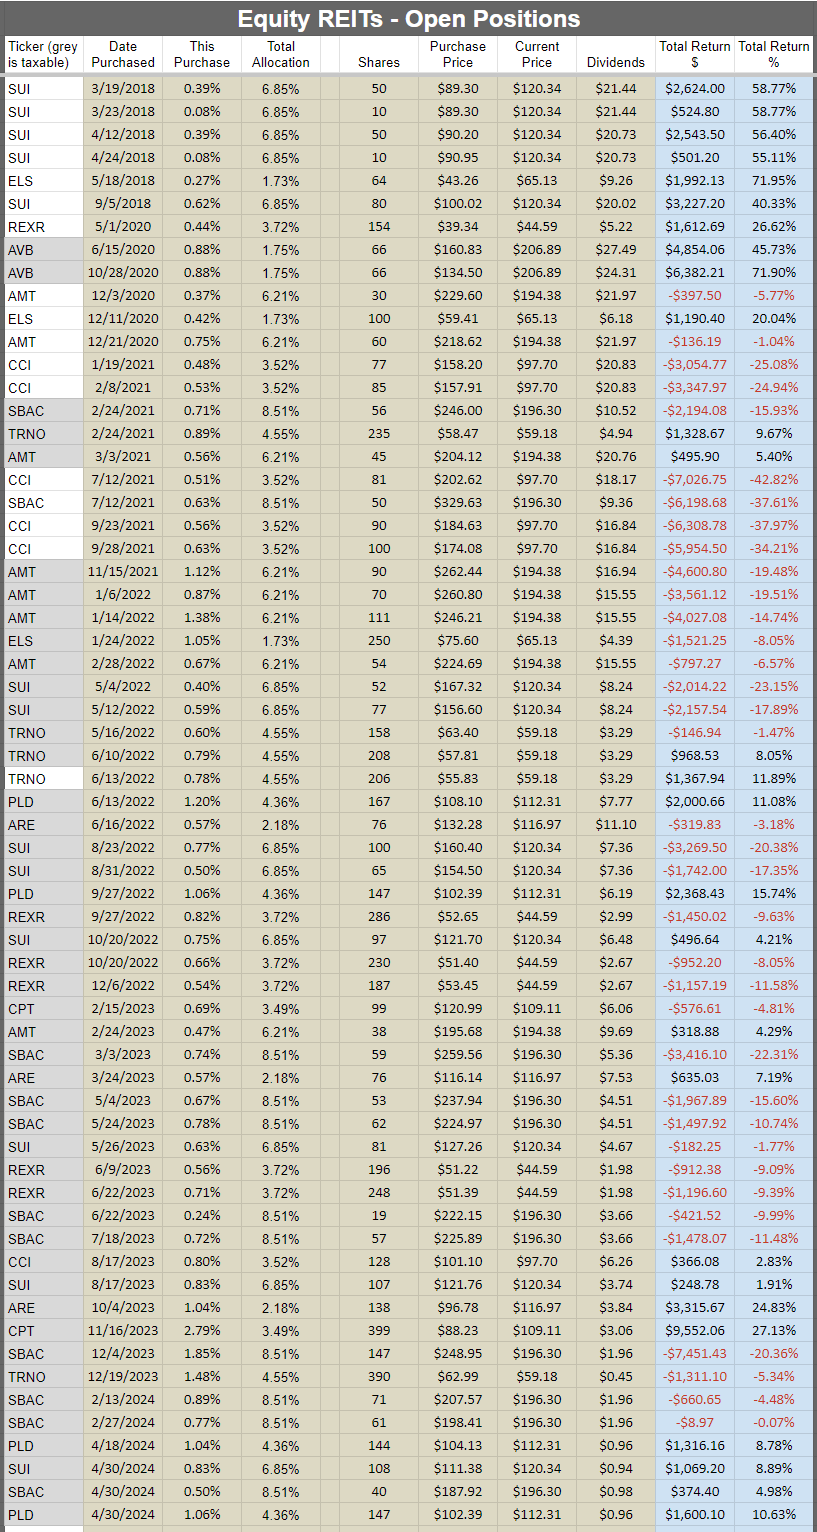
The cell with the ticker is grey if the position is in a taxable account. This was a request by a few members and there was no drawback to adding the information. All of the taxable positions are in equity REITs.
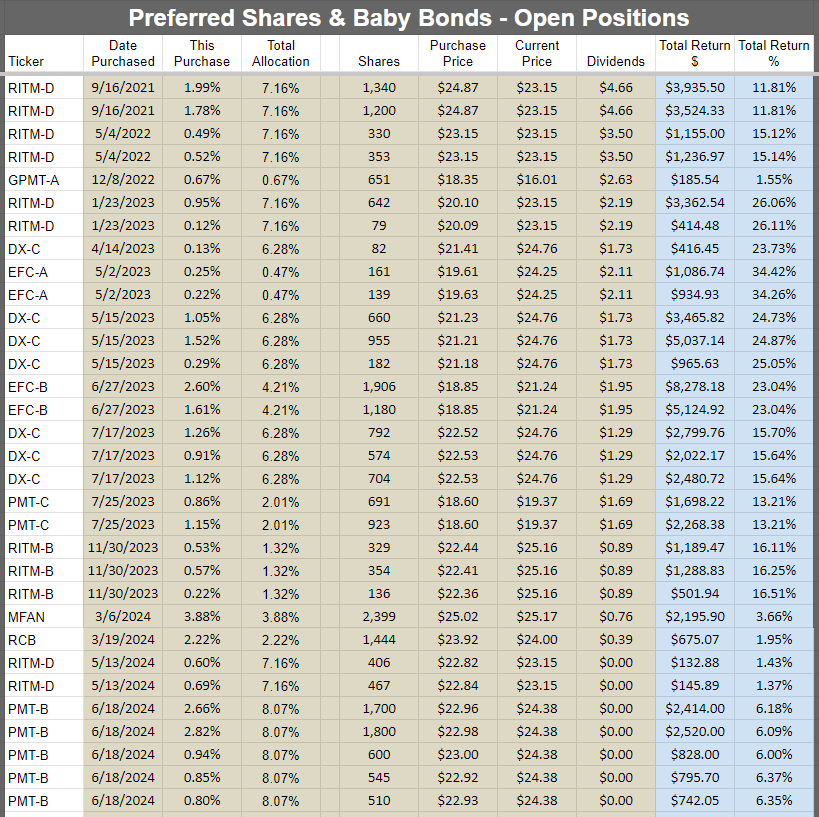
Preferred shares and baby bonds:
Equity REITs:
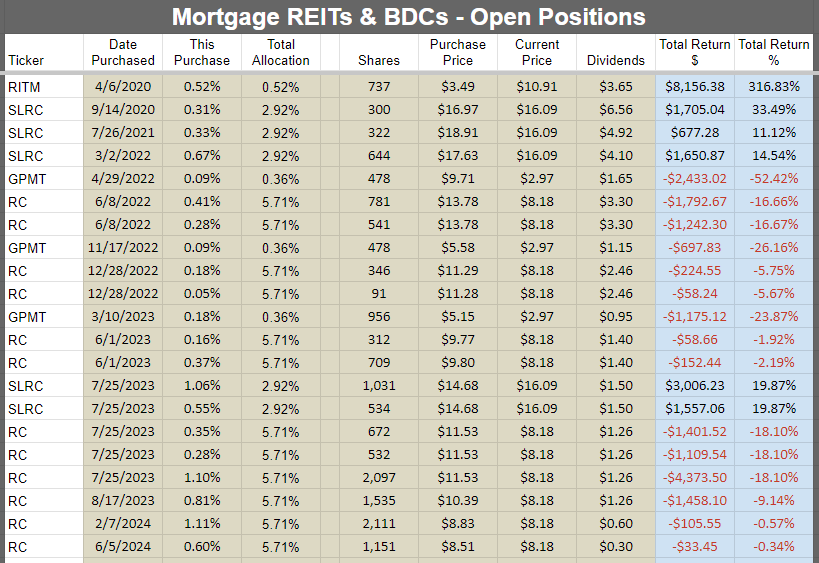
Mortgage REITs and BDCs:
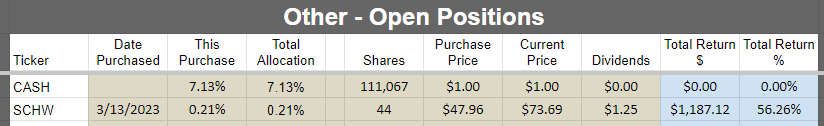
Other:
Subsequent Changes
None so far.
Outlook
I became a bit more defensive by taking the gains on our position in the CIM preferred shares.
However, after that, I became a bit more aggressive as we allocated heavily into the PMT preferred shares.
That matches my commentary from last month about “I’ll be hunting for the preferred share opportunities (including swapping positions) and looking for potential opportunities in baby bonds.”
I’ll continue to watch that space and may be active again.
Foreshadowing Potential Trades
This section is usually prepared shortly before publishing. The goal is to quickly cover ideas for trades. We aim to foreshadow our trades here, though the market may move in surprising ways. While the article takes days to prepare and documents prices and performance from the end of the month, the potential trades section is written last to provide the most up-to-date pricing.
Based on the change in relative prices as of 07/16/2024 here are some of the trades on my radar.
Note: Prices are from midday. But not at the exact same moment, because it takes a while to prepare the section.
Paid Section Begins
Keep in mind that this is based on current prices and which shares stand out as closest to triggering a trade.
I’m not expecting to insert much capital into the portfolio this month. We may need to run more advertising and I want to be ready to cover any costs there. I’m not an expert on running effective campaigns, but I’m open to hearing from people with expertise in the field if they want to help.
Foreshadowing potential equity REIT trades
Industrial: When I started on the Portfolio Update, I was going to highlight Rexford (REXR) here. However, the piece was delayed a bit while I worked on the preferred share target updates. Interest rates fell and REXR rallied over 9%. Despite that rally, it is still (very slightly) below our “strong buy” target price. I’ve got a pretty good industrial allocation already though with nearly 13.5% of the portfolio in a combination of REXR, Terreno (TRNO), and Prologis (PLD).
Housing: Over the last couple of months we’ve seen a huge rally in housing REITs. We haven’t seen any significant fallout over the “Realpage” collusion cases. Consequently, I don’t expect to change my positions here in the immediate future (maybe AVB?). However, I do want to highlight a recent disparity. As interest rates fell, we saw a huge rally in industrial REITs and cell tower REITs. The housing REITs were rallying before, but their gains over the last two weeks were much smaller. When I started this article, Essex (ESS) was at $272.32. Today, it is at $278.95. That is up 2.4%. A nice gain, but small compared to the industrial and cell tower REITs. I attribute the recent disparity in performance to the way investors are thinking about the impacts of interest rates. I should mention AvalonBay (AVB) though. Shares are nearing the upper end of our target range. I plan to have a review for those targets, but there’s the potential of reducing that position. One of the challenges is that I have shares in a taxable account and an extremely low basis on them. It would count as a long-term capital gain though, so the tax rate wouldn’t be as bad. I’ll think about it. No decision on a trade yet, just disclosing that it’s something that might come up. In hindsight, given the spread in valuations before rates fell, I probably should have taken the hit to move into shares with much larger discounts to targets.
Towers: Still mostly interested in SBA Communications (SBAC). However, it rallied even harder than REXR. Up to $213.11 from $190.75. That’s 11.7%. Many investors think the weakness in tower REITs is because of satellites. However, these moves support the idea that it is really primarily about interest rates. Tower REITs and industrial REITs have two major things in common:
- They have low dividend yields relative to other property types.
- They are built on delivering long-term growth in AFFO per share.
Lower interest rates help them in 3 ways:
- Makes bonds less attractive by comparison (more important for low-yield REITs).
- Reduces discount rates (more important for low-yield REITs)
- Improves the ability of almost all REITs to generate growth in AFFO per share (perhaps most important for those that like to use acquisitions)
When I was initially preparing this section (thought I’d be able to publish it faster), I wrote:
“Still mostly interested in SBA Communications (SBAC) $SBAC $190.75 and still expecting near-term growth challenges. Yeah, I get that the dividend rate is really low. But the AFFO multiple looks like a REIT that would have low growth for a long time rather than a brief period.”
Other: No other equity REITs on my radar at the moment.
Foreshadowing potential BDC trades
Golub Capital BDC (GBDC) has been trading right around the target “buy under” price. It even dipped below that level briefly. Scott already opened a position. It’s on my radar as one I might open also.
I may also take a look into Blackstone Secured Lending Fund (BXSL). That’s a new BDC for our coverage universe. It’s also sitting slightly inside the target range.
Foreshadowing potential mortgage REIT trades:
I can’t predict this well in advance given the volatility in prices. There’s been a huge rally in Ready Capital (RC). Shares are now at $9.21. It still trades inside our “Strong Buy” target. I might consider taking some gains off the table.
In our recent purchases, I indicated that we were going severely overweight. Further, I explicitly referenced that if there was a substantial rally, I might reduce my weight even if shares were still within our target range.
Because shares were so cheap ($8.02), I decided to keep buying them. I used that logic to buy RC 3 times this year. Those positions are now up 11.1%%, 11.76%, and 14.84% (including dividends where relevant). The most recent purchase (up 14.84% was July 1st!
If I was committed to never selling a share until prices broke above our target levels, it would tie me to positions.
- When RC hit $8.83 in February, I went from 7,616 to 9,727 shares.
- When they were at $8.51 in June, I increased again to 10,878 shares. This was also related to being quite pleased with their presentation at NAREIT.
- When they were at $8.02 on July 1st, I increased again to 12,875 shares. Same thesis, lower price.
If I make any changes to my position, it should be viewed in the context of those trades.
I haven’t decided if I’ll make a change, but I am considering it and wanted to foreshadow the potential properly.
Foreshadowing potential preferred share or baby bond trades:
Baby bonds are on the radar!
Note: We are primarily interested in the yield to maturity, but will also consider the yield to call if it is worse than the yield to maturity. Investors who are only looking at the dividend payment are ignoring that the bonds should all trend towards par value ($25.00 for baby bonds) as maturity approaches (unless the company is failing). We want to consider the eventual gain or loss for someone holding to maturity as part of our valuation process.
MFAN (MFAN) is trading right in line with our target at $25.32. Just posting this probably pushes it a bit above.
The drop in interest rates was a double benefit here. MFA common shares ($11.74) are trading very close to a fresh 52-week high. That’s great for the credit risk profile.
The lower interest rates are also favorable for discount rates though. As rates have fallen, bond prices move up. Given that combo, I would be interested in buying MFAN at $25.32. Perhaps a TINY bit higher. I wouldn’t go wild over it though. No market orders. No big increases. But a few pennies would be fine.
MFAO (MFAO) at $25.61 is only $.05 above our target. Same general case as MFAN. Either could be interesting and it would just depend on valuation.
RCC (RCC) also lands on my radar. Shares are still 0.9% above the target. That’s enough to keep me back for the moment. However, being within 1% is close enough to put the shares on my radar.
GPMT-A (GPMT.PR.A) is also on the radar. We reduced targets and increased the risk rating during the last target update. It carries a high yield and the floating yield should be huge, but the risk level is much higher than the other preferred shares we cover. During our time holding GPMT-A, it has significantly underperformed our other preferred share investments. However, our total returns are still positive.
EFC-A (EFC.PR.A) and EFC-B (EFC.PR.B) are still in my portfolio. They achieved a moderate premium to our targets. I may need to reconsider these positions, but nothing stands out as a similar choice with a great valuation for replacing them. The yield to call on EFC-B is still really good. But it is a fixed-to-reset share and the reset doesn’t happen until early 2027. That is a pretty long time. Further, it has quite a bit of upside if rates are falling because of a big discount in the share price. That makes it hard for me to close the position because there aren’t many of those opportunities. Closing EFC-A around $24.75 (today’s price) could work. Shares begin floating after the next dividend payment. The yield to call is 9.7%, but a call is a lower probability since the REIT hasn’t called EFC-E (EFC.PR.E) with an even higher spread. Absent recession risks, I think EFC-A would trade slightly over $25.00 after the floating rate kicks in (which is the same time that shares become callable). If rates come down, the future floating payment would come down. I might want to replace my EFC-A with some baby bonds, or I might sit on it until it floats and then look to swap.
Other Notes:
PMT-B (PMT.PR.B) was listed at one point as a situation where we could take profits (rallied hard after we opened the position). However, prices dipped modestly since then ($24.03 today). Unless they go back up, I wouldn’t be looking to take gains. I think we still deserve a higher price.
RITM-A (RITM.PR.A) is a share where I think a call within the year is a significant possibility. That could weigh on shares. The target price is set at a level that reflects a modest loss on calls. The target is set at $25.11 + dividend accrual, because I think shares could reasonably trade around that level given the high yield. However, it might be a tiny bit too high given the elevated call risk. This one is hard to call. I do like shares at $25.00 though. That is where they trade today (very recent ex-dividend). If shares get called, the investor would break even.
The hope in such a position is that prices might rally about $.20 beyond dividend accrual. Then the investor would look to exit quickly with the capital gain. We frequently see preferred shares from AGNC (AGNC) and Annaly Capital (NLY) trading at discounts as large or even larger than that.
NLY-Y (NLY.PR.F) is currently trading at $25.61. Dividend accrual is about $.32. So the price is about $.29 ahead of dividend accrual.
AGNCN is trading at $25.71 with only $.11 of dividend accrual. That’s $.60 ahead of dividend accrual! That makes RITM-A and RITM-B (RITM.PR.B) more attractive.
However, I should also point out that I strongly dislike AGNCN at this price. If shares were called immediately, shareholders would get about $25.20 (by my estimate). That would be $25.00 for the call, $.11 for dividend accrual that already happened, and $.09 for additional dividend accrual between the last dividend payment date and the effective call date. Some investors would expect $25.00 + $.11 + $.20 based on the difference between the current date and the call date. However, they would be wrong. There’s an adjustment related to the difference between ex-dividend dates and dividend payment dates. I factor that into the numbers, but many investors miss it. Investors with AGNCN should drop shares at $25.71 and reinvest. There are many superior alternatives. How about AGNCO (AGNCO)? Shares are trading at $24.90. They only have one fixed-rate dividend left. Then they begin floating at a similar rate to AGNCN. It’s a tiny bit lower, but it isn’t really material. If shares of AGNCO were called on the first possible date, the investor would still earn an 8.4% yield to call rather than throwing about $.51 in AGNCN if shares were called immediately. In my opinion, gains are better than losses. Brilliant, right? Therefore, AGNCO at $24.90 is inherently better than AGNCN at $25.71 and the gap is material.
Conclusion
Thanks for reading. I hope you find the ideas in this article helpful as you navigate the markets.
I apologize in advance for any typos. With such a large document,having at least one or two is common. If you’re reading this more than a day after publication, check the comments section for any corrections.
Member discussion