O: Q2 2023 Update for Realty Income
Net lease REITs are relatively easy to analyze. Realty Income (O) is a great example. The most significant complexity that can come up is usually exchange rates, and that usually isn’t a big deal. It’s annoying if you’re trying to chart changes in debt over time and want your model to be really precise, but otherwise, you can just ignore it.
Guidance Update
I prepared the following table to highlight key metrics:
The REIT Forum is a reader-supported publication. To receive new posts and support my work, consider becoming a free or paid subscriber.
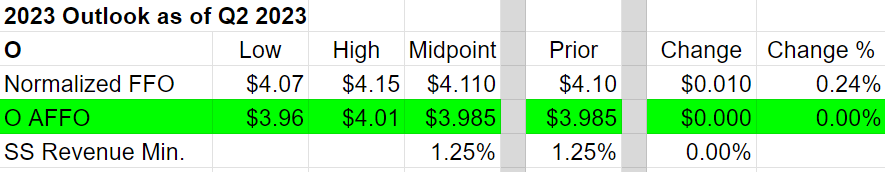
Technically, O increased guidance for normalized FFO per share. The range is only up 0.24%, so not a big deal. AFFO guidance was flat.
While some REITs provide same-store revenue growth in a range, Realty Income only provides a lower end for the range. Consequently, this is a same-store revenue minimum growth rate of 1.25%. For reference, 1.25% year-over-year isn’t much.
Note: In Q2 2023, O achieved about a 2.0% increase for same-store revenue. Quite a bit better than 1.25%.
Types of FFO
Realty Income provides guidance for two metrics:
- Normalized FFO
- AFFO (which I labeled “O AFFO” above).
Note: For the rest of this article, “O AFFO” will simply be referred to as “AFFO”.
We can use growth rates in either and be perfectly happy because O’s accounting is pretty straightforward. Neither metric is what I would consider perfect, but they are good enough for our purposes.
Quarterly Guidance
There is no quarterly guidance, so those tables aren’t useful here.
Guidance Changes and Growth Rates
I’ve enhanced the presentation for changes in guidance:
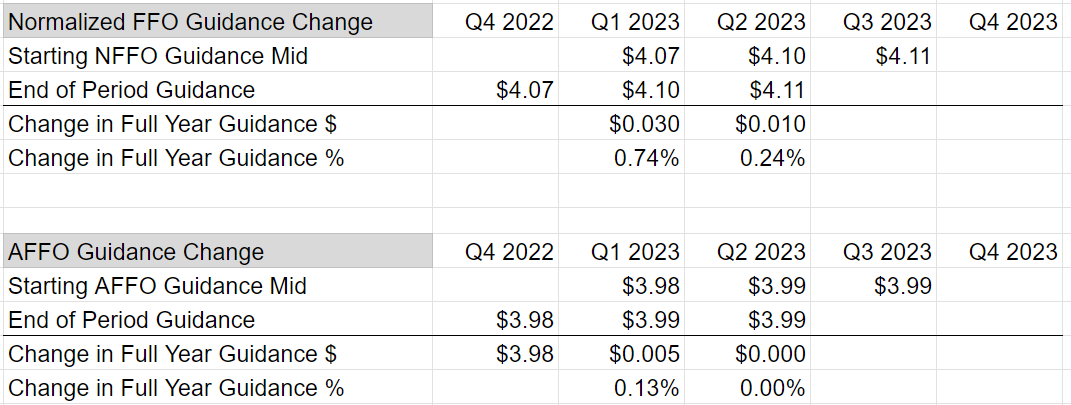
You can see that Q1 2023 also saw a modest increase in guidance for normalized FFO. AFFO guidance increased by half a penny in Q1 2023 but no change in Q2 2023.
When it comes to year-over-year growth, O is expecting a bit over 1% growth:
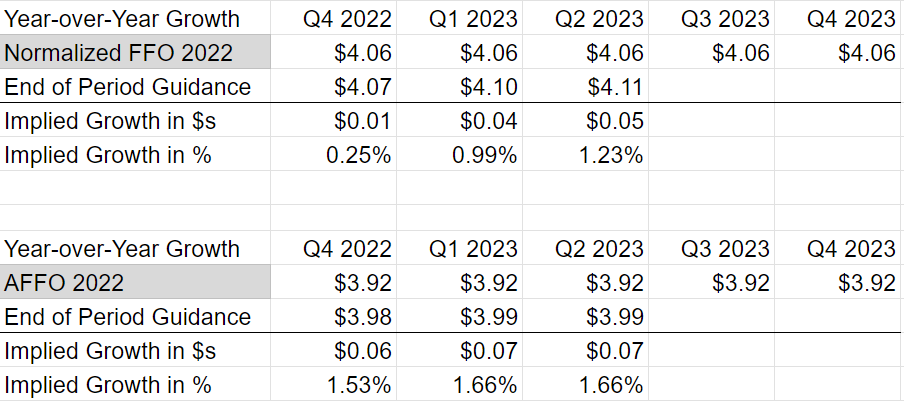
That’s not bad, but it’s not great either. It’s important to remember that net lease REITs use quite a bit of leverage. Consequently, a change in interest rates can have a substantial impact.
Between the end of Q4 2022 and the end of Q2 2022, the increase in interest rates on Realty Income’s variable rate debt (from 3.59% to 5.0%) represents a drag of $.05 to $.06 per share on an annualized basis.
That’s not factoring in the additional debt that was issued. It is only the impact of higher rates on the remaining variable rate debt. If rates were not increasing, growth could be quite a bit better. That would be an extra 1.25% to 1.5% in the growth rate.
Debt
Realty Income has been locking in interest rates on a larger portion of its debt profile.
Total debt increased:
- End of Q4 2022 total outstanding debt: $17,935.5 million
- End of Q2 2023 total outstanding debt: $19,538.4 million
- Increase of $1,602.9 million
Variable-rate debt decreased:
- End of Q4 2022 total outstanding debt: $2,729.0 million
- End of Q2 2023 total outstanding debt: $2,568.9 million
- Decrease of $160.1 million
Consequently, variable rate debt is down quite a bit relative to total debt:
- End of Q4 2022 variable rate debt was 15.216%
- End of Q2 2023 variable rate debt was 13.148%
- The percentage of total debt was down 2.068%.
However, the average rate on debt increased primarily because new fixed-rate debt had to be issued at higher rates.
- End of Q4 2022, the average rate was 3.476%
- End of Q2 2023, the average rate was 3.761%.
The reason Realty Income keeps issuing fixed-rate debt around 5% is because management wants to be very active on acquisitions.
Acquisitions
Realty Income raised guidance for acquisitions again:
For reference, the equity market capitalization for Realty Income is around $40 billion. Therefore, buying $7 billion in real estate during the year is a substantial amount.
Equity Issuance
Realty Income is issuing equity through its ATM (at-the-market) program and through forward equity agreements. Looking at the last 3 quarters:
- Q4 2022: $2,200 million raised via ATM at $65.71
- Q1 2023: $804.4 million raised via ATM at $63.31
- Q2 2023: $2,200 million raised via ATM at $61.89
They were also using their forward equity agreement to issue even more equity. Consequently, O has issued quite a bit more than $3 billion in equity year-to-date and more than $5.2 billion since Q3 2022 ended.
Their goal is to issue equity and debt with the proceeds used to fund acquisitions. This is regularly accretive for shareholders. However, as rates move higher and share prices move lower, the accretive impact is reduced.
Note: In August 2023, Realty Income filed for even more shares to be sold.
Accretion
A significant portion of Realty Income’s AFFO growth over time has been related to acquisitions. The accretive effect shrinks with lower share prices and higher interest rates, unless the cap rates on acquisitions increase.
Here’s my quick math for a few scenarios:
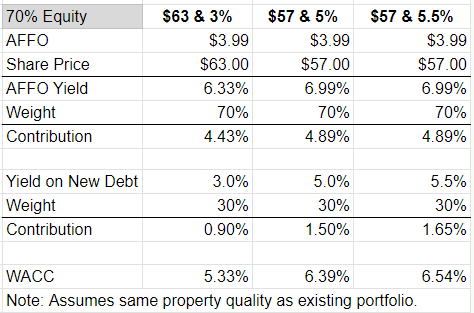
However, I also wanted to look at scenarios where Realty Income uses a bit more debt and less equity.
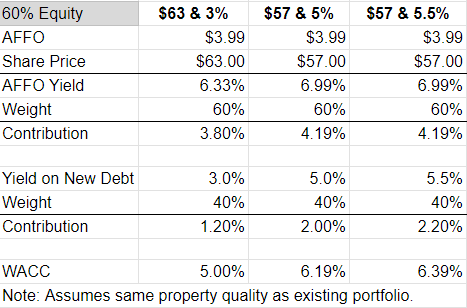
As interest rates go up, Realty Income needs a higher cash yield on new properties to remain accretive. In Q2 2023, the cash yield on acquisitions was 6.9%. That’s high enough to still have a material accretive impact.
If you have ever wondered why the company is always issuing new shares, this is why. The accretive impact over time may actually be a tiny bit better than indicated above. That’s because Realty Income may be able to negotiate for slightly higher rental escalators today. We’re looking at the cash yield on the first year, but higher escalators would be another benefit. However, unless they are dramatically higher, this escalator impact probably isn’t enough to be a big factor in analysis.
Dividend
The current rate is $.2555 per share per month. Annualized that is $3.066. That’s easily covered by AFFO. No concerns about Realty Income’s ability to cover its dividends. Based on revenue growth (1.25% minimum for same-store) and the interest rate headwinds, I think it would be prudent to grow dividends at a relatively slow rate for a bit. However, if O wants to, they could push the payout ratio a bit higher to demonstrate faster near-term growth.
Conclusion
It was a moderately good quarter for Realty Income. I would rate the quarter as a 6.5 or 7.0. Guidance was only increased slightly. However, the yield curve moved during Q2 2023 to imply higher average rates in the second half of the year.
Consequently, the projected full-year interest expense on variable-rate debts is higher. Likewise, the projected interest cost for debt issued to financed acquisitions would be higher. Since Realty Income fuels growth through acquisitions, their exposure to interest rates can be greater than the variable rate debt and maturities would suggest.
Against those headwinds, a tiny increase in guidance should be seen favorably. It’s not much, but it was achieved during a rough period. Unfortunately, interest rates so far in Q3 2023 have been unfavorable. That makes the rest of the year tougher.
Based on exposure to interest rates reducing my expectations for near-term AFFO growth, I expect modest / moderate reductions to targets. That will most likely be the case throughout the net lease REITs.
Disclosure: No position in any of the net lease REITs presently. I do not expect to start any positions in the near future.
If you enjoyed my work, please consider sharing it or hitting the heart icon to help more people discover it.
The REIT Forum is a reader-supported publication. To receive new posts and support my work, consider becoming a free or paid subscriber.
Member discussion