O & MAA Q1 2024 Update
- Slightly positive updates for both REITs.
- Despite rates going higher, Core FFO per share guidance was maintained in both cases.
- Headlines about Realty Income's revenue are misleading.
- MAA is explicitly projecting that the leasing environment will recover over the next few quarters and then remain strong through at least 2028.
Realty Income (O) reported Q1 2024 results.
The headlines are misleading.
On FFO per share, Realty Income did beat by $0.01. That may involve a bit of a rounding error though.
Revenue was solid, but not as insane as the headlines sound.
Depending on your source, you may see consensus estimates of $1.10 or $1.20 billion.
Realty Income’s rental revenue was $1.208 billion:
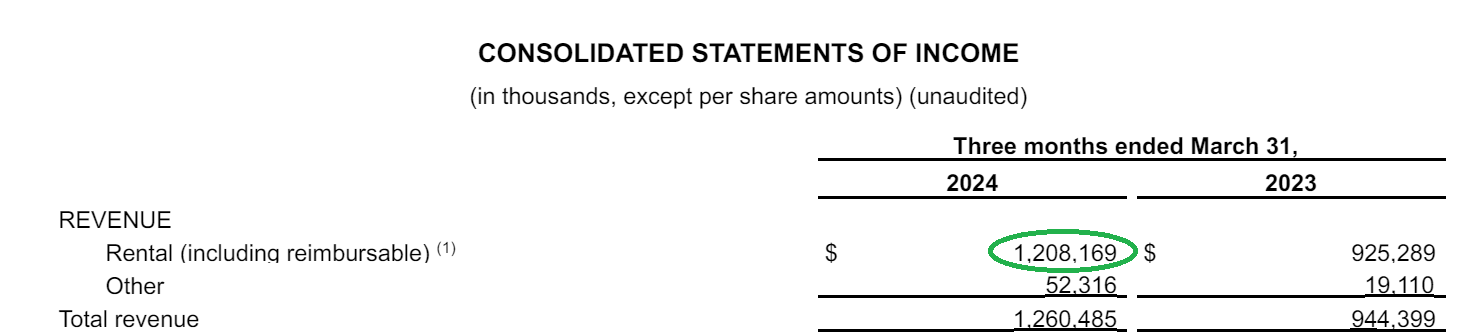
If we use $1.20 billion for the consensus estimate, then it was a slight beat with $1.21 billion of rental revenue (rounded up from $1.208).
If we use $1.10 billion, then we’re including some analysts who didn’t update their models for the merger (with Spirit Realty) closing.
The merger drove revenue, interest, and shares outstanding much higher.
I created a simple table for year-over-year comparisons and quarter-over-quarter comparisons:
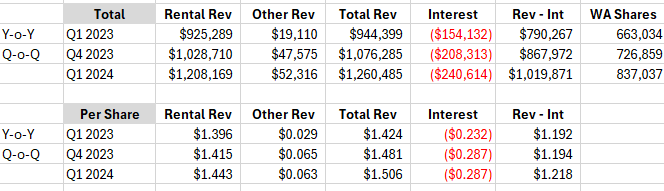
The total numbers grew quite a bit.
However, you can easily see that the per share figures only grew slightly.
You can also see that higher interest expense was a challenge.
Same Store Revenue Growth
I really appreciate Realty Income breaking down same store revenue growth by property type:
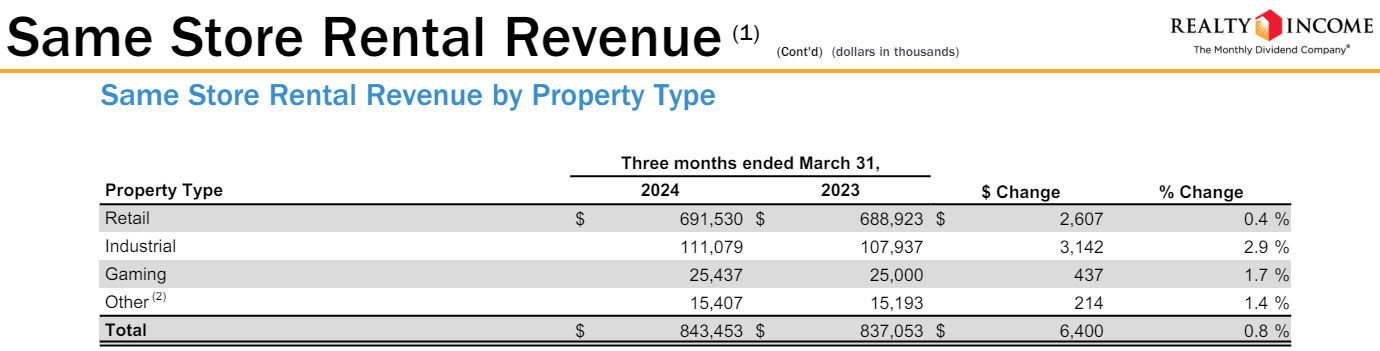
You can see that retail same store rents for retail properties (which are most of Realty Income’s portfolio) are barely rising. On the other hand, industrial rents are rising faster. That makes sense.
Industrial leases should:
- Contain bigger annual escalators
- Have more favorable spreads on new leases
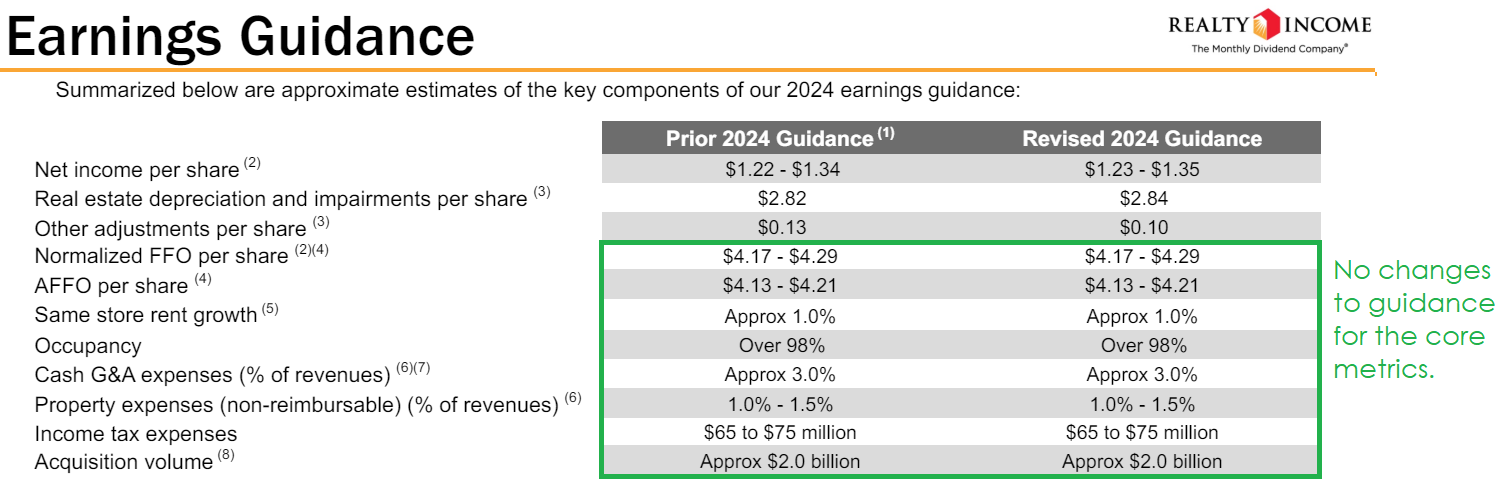
Guidance
None of the changes to guidance were meaningful. Every important category is unchanged.
Conclusion
Nothing particularly stands out for the quarter except the headlines about Realty Income beating on revenue.
This is what investors should typically expect from Realty Income. Net lease REITs are typically the easiest to model.
They have the most consistent cash flow profile because of those extremely long net leases.
No surprises here. Slightly positive update given interest rates.
Mid-America Apartments Communities
Mid-America Apartments Communities (MAA) reported first quarter results and updated guidance.
The guidance updates were very minor.
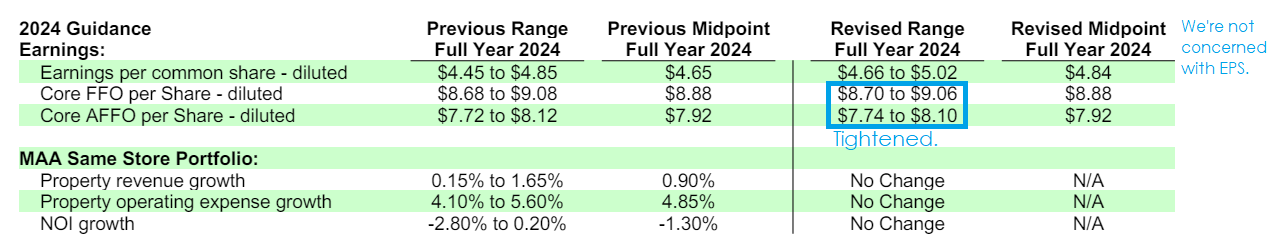
MAA tightened the ranges for:
- Core FFO per share (midpoint $8.88)
- Core AFFO per share (midpoint $7.92)
No change in the midpoint. The range was just tightened.
All other guidance metrics were reiterated at the exact same level.
Our MAA Q4 2023 update went into extensive detail. With guidance essentially unchanged, the prior update remains up-to-date.
Property Expense Growth
The headwind coming from property operating expenses isn’t just insurance and or property taxes. MAA is also experiencing some slight increases in repairs and personnel expenses (normal given inflation) and some additional marketing costs. The marketing expense makes sense given the extra supply hitting some of MAA’s markets.
In other words, part of the headwind should fall off over the next year or two.
There were a few things that stood out to me on the earnings call.
Earnings Call - Pressure Easing
Management is standing firm on their expectation for same-store headwinds to ease a couple quarters earlier than I was expecting.
“While we do expect this new supply will continue to pressure pricing for much of 2024, with demand and leasing traffic expected to increase in the spring and summer, we believe we have likely already seen the maximum impact to new lease pricing and that the outlook is better for late 2024 and into 2025. It varies by market, but on average, new construction starts in our portfolio footprint peaked in early to mid-2022. And we've seen historically that the maximum pressure on leasing is typically about two years after construction stops.”
Note: Transcripts incorrectly end that quote with “after construction store.” That wouldn’t work as a sentence. Management clearly said “stops” on the earnings call.
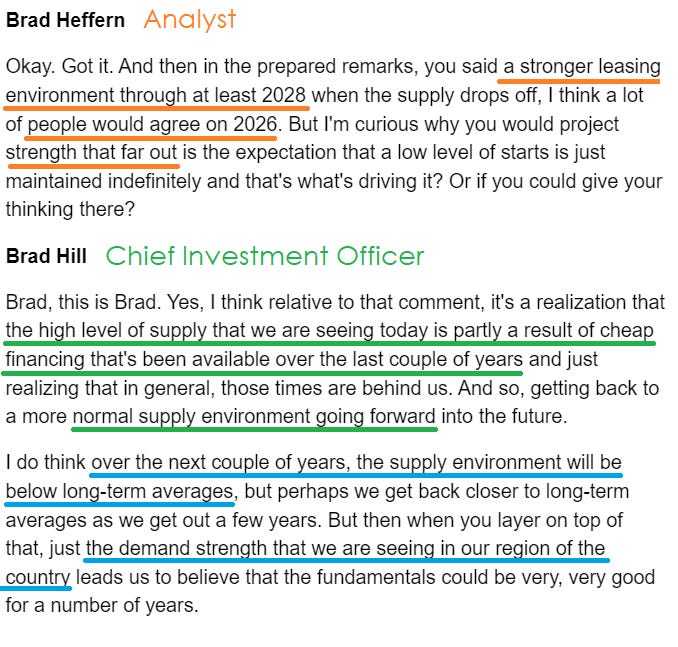
Stronger Leasing Environment Through 2028
We have been forecasting a better leasing environment (for landlords, sucks for renters) from 2026 through 2028 and possibly longer.
Management explicitly supported those projections:
“In preparation for what we believe will be a stronger leasing environment in 2025 through at least 2028, we continue to make progress in putting our balance sheet capacity to work to deliver future earnings growth.”
That commentary resulted in the following exchange:
While higher rates are supposed to curb inflation, a major source of inflation was rising rents.
- Lower rates created a sharp increase in new apartment construction. More supply.
- Higher rates created a sharp reduction in new apartment construction. Less supply.
Cap Rates
The next thing to consider is management’s commentary on cap rates.
This helps us evaluate the value of real estate.
For deals MAA was tracking:
In Q4 2023, the average cap rate was 5.4%.
In Q1 2024, the average cap rate was 5.1%.
That’s a positive sign for the fair market value of apartment buildings.
MAA is also engaged in some development projects. We’ve criticized that before because buying back shares is such a low-risk method for improving value.
However, MAA is focused on developing because there is still a built-in profit margin on development.
MAA is expecting the stabilized NOI yields to run around 6.5% on their development projects. That’s materially higher than market cap rates, indicating that there is still a reasonable profit on some development projects.
However, there is also a downside. Going from a new project to stabilized property typically takes at least 3 years if not a bit longer.
That cuts into the advantage for development.
I would still prefer to see MAA using buybacks and retaining their land bank for development after prices have stabilized at a higher level.
Regardless, it’s not like MAA is wasting capital. They are still earning a very respectable return on those investments.
More Charts
I have some sheets we’ve been building out for comparisons between the REITs.
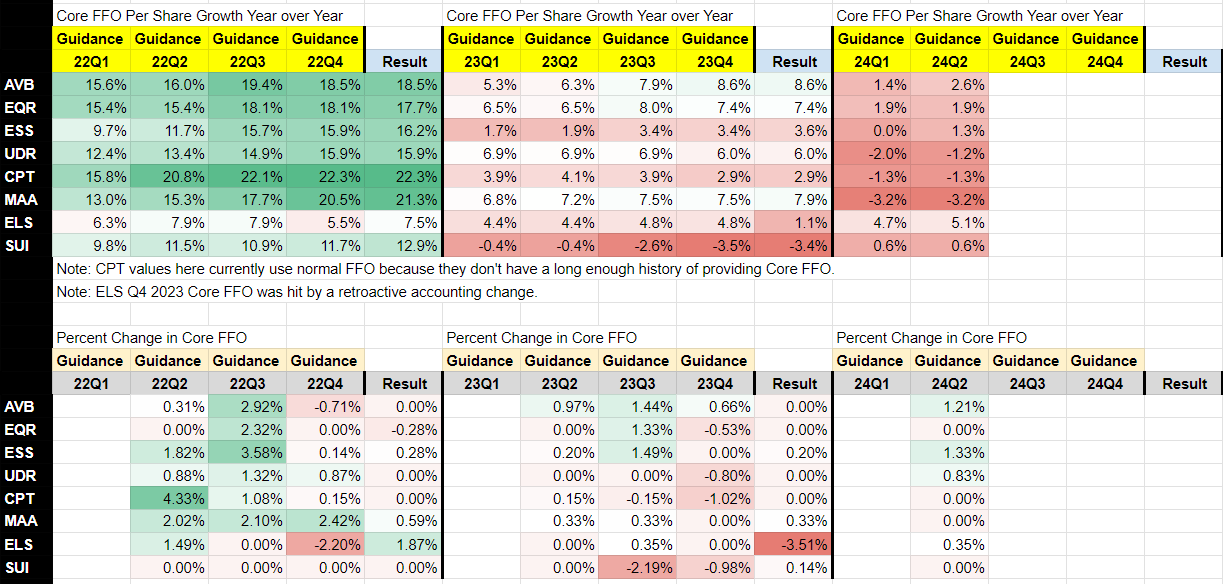
The first section of this table measures growth in Core FFO per share. The five figures in each year are:
- Guidance at the start of Q1
- Guidance at the start of Q2
- Guidance at the start of Q3
- Guidance at the start of Q4
- End of Year Result
Therefore, you would expect a big swing between the “Result” for one year and the “Guidance” for the subsequent year.
We’ve color-coded the section so the biggest numbers are green and the lowest numbers are red.
You can easily see that growth was:
- Insane during 2022.
- Moderate during 2023.
- Projected to be low for 2024.
The peak in share prices (worst time to buy) was in early 2022. That was a bit before the peak in Core FFO per share growth.
The second part of the chart shows the change in guidance. We can use this as a proxy for evaluating when a mid-year announcement was positive or negative. Among these REITs, there were zero reductions to guidance for Core FFO per share. That’s positive, seeing as interest rates increased. All else equal, it would’ve been understandable to see a slight reduction.
Conclusion
The quarter for MAA wasn’t particularly good or bad.
Core FFO per share for Q1 2024 was $2.22. That was $.02 above the middle of their guidance for the quarter. But they attributed the strength to the timing of expenses. Essentially, a tiny bit of Core FFO per share was pulled forward from Q2 2024 into Q1 2024.
The biggest notes here are that MAA:
- Still projects the leasing market to improve slightly ahead of our projections (positive for them).
- Explicitly forecasts a stronger leasing market running through at least 2028 (matching our expectations).
Slightly positive update given interest rate headwinds.
Member discussion