ARE: Q4 2023 Diving into Alexandria's New Guidance
Alexandria Real Estate (ARE) $ARE announced Q4 2023 results:
- Occupancy: 94.6% (that’s good).
- 2023 Q4 FFO as adjusted: $2.28 per share (consensus $2.29)
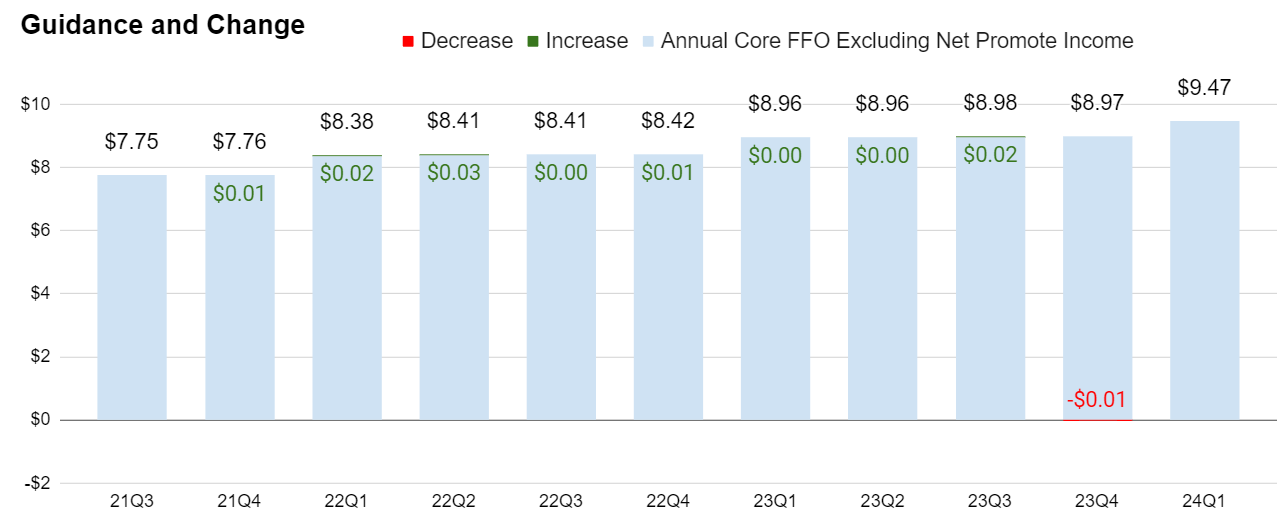
- 2023 Full Year FFO as adjusted $8.97.
Important Definition Time
Sorry to be opening this up with a vocabulary lesson, but I need readers to understand the words I’m using.
“FFO as Adjusted” is most comparable to:
- Normalized FFO
- Core FFO
- FFO (for consensus estimates)
You absolutely must not rearrange the words to create “Adjusted FFO”. That would lead to calling it “AFFO”. This is NOT an AFFO metric.
AFFO includes adjustments for certain non-cash items. Specifically, recurring capitalized expenditures, straight-lined rents, and market rents. Those are generally the important 3 adjustments for going to an “AFFO” metric.
The metric Alexandria reports is an FFO metric, not an AFFO metric.
There is nothing wrong with that practice. Further, I support all the adjustments Alexandria makes to create a more useful “FFO” metric. Just don’t confuse this with AFFO.
The AFFO figures will be lower, which is perfectly fine. We build our spreadsheets and most of our models using AFFO numbers. However, there is nothing wrong with using FFO growth rates as part of the evaluation process for Alexandria.
If you enjoyed this article despite the accounting lesson, consider sharing it with a friend:
Same Property Net Operating Income
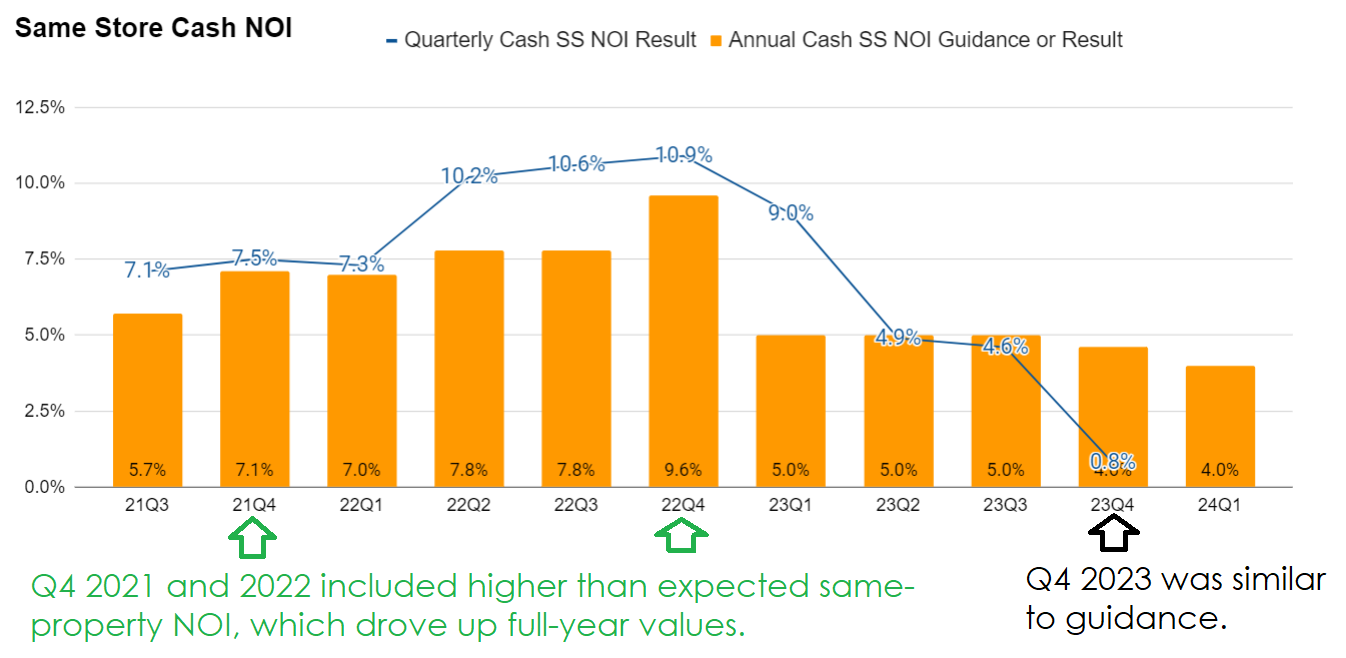
In 2021 and 2022, Alexandria delivered much better than anticipated results for same property cash NOI in the fourth quarter.
Consequently, same property cash NOI came in hot for each of those years.
In 2023, that wasn’t the case. Same property cash NOI was weaker, which brought full-year results down to land within the guidance range.
The same property NOI for Q4 2023 was a bit of an aberration. It was still positive, but it was weaker than we usually see from Alexandria.
They told investors to expect that during the Q3 2023 earnings call though.
Here’s the foreshadowing:
We do expect our fourth quarter same-property results to be somewhat impacted by the timing of free rents and some temporary vacancy, including a hundred thousand square foot lease termination in the fourth quarter, by our tenant Atreka at our, San Carlos mega campus.
Important to note that we don't expect any income to be recognized on this space for same-property purposes in the fourth quarter, since termination fees are excluded from our same-property results. The good news is that we have a signed LOI (Letter of Intent) with a new tenant to potentially take that space as early as December.
I appreciate that ARE strips termination fees out of same property income. The interesting thing here could be that ARE keeps those properties within the “same property” pool. Such properties might be excluded by other REITs when announcing same property results (if they don’t try to include lease termination fees).
The decision to exclude lease termination fees from same property NOI also explains the disconnect between the lower growth rate for same property NOI and the strong NOI margin (calculated at 70.01%). Normal NOI margin for Alexandria is around 69.3% to 69.8%.
Guidance
- 2024 Full Year FFO guidance midpoint $9.47 ($9.37 to $9.57). Just over $9.46 consensus.
- Projected 2024 growth rate: 5.57% (from $9.47 / $8.97)
- Same Property NOI (Net Operating Income) guidance: 0.5% to 2.5% for GAAP and 3% to 5% for cash.
- Combining Q4 2023 results ($.01 below consensus) and guidance ($.01 above consensus), results are not surprising.
Cash same property NOI still looks good. It’s coming down a bit from higher levels seen in some prior years. However, it’s still solid. Plenty of sectors that would be quite happy to be guiding for 3% to 5% in cash same property NOI growth for 2024.
Much of that growth comes from 96% of leases containing escalators around 3%. That’s held pretty steady for quite a while. Therefore, ARE is typically getting 3% escalators and yet rent has grown quickly achieve that they can still achieve respectable leasing spreads.
Guidance for leasing spreads is a bit lower. Guidance for 2024 is for 11% to 19% GAAP leasing spreads and 5% to 13% cash leasing spreads. The cash spreads are the ones that compare the final rental rate on one contract with the first year of the next contract.
The leasing spreads are coming in relative to the prior several years, but we didn’t expect those to last indefinitely.
Other Notes
To keep things in perspective, remember that ARE is trading around $123. That was a typical price for ARE stock in 2017. Compared to 2017, ARE is generating significantly more cash flow for shareholders. This is a stronger company today than it was in 2017.
In 2017, FFO per share was $6.02, and guidance for 2018 was $6.55 per share.
In 2023, FFO (as adjusted) per share was $8.97 and guidance for 2024 is $9.47 per share.
Note: We changed from using FFO to “FFO as adjusted”. I’ve reviewed the adjustments ARE makes to reach “FFO as adjusted”. I’m not bothered by any of them. These are appropriate adjustments to keep results comparable.
Charts
I have a few charts to share.
The first one shows the change in guidance for each quarter. You’ll notice ARE has been very steady with their projections.
The next chart compares the cash leasing spreads and vacancy rates. Generally, low vacancy should enable stronger leasing spreads:
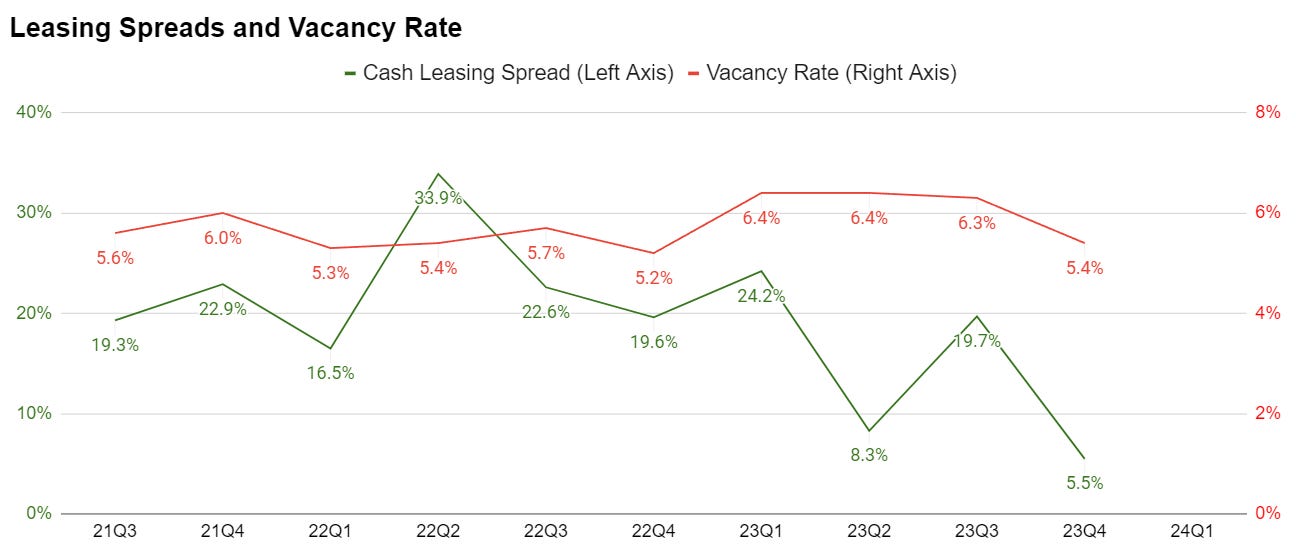
In this case, I need to highlight the results for Q4 2023. The dip in the vacancy rate was surprising to me. I went back and checked it multiple times. However, I want to focus on the reduction in the cash leasing spreads. This was attributed to replacing a tenant only 3 years into a 10-year lease. That one location had a negative 4.1% cash leasing spread. That’s hardly a “disaster”. However, it does negatively impact the figures for the quarter. If that one location was excluded, the cash leasing spreads would’ve been 9.7% for Q4 2023.
Same property NOI, (also called same store NOI) didn’t have the positive surprise for Q4 that was seen in the prior years. It’s worth recognizing that they were lapping a pretty tough period from Q4 2022 and they are excluding lease termination fees.
Finally, I want to mention that Alexandria recorded some impairments. We will see these from time to time because ARE has some office buildings that were purchased because ARE wanted to redevelop the property (into biotech lab space). Thanks to a higher WACC (weighted average cost of capital), some of those development projects are no longer appealing. Rather than pushing ahead with development, they are selling off some of the properties. Office buildings generally don’t command great prices today, so we’re seeing some impairments as part of the sale process.
On one hand, investors will be sad about having any exposure to office real estate. On the other hand, ARE is unloading its weakest assets while still generating healthy growth in FFO per share. That’s an impressive combination. Selling off some of the weakest assets will generally result in higher cap rates and be dilutive to FFO, but ARE still has a respectable growth rate.
Rating: I’m looking at a 6.5 or 7.0 on the release. The headline metric is AFFO per share. They were a penny under consensus for Q4, but a penny over for guidance. No positive surprises for leasing spreads, but the numbers aren’t really weak either. Alexandria simply continues to chug along.
Member discussion