Orchid Island Capital Fails at Math

AGNC Investment Corp. (AGNC) and Orchid Island Capital (ORC) are both agency mortgage REITs.
They have a great deal of overlap in their assets.
They have some similarities in their exposure to interest rate risk.
Yet AGNC reports massive core EPS because of the way they structured their combination of assets and hedges. AGNC's earnings will be challenged in future quarters by higher interest expenses (absent huge changes in the macro environment), but the fact remains:
The reported results for these REITs appear vastly different.
A Little History
ORC is great at losing money.
They pay out a huge dividend, but their portfolio management decisions have been lackluster.
I have a bit of a history with ORC.
I had several great calls on ORC. At one point, ORC’s management even decided to highlight my work on an earnings call.
Well, “highlight” isn’t the right word. From their commentary, it appeared they hadn’t actually read the article.
They were thoroughly upset about a call that had already been proven accurate.
I predicted that news companies would run a headline declaring a “huge miss” on earnings because consensus analyst estimates were going to be compared to GAAP earnings per share.
I also predicted that as a tiny company with fewer informed investors, the bogus headlines would cause a significant dip in the share price.
Every part of the prediction played out correctly before management even started the earnings call.
Orchid Island Capital’s Awful Presentation
Since ORC and AGNC can be an interesting comparison, I went to pull some slides from both.
However, ORC’s presentation was so bad that the comparison was put to rest in favor of highlighting errors.
Hedging Positions - Slide 19
This slide shows up in ORC’s presentations and demonstrates the mark-to-market gain or loss on the hedging positions ORC employed throughout the quarter.
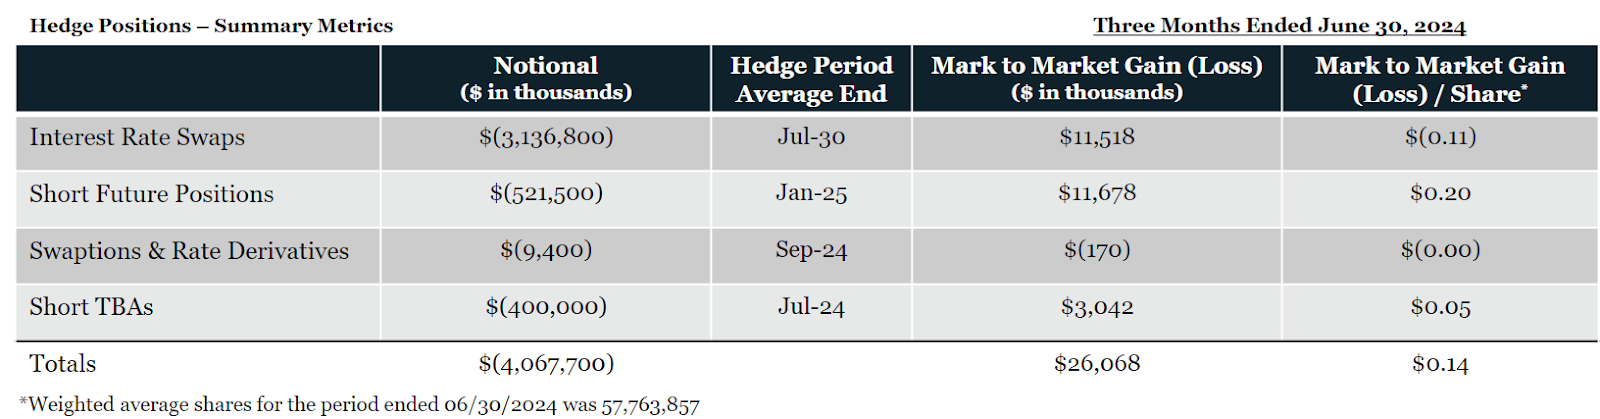
The problem here is that the numbers are wrong. Not all of them. But at least two of them are flawed.
I pulled the numbers from this slide from each quarterly presentation for the last 3 quarters and I put them into a spreadsheet.
See if you notice the problem:
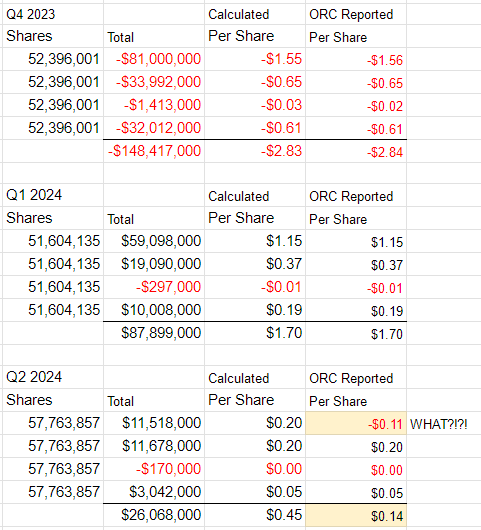
Did you notice that ORC somehow managed to declare a gain of $11.5 million and then turn that into a negative value per share?
Congratulations! You did a better job than whoever looked at this presentation before publishing it.
Someone did look at it, right?
It’s pretty easy to turn a “total” figure into a per-share number. Simply divide the total by the amount of shares.
If you have a positive total number and it turns into a negative “per share” figure, you can assume that your spreadsheet is broken and you shouldn’t publish those numbers.
The other quarters were included to demonstrate that ORC usually gets the value within a penny.
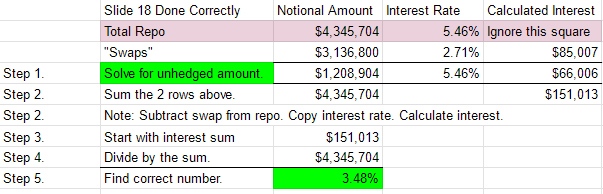
Investment Portfolio Funding Costs - Slide 18
Let’s talk about this image:
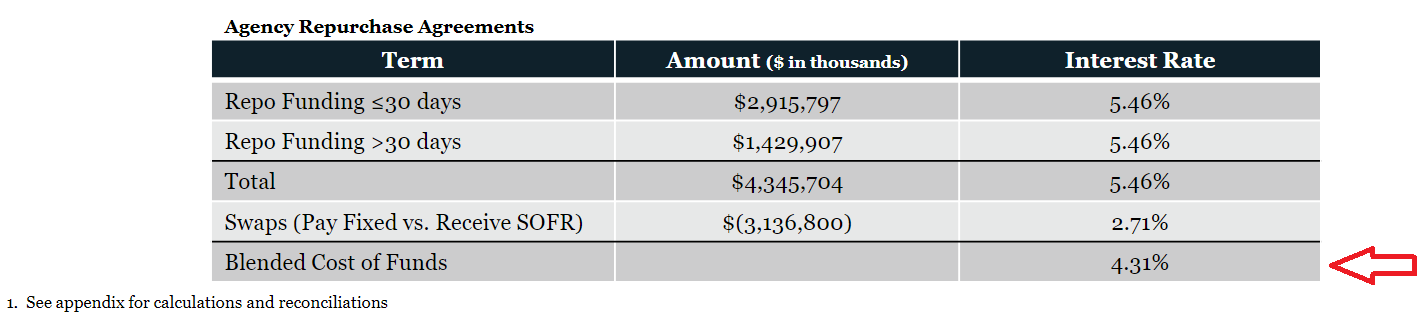
That’s not how you calculate a blended cost of funds.
Calculating a blended cost of funds was not hard, but it did take me a bit to figure out what they did wrong.
Like any community college student, they should demonstrate their work so the professor can spot where they went wrong.
Before someone points out that I should look at the appendix for calculations and reconciliations, I’ve got to ask:
“What do you think I did before preparing this article?”
If they demonstrated the error there, would I really skip over such a great opportunity to mock it?
Since we don’t have a demonstration, I can only speculate.
The calculations might have gone something like this:
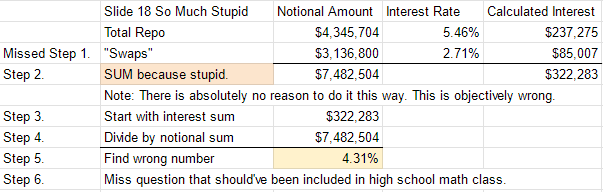
So what should Orchid Island Capital have done?
Get better management? Sure, thanks for taking the layup.
I will rephrase the question.
How should they have done the math?
They should have done this:
Of course, they also have the option of simply not reporting a “Blended cost of funds”.
But if they are going to report it, at least do the math right.
Economic Net Interest Expense - Slide 32
In slide 32, which is part of the appendix, we see a slide presenting “net interest expense”.
Mortgage REITs don’t have “net interest expense”. They have “net interest income”.
Even if net interest income is negative, it is still “net interest income”.
Here’s a demonstration of what it looks like if it is done incorrectly:
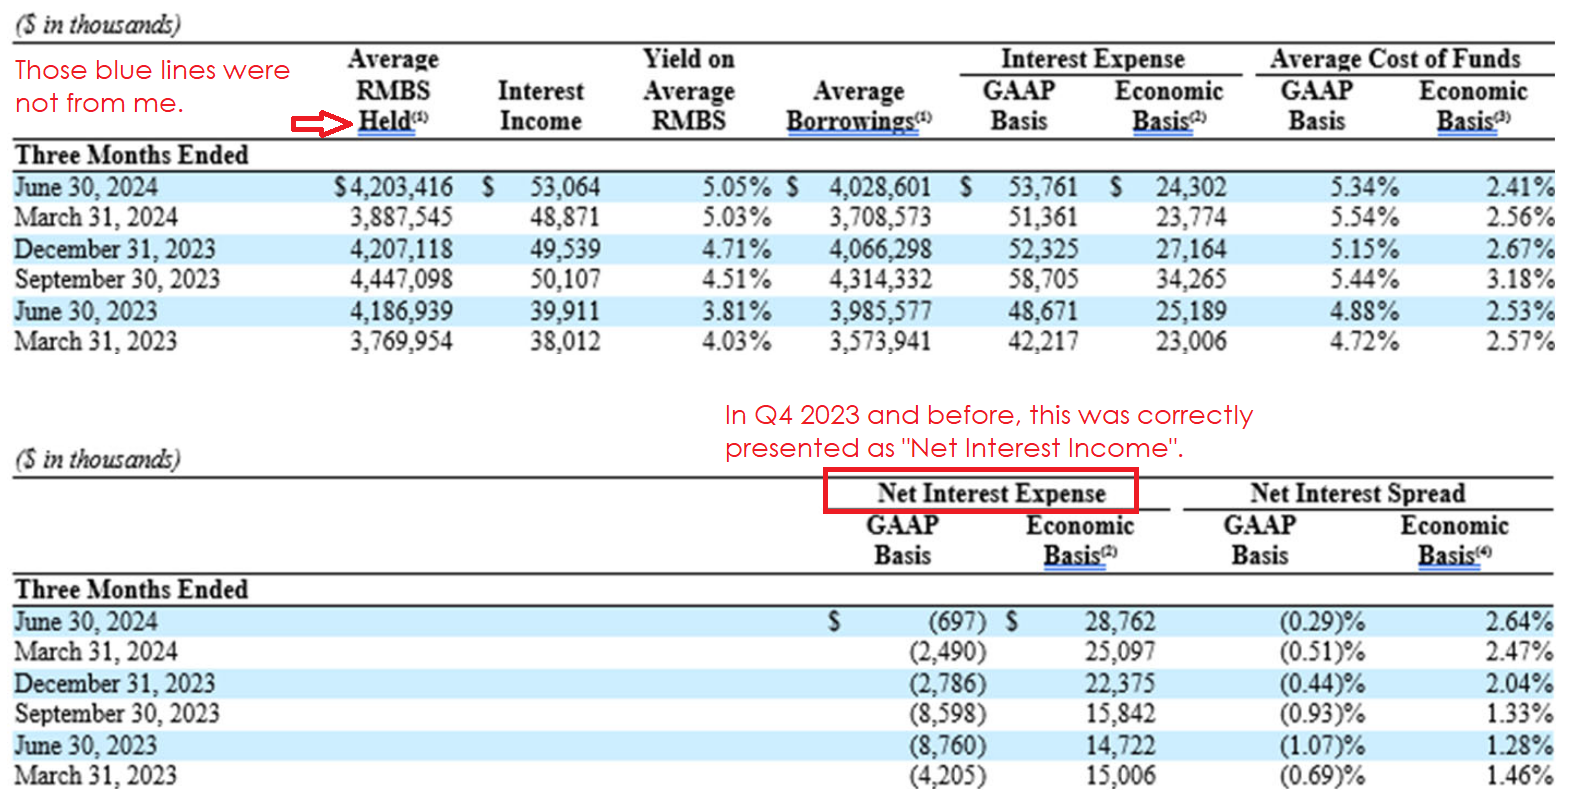
As an interesting note, the incorrect term and the blue lines started in the same quarter. Perhaps management ditched some software that was doing it accurately?
Respectfully, some readers may still think that management is right. Perhaps it makes intuitive sense for some readers to use “expense” when the value is negative.
That’s going to get crushed by pulling the relevant table from ORC’s 2024 Q2 10-Q:
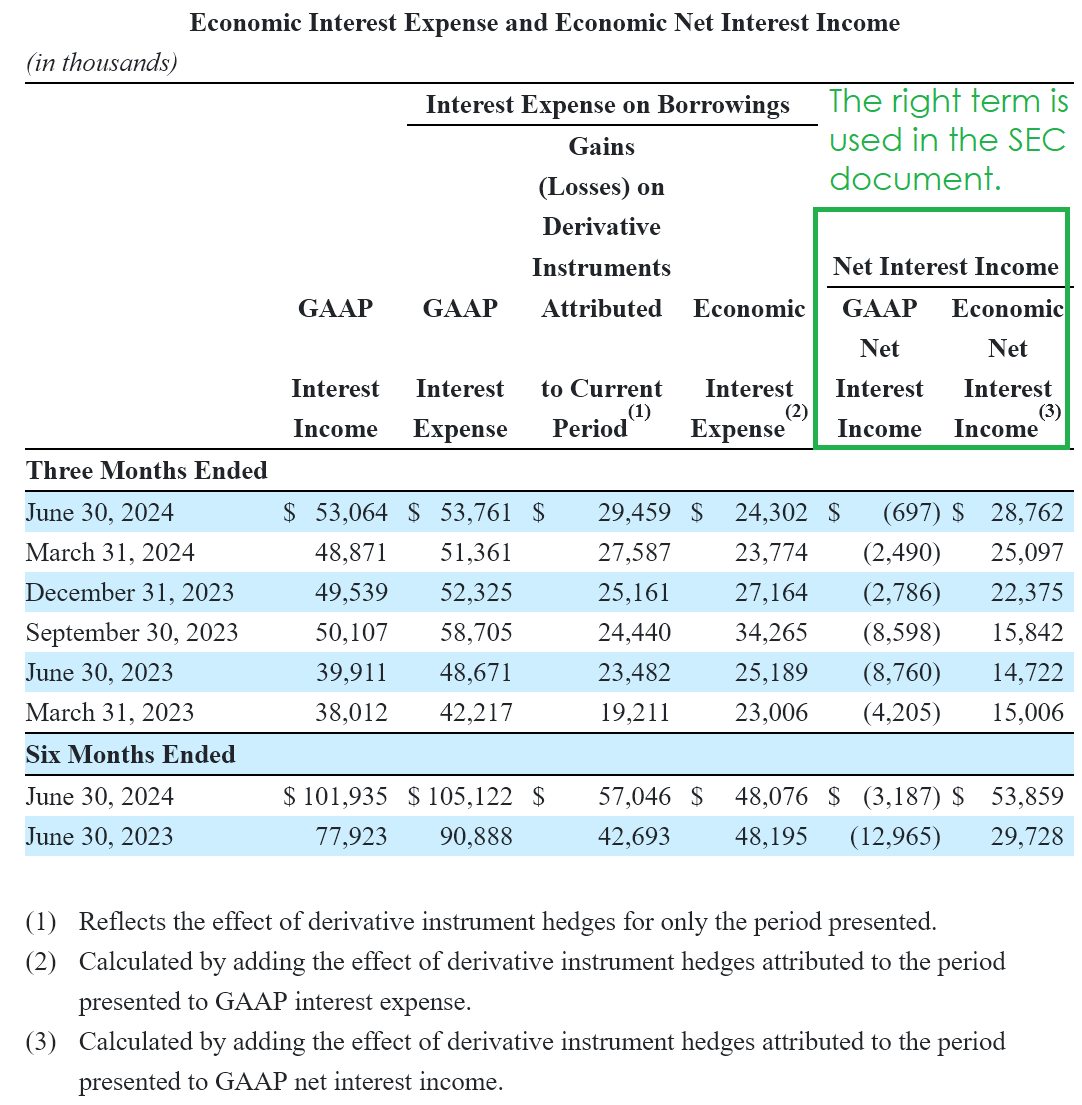
In the document that undergoes more legal scrutiny, ORC has the correct terms.
Are There More Mistakes?
I would think so. But I wouldn’t put in the time to go hunting for them. Those are the ones I stumbled across just looking for a few slides.
There are other issues I could bring up, but I think the point is clear.
ORC’s ability to create a presentation is only modestly better than its ability to stop bleeding book value.
Conclusion
Sometimes I get annoyed at analysts who don’t put in the work to actually verify the numbers used to support their thesis.
However, it’s also annoying when management signs off on a presentation that isn’t entirely accurate.
Perhaps understanding the numbers and terms well enough to produce a more accurate presentation would also help them manage the portfolio.
Maybe not, but isn’t it worth a try?
Member discussion