
Net Lease Updates: Treasuries Driving Net Lease Lower
Net lease REITs were among the last equity REIT sectors to get pounded. It “could” be viewed as their high dividend yields making them more attractive relative to bonds. However, that argument falls apart when we look at the history. Net lease REITs are generally more sensitive to interest rates than other types of REITs.
We're focused on:
- Realty Income (O)
- National Retail Properties (NNN)
- Agree Realty (ADC)
- W.P. Carey (WPC)
- Four Corners Property Trust (FCPT)
- Spirit Realty (SRC)
Price Change Since April
I contrasted valuations on 10/02/2023 to valuations on 4/12/2023. Why 4/12/2023? Because that’s the date of our prior net lease REIT update. I wanted to assess how much of the swing in share prices was due to a swing in 10-year Treasury rates.
- Old Rate: 3.39%
- New Rate: 4.66% (as of 10/02/2023)
- Change 1.27%
Note: Other Treasury durations (such as 2-year and 5-year) moved by a similar amount.
Here’s the change that actually happened, compared to the change implied by rates:
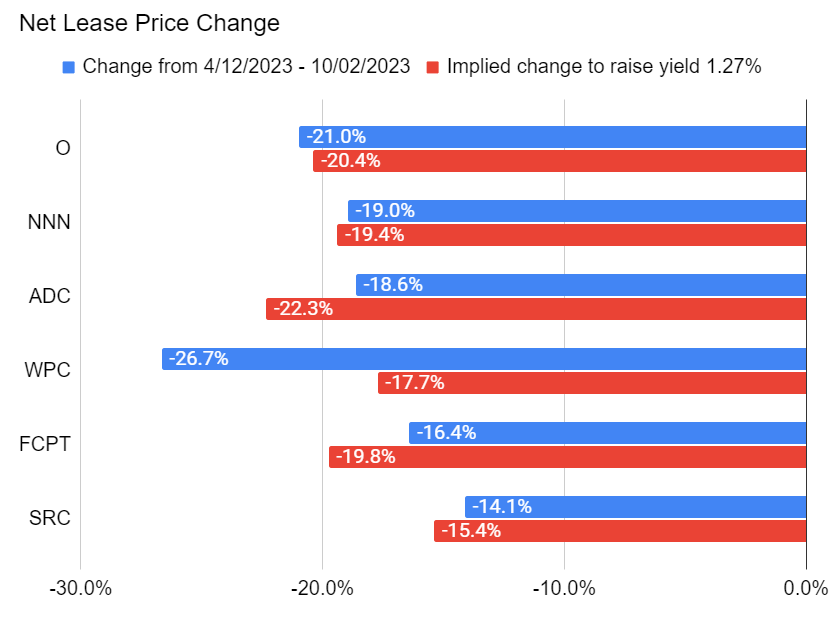
That’s remarkably accurate, isn’t it? You can adjust for WPC as being an outlier due to their stupid plan. Relative to the day before their announcement, they have dramatically underperformed the sector.
You may notice that the implied changes are much larger for some REITs than others. That’s one of the challenges with this method. It can result in really punishing REITs with lower yields and being more generous to those with higher yields.
Treasury to Net Lease Dividend Aristocrat Correlation
To find the correlation between Treasuries and net lease REITs, we want to focus on yields. I’m aware; this is probably the first time I’ve actually typed: “We want to focus on yields”.
We want REITs that fit certain criteria:
- Long history.
- Steady dividend growth (no cuts, no 25% raises)
- Regularly represents a large portion of “Analyst AFFO”.
Note: “Analyst AFFO” is similar to AFFO reported by many REITs, but it may require a couple of other adjustments to enhance quality. The adjustments are not relevant to this particular article.
Based on those criteria, Realty Income (O) and National Retail Properties (NNN) are great candidates. However, each has a drawback:
- NNN: Concentration by property type (retail). Could distort results with concerns about retail specifically.
- O: Dividend increase in February 2013 of nearly 20%. Distorts 2012 to 2013 trends by having a significant abrupt change.
I pulled the following metrics going back to at least late 2005:
- Treasury yields
- Dividend history
- Share prices
Using the dividend history and the share prices, I calculated the forward dividend yield based on annualizing the most recent ex-dividend date. Could this be more precise by using announcement dates? Maybe. Could we use the actual forward growth to account for multiple raises in a year? Sure, but the magnitude of future raises is not known in advance.
Would those changes make a material difference? No. It would be a tiny difference, so we’re keeping it simple.
The following chart has three lines:
- 10-year Treasury Yield
- O Dividend Yield
- NNN Dividend Yield
You’ll notice there is clearly a very strong correlation. I’ve highlighted the two major macroeconomic events during that period and the part where O raised the dividend by nearly 20%:
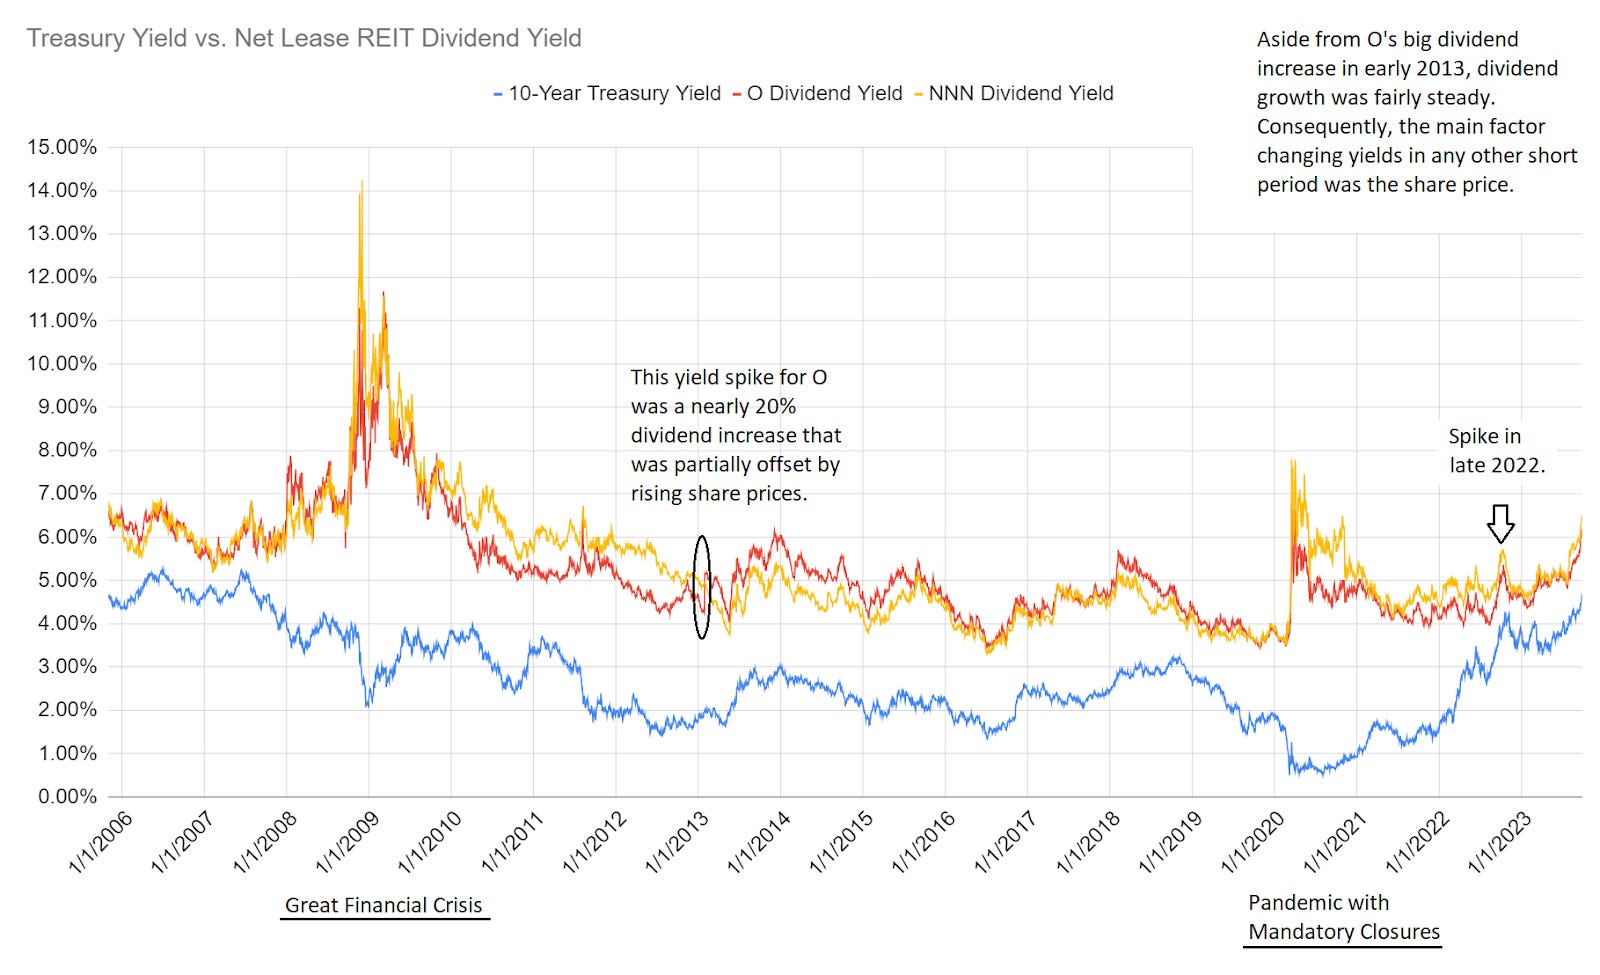
Outside of the GFC (Great Financial Crisis) and the pandemic, correlations were generally pretty strong. That should create some concern for investors with the surge in rates.
It wasn’t a big issue for most of 2022, which was a bit surprising when other REITs began to get pounded. By late 2022, we can see one spike in all 3 lines.
I use this as one of my metrics for evaluating when I’m more or less interested in net lease REITs as a subsector. We can really highlight this with a fourth line:
- O Minus Treasury (O’s dividend yield minus the 10-year Treasury yield)
In my opinion, this next chart is the heart of the article:
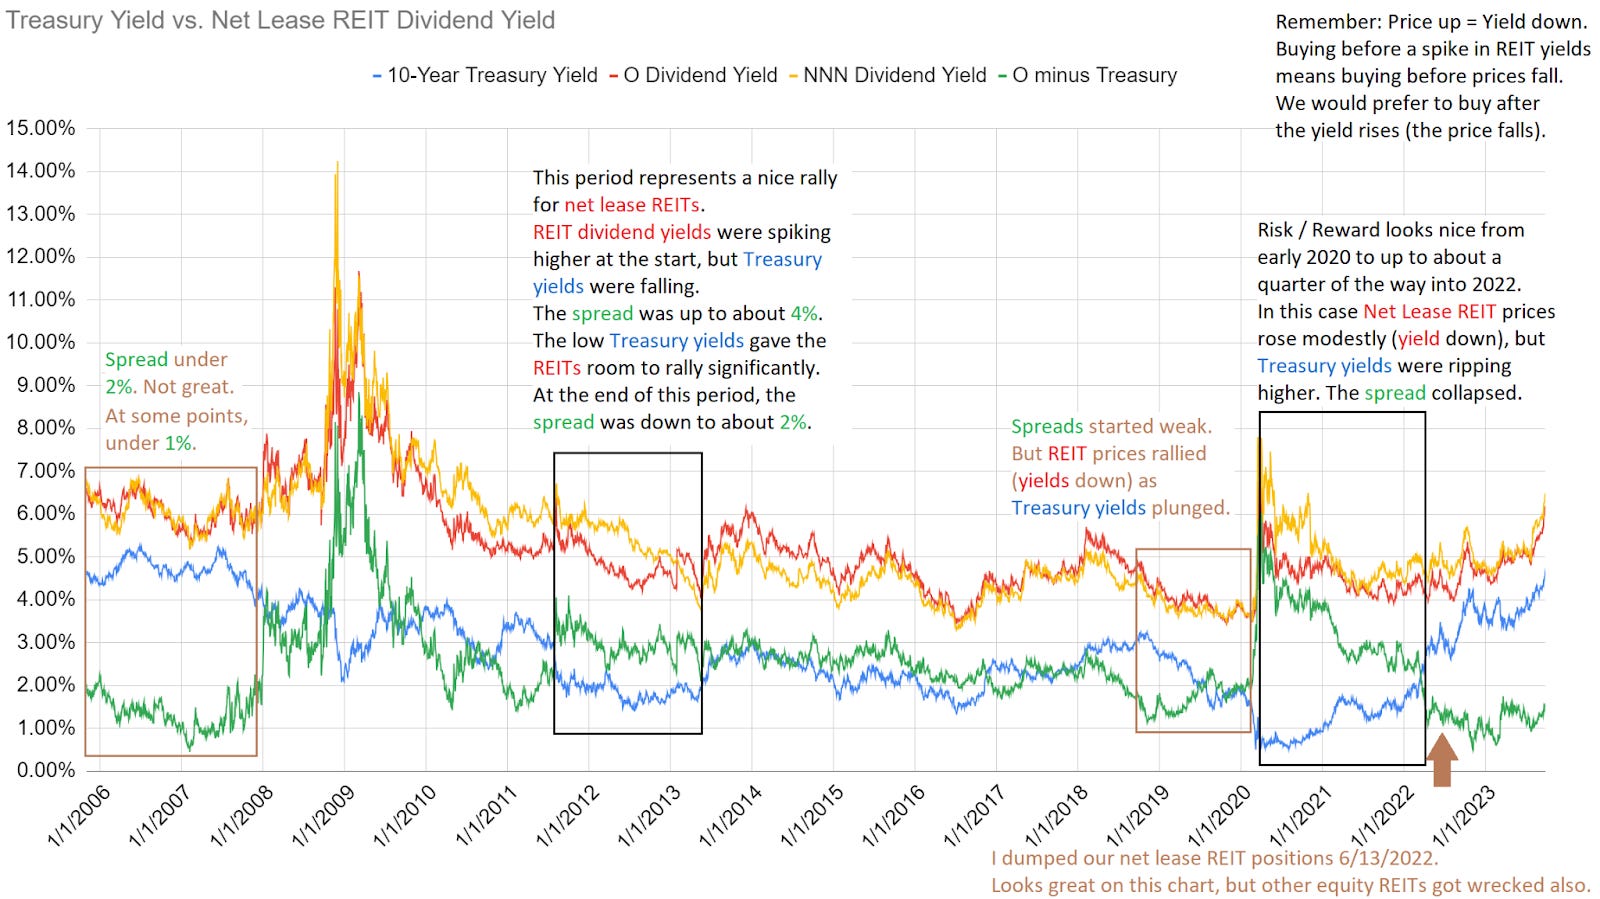
When the green line is high, the sector looks more attractive. When the green line is low, the sector looks less attractive (assuming O’s price isn’t severely out-of-line with peers). The line was remarkably low after the first few months of 2022. In June 2022, I decided it was time to move my capital.
Note: If we make all the relevant adjustments for the other net lease REITs, most would result in a comparable chart.
Do Other Types of REITs Do This?
Other REITs have some correlation with Treasuries, but it simply isn’t as strong as net lease REITs.
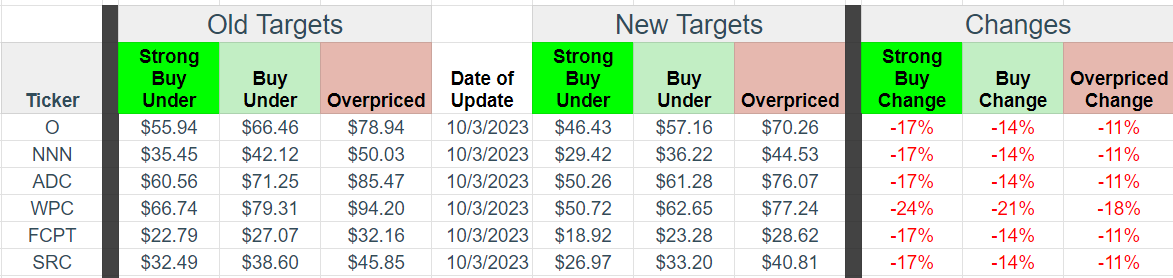
Target Updates
I always want to be incredibly precise on our target updates. However, the magnitude of the rally in rates requires updates across several sectors. Unfortunately, rates rallied during the LIBOR fiasco. I chose to focus on the fixed-to-floating shares because I like the risk / reward profile for many of those shares: Significant upside to call value and big dividend increases unless rates plunge.
However, the resulting situation requires hard choices. Do I spend the extra days to nail down the precise adjustments for each REIT? Or do I make the rough sector adjustments so I can proceed to the other updates faster? With earnings season approaching, I’m picking the second option. It’s better to have rough target adjustments here so I can quickly move on to the other sectors.
WPC’s plan required an adjustment to relative targets (WPC falling more than others), but I didn’t want to adjust only WPC since the whole sector needed updates for rates. To be clear, interest rates are the primary factor for all of the net lease REITs other than WPC. Even the 5 business days week saw another big increase, with most of it on October 2nd and 3rd.
There is no issue with the ability to collect rent. Nothing is forcing them to cut dividends. The issue is that higher rates will pressure external growth, and the current spread between dividend rates and Treasury yields is not particularly high.
Target reductions were foreshadowed in Realty Income’s Q2 2023 update.
At the time, I wrote:
Based on exposure to interest rates reducing my expectations for near-term AFFO growth, I expect modest / moderate reductions to targets. That will most likely be the case throughout the net lease REITs.
Back then, the 10-year Treasury yield was “only” 4.194%. As rates moved higher, a bigger modification to targets was warranted.
Alternative Viewpoints
Some investors have taken the stance that rates will continue upward almost indefinitely. I don’t believe that to be the case, but I’m not trying to call the top either. The technical factors today in bond markets look pretty concerning. When it comes to Treasury yields, I find momentum can be a useful predictor and the momentum is clearly pushing rates higher.
Remaining Wary
I would be particularly cautious with the net lease REITs until we see Treasury rates begin a trend lower and the spread between net lease REIT dividend yields and 10-year Treasury rates increases. We still have several other REITs that historically have less correlation to Treasury yields.
Disclosure
Long all stocks in CWMF’s Portfolio. No position in the net lease REITs since we closed them in June 2022.
Member discussion