
Negative Real Yields: The Standard For Two Decades
Summary Points
- Inflation is a touchy subject. Investors are surrounded by bad information.
- When we evaluate data using shorter time frames, we can spot the trends that are underway.
- Positive real rates were normal. That was before the 2000s. Over the last 20 years, we’ve had negative real rates the vast majority of the time.
- Contrary to some popular commentary, we almost certainly have positive real rates today. It is important to use the right measurement periods.
- The Federal Reserve Board could still push themselves into another hike. They didn’t need to, but they are creating the field of “egonomics”. Where ego drives policy.
Article Starts
Lately, I’ve seen an abundance of comments loudly promoting a basic misunderstanding of inflation and interest rates.
The most “liked” comments on Seeking Alpha have been falling into 3 categories:
- Misunderstanding monetary policy.
- Brief rant declaring other people (usually political) are dumb.
- Proclaiming Medical Properties Trust (MPW) is actually a great REIT and definitely not a yield trap.
The second two are not surprising, but how did misunderstanding monetary policy become so popular? Most people didn’t care about it in past years, but today they are emotionally invested.
The REIT Forum is a reader-supported publication. To receive new posts and support my work, consider becoming a free or paid subscriber.
Trigger Warning
The things I state here may contradict other things you’ve read on the internet. The great bastion of truth. The internet is the only place where nobody lies, everybody is an expert, and there are so many single women in your area.
Some people will hate this article for sharing the truth. Well, that’s fine. If I never offend anyone at all, I’m probably not writing much worth reading. Speaking clearly about misconceptions will offend people who are emotionally attached to their opinions.
Numbers Matter
I’m starting with a point that should be hammered home in schools. Numbers matter. Math is important. Numbers should often be portrayed in charts. Why don’t we have that in school?
Yeah, there are graphing calculators and equations. Okay, great. That’s not what I’m talking about. I’m talking about being able to read a chart and understand the connections behind the data.
Loose Definitions
I believe “inflation” gets defined too loosely. Often we use CPI, Core CPI, or sometimes PCE. Nothing is perfect, but oh well. I prefer CPI rather than Core CPI because people buy food and gas. Unfortunately, these indexes use a trailing value for housing data. That leads to two errors:
- When prices increase rapidly, the lagged housing data causes “inflation” to understate the change in market prices.
- When rental rates stop growing, the lagged housing data causes “inflation” to overstate the change in market prices.
We can isolate the impact using the following chart:
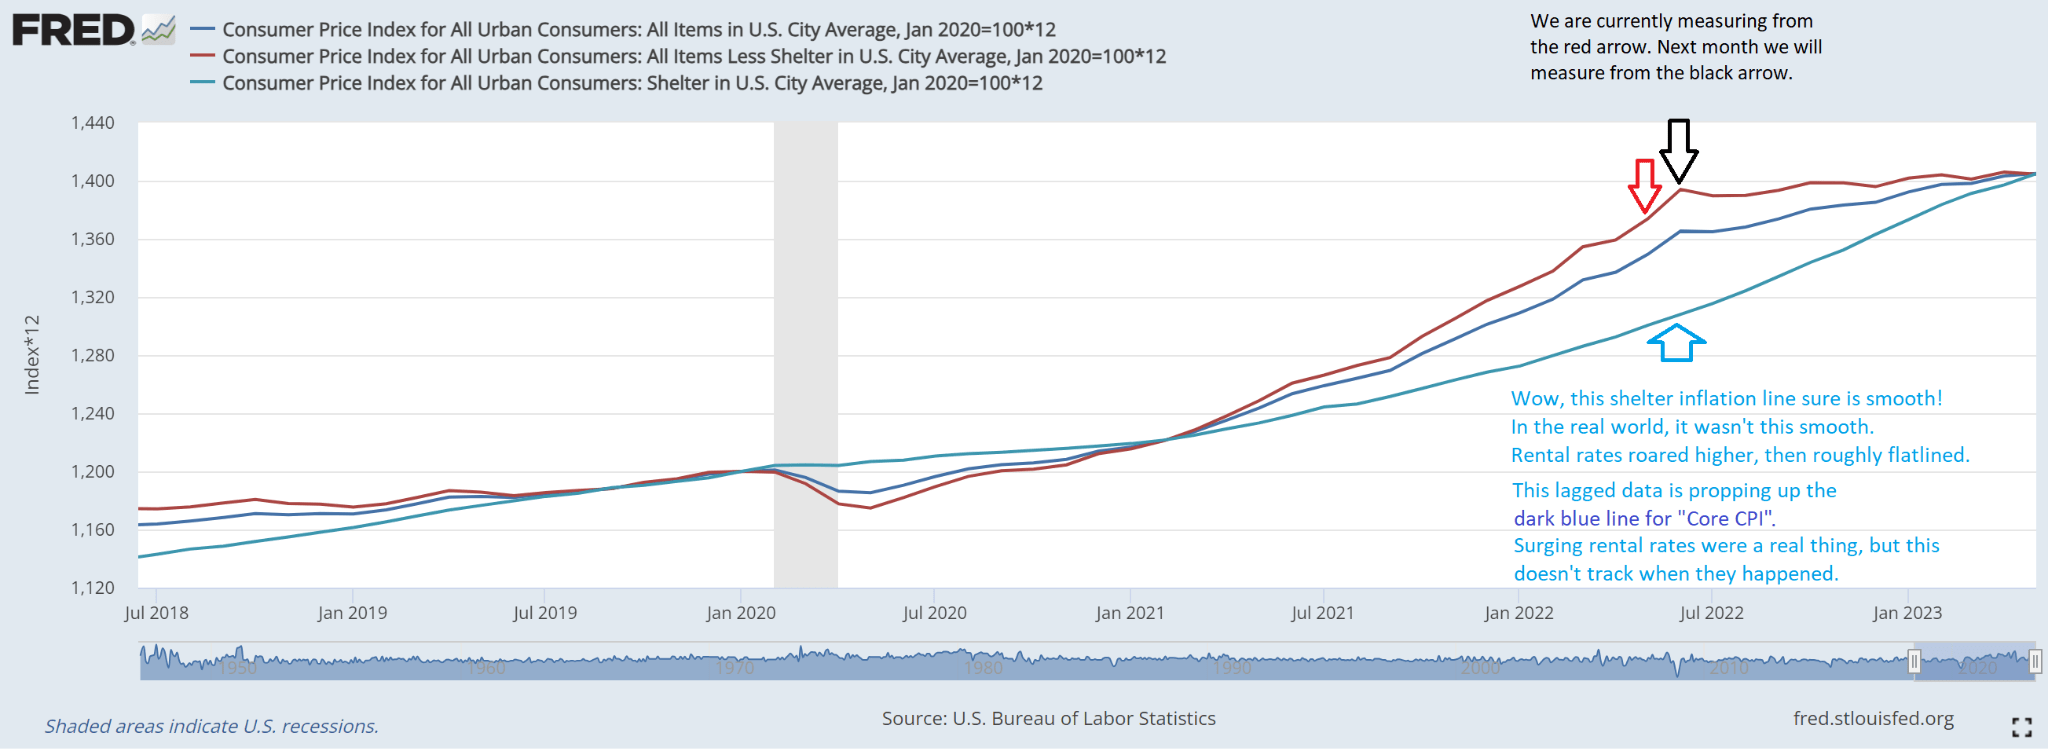
You’ll notice the shelter data was severely lagged. Consequently, it caused the CPI (dark blue line) to be much lower across most of 2022. If we excluded the lagged shelter data, then CPI would’ve followed the red line. We can see that CPI excluding shelter (the red line) spiked much harder, then barely increased since June 2022.
That is the more appropriate measure for market prices. We don’t want to exclude shelter, but it beats the alternative of including data we know is flawed. Since market rents were actually growing at a rate similar to the red line, the red line would’ve been a better estimate. It isn’t as good as including real-time changes in rent, but it would still be better than the lagged data.
Year Over Year is Bad
The next point is that we are still measuring with year-over-year numbers based on May 2022. As we shift to using June 2022, the worst inflationary month falls out of the trailing 12 months. That alone will bring the 12-month figure lower.
Is there a real fundamental difference in prices between May 2023 and June 2023 as a result of arbitrarily dropping June 2022? No. Absolutely not.
Monthly Data is Better
Focusing on the trailing 12 months creates a bias. This bias resulted in understating the rate at which prices grew in late 2021 and overstating it today. We should be striving to focus on the current data. The prior data can be used to provide additional context, but it is not equal.
Are Real Rates Negative?
This is a great example of those charts. I hear people proclaiming that 5% is below 5.3% (using the index they picked), so real rates are negative. That isn’t how those numbers work.
Most inflation data is “trailing”. It refers to the past.
Treasury yields are “forward”. They refer to the interest earned in the future on a bond purchased today.
Comparing a yield for the next 12 months with inflation over the prior 12 months is not matching up the data. There is no reason to believe that inflation will average over 5% for the next 12 months. It is quite unlikely that it will.
We can dramatically reduce the impact of that mismatch between “past” and “future” by getting into monthly data and annualizing it. We could do monthly compounding for more precision, but I don’t want to add complexity for such a tiny gain.
The following chart compares the annualized rate of the monthly change in each of those CPI metrics with the annualized rate for 1-month and 3-month Treasury bills.
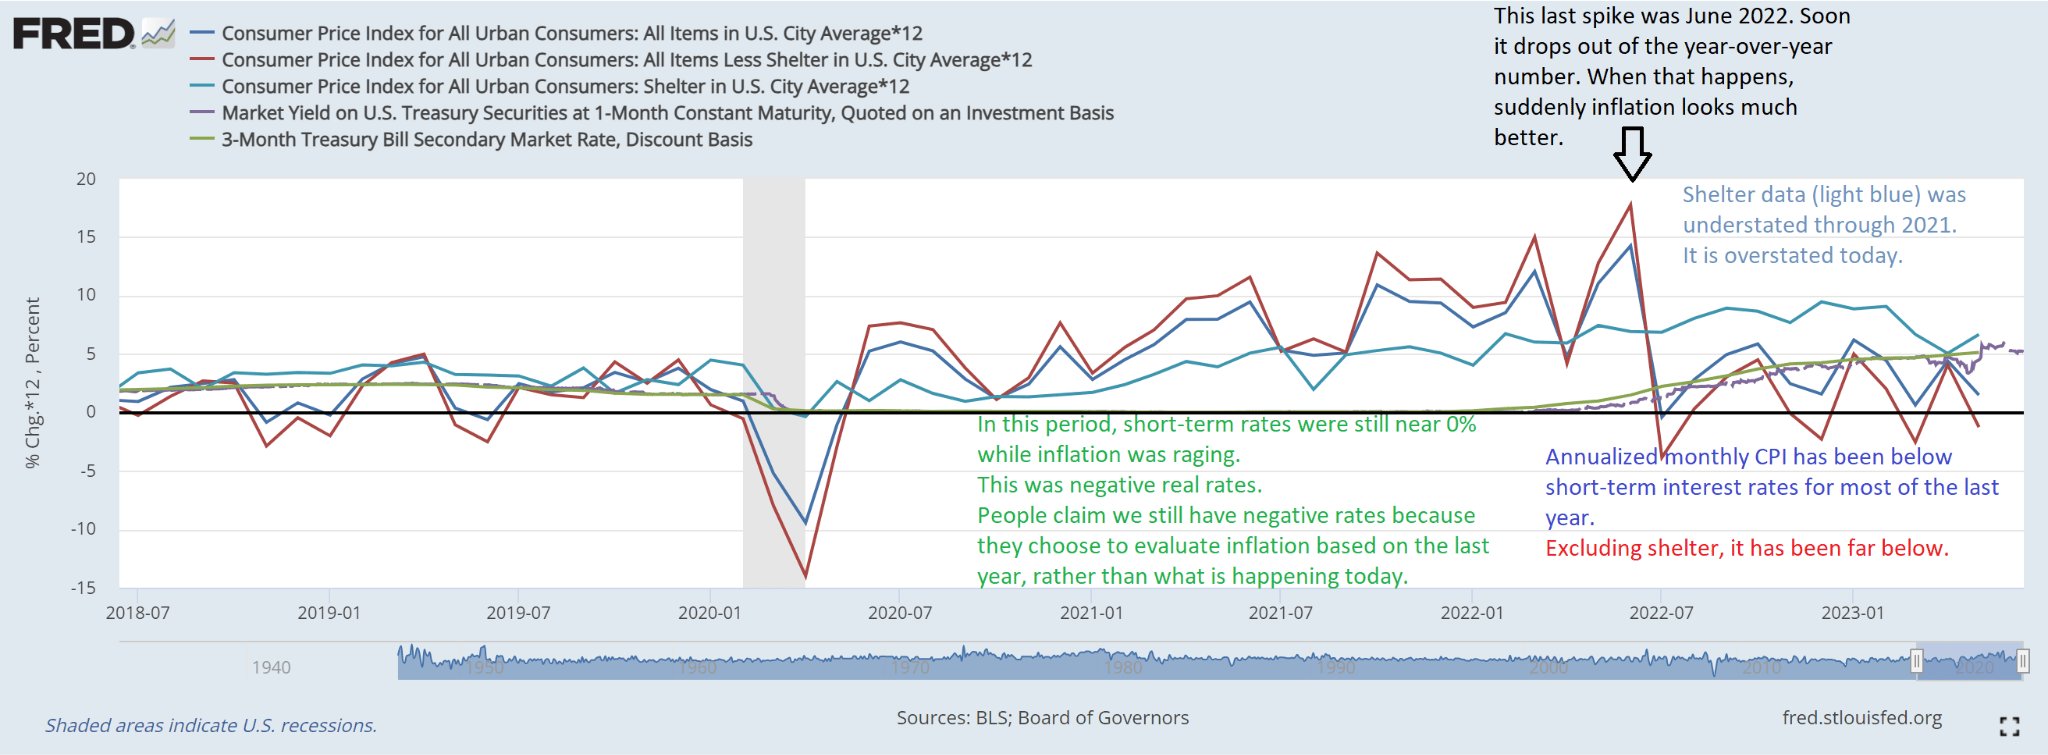
Using that chart, you can see that real rates (interest rate minus “inflation”) were severely negative until about the middle of 2022. From that point onwards, real rates were positive in most months.
The chart is volatile because 1-month inflation figures are volatile. It’s a small period (one month) and we’re compounding it. That’s part of why most sources hide the volatility through year-over-year calculations. Regardless, we had positive real rates on average from July 2022 through today.
Positive Real Rates Are The Exception
Many investors, especially those who want to see higher rates, believe that positive real rates are normal.
Textbooks on economics even say that positive real rates are normal. Many economists believed at one point that real rates couldn’t be negative. Obviously, 2021 settled that debate.
Despite the debate, we’ve already seen negative real rates for most of the last two decades.
I tried putting together a chart to demonstrate, but the volatility in the lines makes it hard to read:
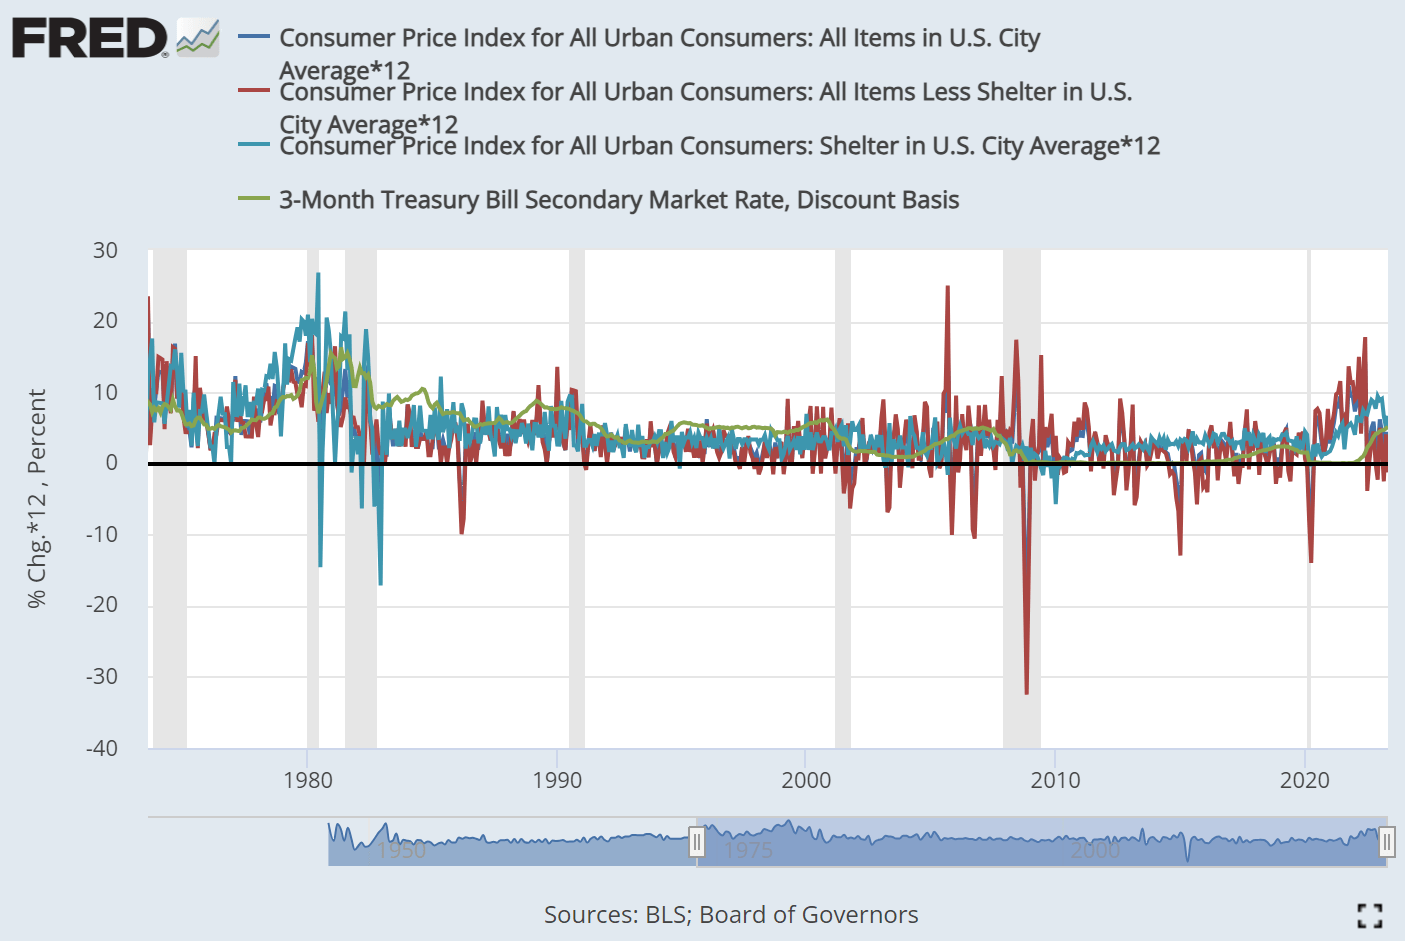
If you can spot the green line, you’ll notice it is generally below the other lines since the early 2000s. We had to get rid of the purple line because it wasn’t tracked long enough. Unfortunately, a few extreme readings also distort the chart.
I pulled the underlying data into Excel to adjust it for a better chart.
A Cleaner History
To reduce the volatility, I averaged the data for each month with the next two months. Consequently, we have two improvements:
- The next chart uses forward data for inflation to compare with the forward yield.
- The most extreme swings are slightly smoothed out.
See what you think:
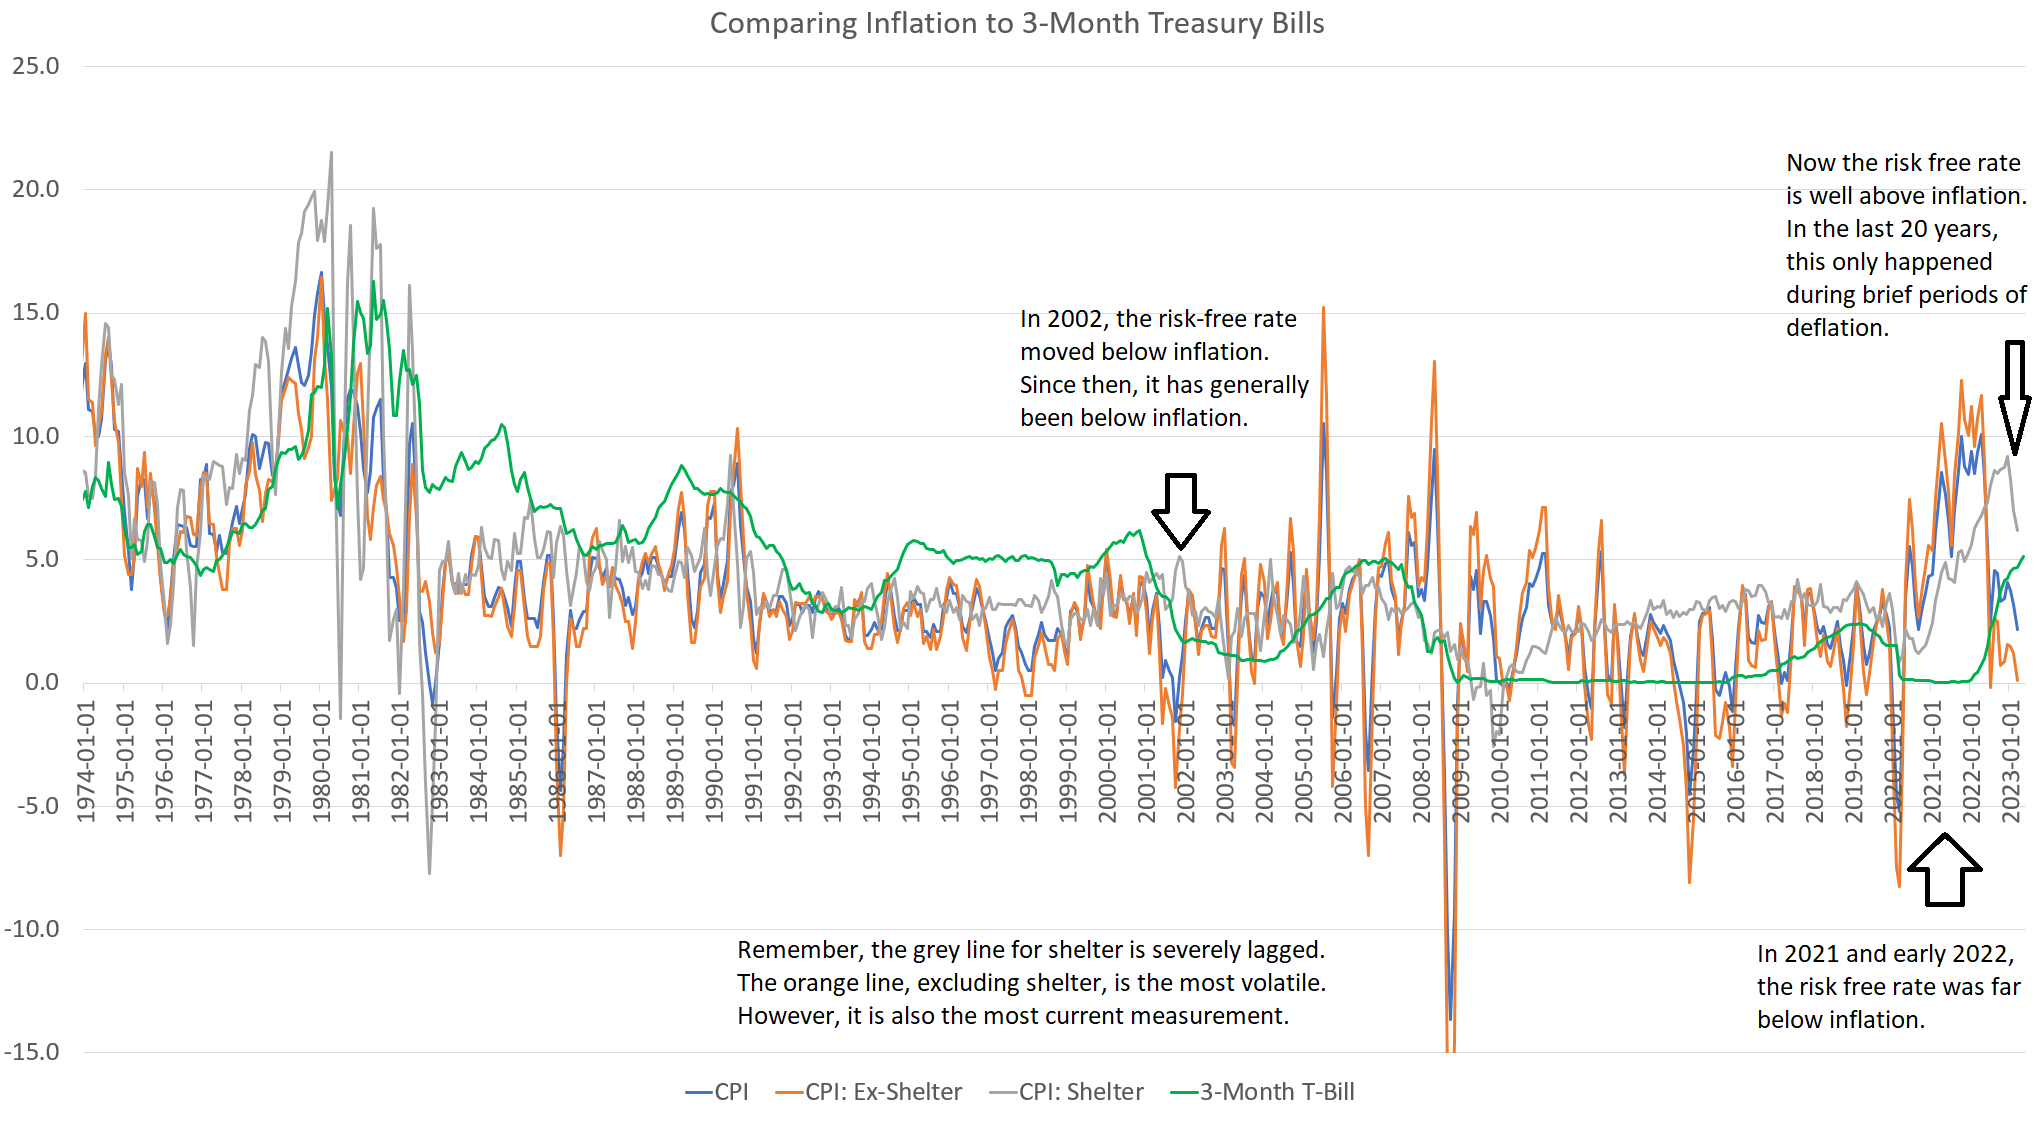
This presentation makes it much easier to see the disparity in those values. When we look at the current data on inflation, we can see that it is running far below the current risk-free rate. The story about negative risk-free rates was true 30 months ago. It was still true 12 months ago. It is not true today.
These negative real rates go back to about the start of 2002. For reference, the first iPhone was introduced in January, 2007. Negative real rates have been around 5 years longer than the original iPhone.
For better or worse, that's the historical fact.
How Bad is Inflation Today?
It was terrible in 2021 and the first half of 2022. I’m not going to downplay that. However, it is not particularly bad today. Some prices are up. Some prices are down.
We can drill into this concept of June 2022 driving year-over-year values and the garbage impact of shelter by comparing the values for CPI and CPI ex-shelter based on 3 different monthly readings:
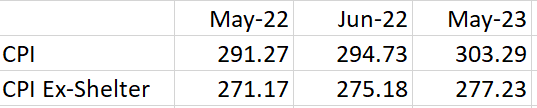
There was a big jump between May 2022 and June 2022. That jump was even more pronounced in CPI Ex-Shelter. That was bad inflation.
So what happens if we use June 2022 as the base month and annualize the data? Soon everyone will have June 2022 as the base month. We’re just looking at the data before June 2022 becomes the official base month.
The growth in CPI would fall significantly:
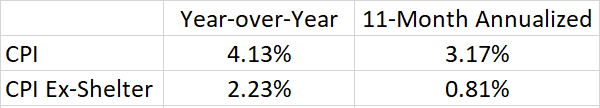
Including the lagged shelter data, annualized inflation would still be 3.17%.
Excluding the shelter data, because it is lagged, annualized inflation would only be 0.81%.
So how did shelter drag CPI so much higher? Well, the value for CPI: Shelter has been running hot. We will expand the table to add “Shelter”:
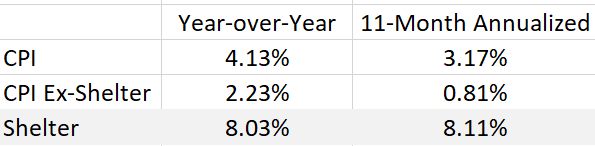
It looks like rental rates are roaring higher. However, that’s not what is happening in the real world. The cost of renting an apartment soared from 2021 through early 2022. It had a much smaller increase over the last 11 months. It’s still up. It would still justify a value greater than the 0.81% annualized rate for CPI Ex-Shelter. However, it wouldn’t be over 8%. Not even close.
So there are your two adjustments:
- Remove June 2022. Something everyone will be doing soon anyway.
- Remove (or replace) the shelter component in CPI.
If we used actual market rents, we would see a figure in the middle or lower single digits for shelter.
If we cut that shelter figure from about 8% down to even 4% and the 11-month annualized CPI would fall from 3.17% to about 2%. That’s why the Federal Reserve needed to pause in the last meeting. They have been talking about the long lead time on monetary policy. They want a pause before the market sees this drop in year-over-year growth rates driven by changing the base month.
Will The Federal Reserve Raise Again?
Probably. It’s far from a certainty, but it wouldn’t be surprising at this point. These are the reasons for the Federal Reserve to raise rates again:
- They want to seem tough. They’ve already convinced the market they will raise rates, so they will feel compelled to follow through as part of their image. This is about ego, not economics. So the study of “egonomics” begins.
- The market is getting optimistic about a no-recession scenario. The S&P 500 (SPY) rallied hard from last year's lows. While the S&P 500s index level clearly isn’t part of the Federal Reserve’s objectives, I believe they are factoring it in.
Will we actually escape a recession? Probably not. However, it can come down to who declares a recession. I'll stick with something easier.
Are we going to see strong real economic growth? Very unlikely.
Conclusion
You may hear that the Federal Reserve must keep raising rates. It simply isn’t true. It’s a story perpetuated by people who sold their equities so they could collect the higher yield on short-term Treasuries. They simply want to see rates go up because that means a bigger payment.
Of course, they would also like to see equity prices plunge so they could enter again at a lower price. That’s a dream that is getting away from them. The S&P 500 already rallied about 20% from the bear market lows. If rates come down, they won’t get paid for missing out on the rally that already happened.
It’s no wonder they desperately want to see higher rates. Who doesn’t want to get paid for sitting on something safer than cash? How can Treasuries be safer than cash? Because there are limits on FDIC insurance for your cash.
The REIT Forum is a reader-supported publication. To receive new posts and support my work, consider becoming a free or paid subscriber.
Member discussion