
Is Alexandria Real Estate Hiding Interest Expense?
There was a recent article on Seeking Alpha about Alexandria Real Estate (ARE) .
Over the last few years, Alexandria Real Estate significantly increased:
- The percentage of total interest expense being capitalized.
- The dollar amount of interest expense being capitalized.
This brought up some questions from our members and prompted some additional research.
Note: Capitalizing interest expense leads to higher FFO and AFFO than if the interest costs were simply “expensed”.
The TL;DR Version
2 things increased for Alexandria Real Estate:
- Average debt outstanding.
- The amount of capital allocated to development opportunities.
The capitalized interest expense is scaling at least very roughly with the amount of capital allocated to development opportunities. That is appropriate. Therefore, I’m not concerned by the change.
Walk Through
This will be a concise look at the process I used to reach my conclusion.
First, you need to get the 10-K.
You start with the SEC website.
I use the SEC website so much that it is the first bookmark on my toolbar:

Once you’re on the SEC’s website, search for ARE.
Open the 10-Ks for several years. I use “middle click” to open each in a new tab.
Note: Don’t try to do this from a mobile device. It would be way too slow.
Going into each of the documents, you’re going to do some quick searching.
First, we get values for capitalized interest:
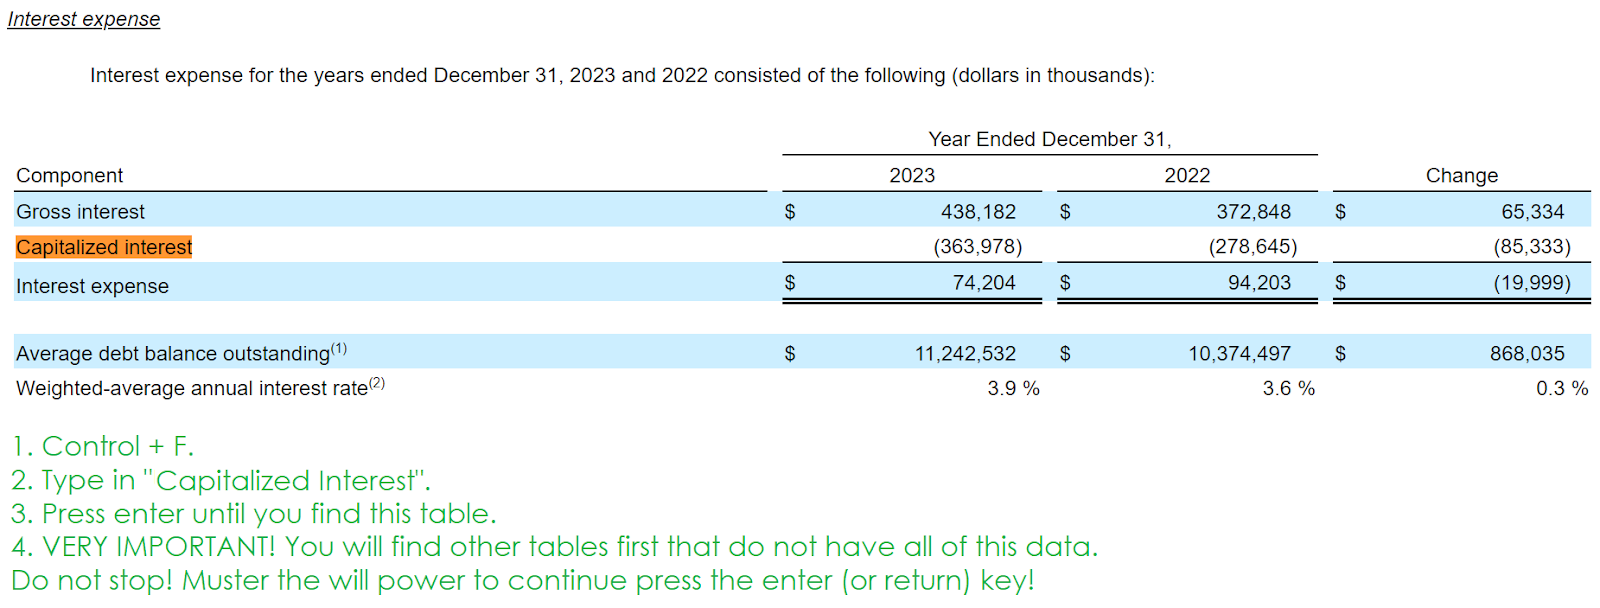
When you’ve done that for each year (keeping the documents open, you will need them again), you can build this table:
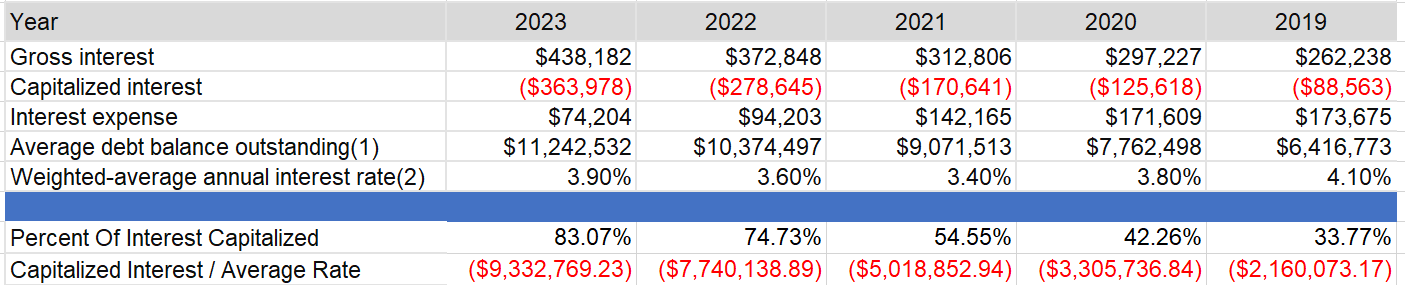
We’re calculating the bottom 2 lines to determine:
- A higher percentage of interest was capitalized.
- The interest implied a higher amount of debt was allocated to development.
However, we have not determined if this is reasonable yet.
To do that, we need to figure out how much capital ARE has been dedicating to their development pipeline.
We’re going back to the documents and searching for “under construction”:
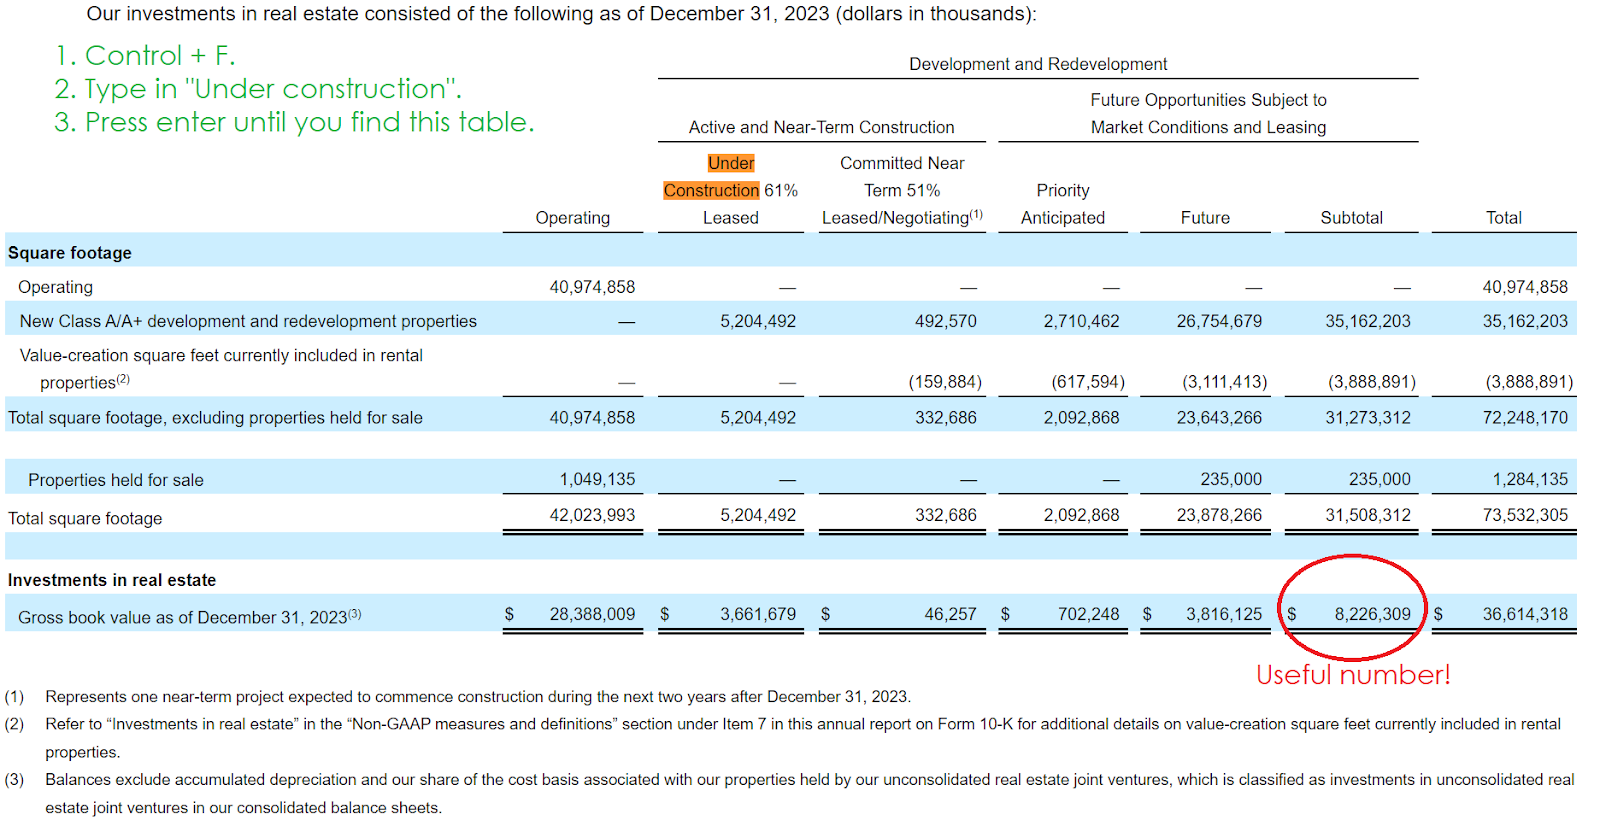
We’re going to extract the subtotal. If you follow along, your document won’t have the red circle and text.
Gather that figure for each year and paste it below the table you created in the prior steps:
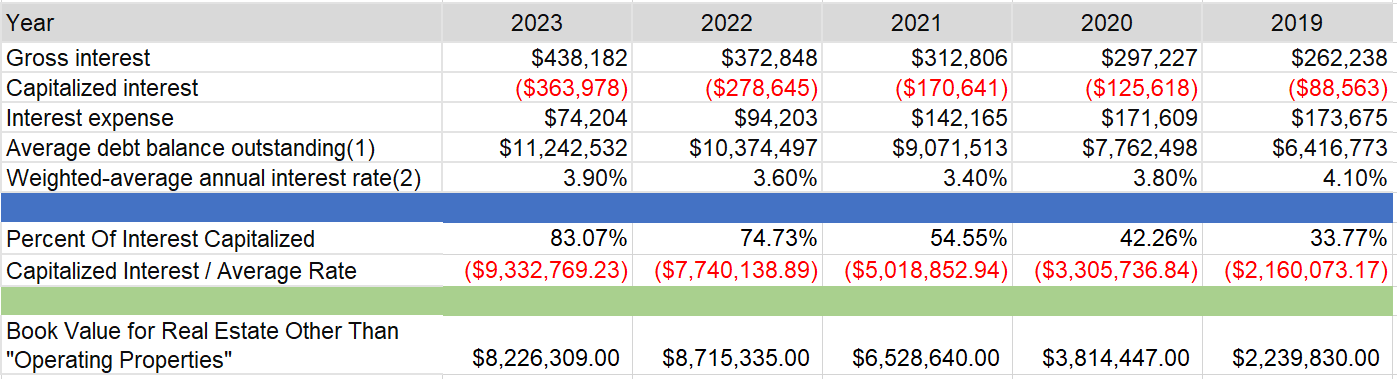
Now we can simply eyeball whether the trend in these values looks appropriate.
It appears to me that the values are trending higher together. In some years one value is higher than the other. That’s fine. Which value is higher changes? Also fine.
These values don’t need to be perfectly correlated. We just want to see that they are trending together.
We’re using weighted average rates and average debt, but we’re using the end-of-year value for the other categories. The average over a year and the end-of-year value are rarely the same. That’s fine. We just needed to see if there was anything suspicious. I do not see anything suspicious.
One Other Thing To Check
You might have noticed in the first image that Alexandria Real Estate had about 73.5 million total square feet and only 42 million of operating square feet.
Before rates ripped higher, ARE was planning to do a fairly massive amount of development because the margins on developing this space were excellent (for a builder with ARE’s talent level).
Thankfully, ARE locked in the rates on much of their debt. As it stands, the weighted average rate for 2023 was still mildly lower than the weighted average rate from 2019.
We want to verify that the amount of space ARE classifies as “operating” matches the amount of space they are leasing, adjusted for some vacancy.
This is how we do it:
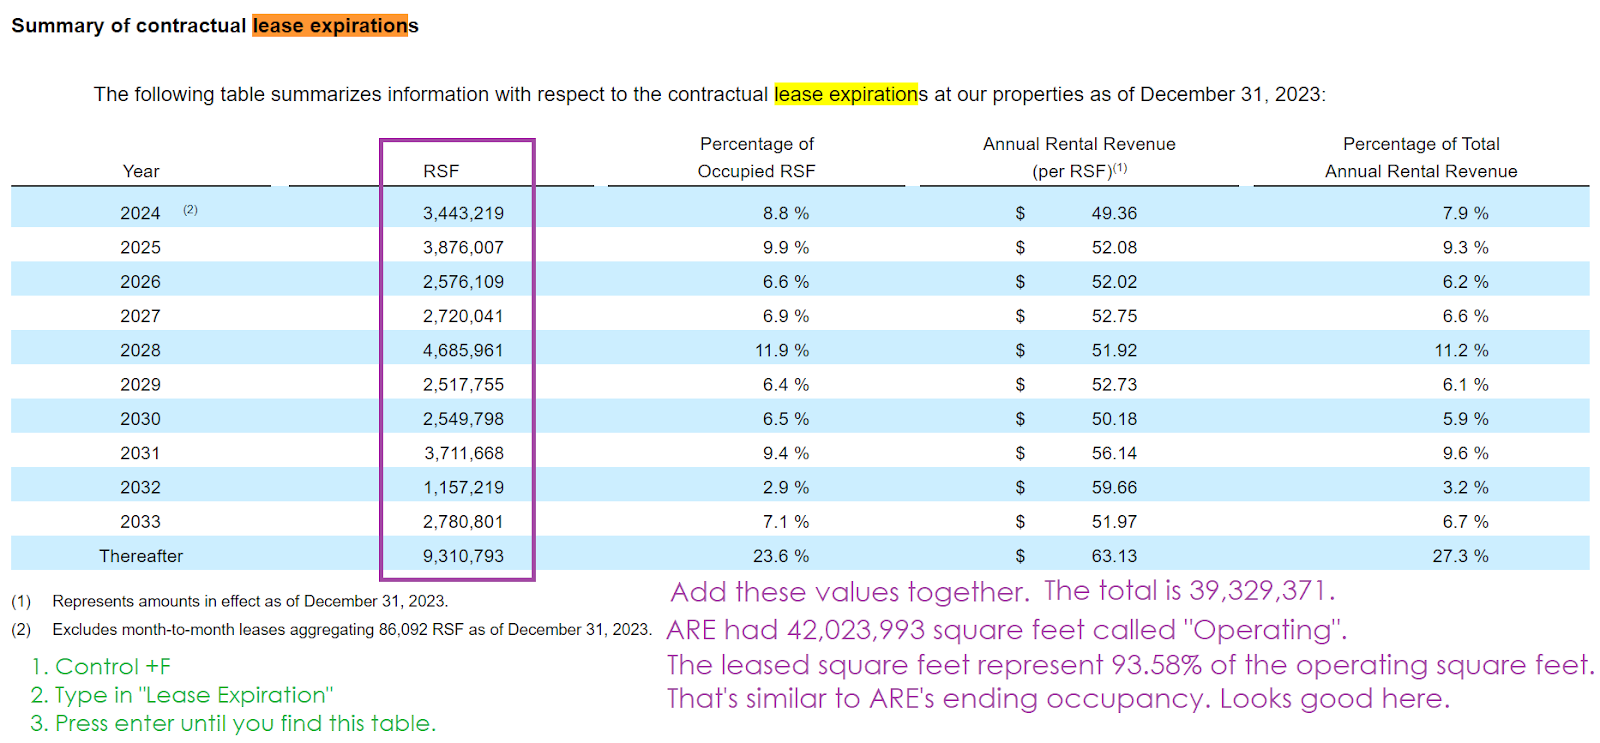
That’s precisely what we should expect to see.
No concerns there.
Other Notes
I had a few other scattered points to include.
Checking with an Accountant
I contacted a retired accountant to verify some things.
For instance, I wanted to verify that we use the weighted average rate across all debts that are not assigned to a specific project. That means the company cannot choose which debts to allocate to which purpose when the debt is not tied to that specific purpose. That was confirmed. Nothing strange to try to handle there.
Operating Square Feet
Another thing I looked into is the change in the square feet attributable to development (those that are not “operating”).
From Q4 2019 to Q4 2023, the total for “operating” square feet increased by 51.9%.
The total for development (and redevelopment) square feet increased by 167.1%.
Note: I’m simply ignoring that some square feet are classified as “value-creation square feet currently included in rental properties”. That amount also increased significantly (155%).
The takeaway from that is that Alexandria Real Estate has far more of its capital and more of its space tied up in current development. They are capitalizing the interest associated with those projects, which is appropriate.
Reducing Development Due to Change in Markets
ARE is still working to reduce its development plans and looking to fund developments by selling other buildings rather than using cash.
If interest rates had remained extremely low, ARE may have kept more of those projects for themselves and issued more debt to fund development. Of course, when debt was cheap, shares of ARE often traded at a much higher multiple also. Consequently, during those periods, ARE could issue debt and equity to generate cash for development. Because debt is much more expensive and share prices are lower (making equity more expensive), ARE is looking to sell far more real estate to fund the development pipeline.
This is how management of a REIT should manage their access to the capital markets. They scaled up their development plans when the market was much more favorable. They locked in their debt financing (by issuing long-term fixed-rate bonds) to protect themselves against a scenario where rates increased significantly. It doesn’t mitigate every challenge from higher rates (since interest rates can reduce property values), but it was an important factor in our evaluation of ARE.
The Increase in Debt
Total debt outstanding increased significantly over the last years. So did shares outstanding. This is not a company drowning in debt. Leverage is quite reasonable.
Alexandria was funding the development pipeline with both equity and debt. This would’ve eventually resulted in a healthy increase in “per share” metrics as those developments were completed. Because Alexandria needs to fund development by selling property instead of continuing to issue very low-rate debt and high-priced shares (as they could before), the benefits will be smaller. However, that doesn’t invalidate the plan. Because ARE locked in the rates on their debts and can still finance projects by selling completed buildings, they are still able to generate some returns above the growth in same-property net operating income.
Conclusion
I looked into the capitalized interest. I don’t see any problem there. Alexandria Real Estate’s documents simply reflect that the REIT was looking to take advantage of higher share prices and lower bond yields in prior years to lock in attractive development opportunities. I remain very comfortable with my position in Alexandria Real Estate’s common stock.
Higher interest rates may continue to weigh on price targets, as they will for most REITs. However, there’s nothing wrong with the accounting.
We previously covered the Q4 2023 results and 2024 guidance for Alexandria Real Estate.
Member discussion