
Industrial REITs: What Happened To REXR?
Executive Summary
Rexford (REXR) went on sale. We reexamined our thesis and found it remains accurate.
Weaknesses:
- Southern California weakened a little bit, from all-time record strength.
- There’s some general negative sentiment around California. That seems to be spilling over to industrial REITs.
Neutral:
- Treasury yield correlation doesn’t explain the dip.
Strengths:
- Fundamentals are good. Consensus projections are up.
- Cash leasing spreads have been great. Mid-quarter update has REXR on the road to new record leasing spreads.
- New supply is weighing on occupancy globally. PLD details projections. Many new properties are being completed, but very few are being started. Higher supply over the next few quarters, then lower supply.
- REXR’s occupancy was down slightly, but it looks worse because REXR put many properties into redevelopment at attractive returns.
- 3 million square feet of extra vacancy in southern California sounds bad. It’s roughly the difference between 1.35% and 1.50% vacancy.
- Like REXR, PLD is also having a monster second quarter on fundamentals. We don’t have numbers yet for TRNO.
- Issuing equity can look bad but isn’t a good predictor of success when used in isolation. Development projects are boosting NAV per share and boosting future AFFO per share.
- E-commerce uses more than 3x more industrial space (than retail) per $ of sales.
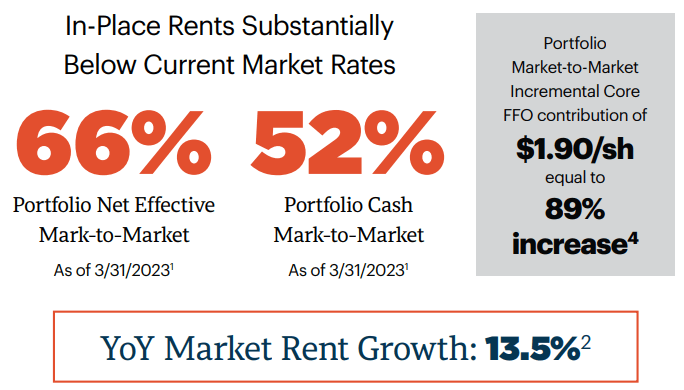
- If all leases were adjusted to market rates overnight, REXR’s projected FFO for 2023 would go from about $2.135 (consensus estimate $2.15) to $4.035. That would create a vastly lower multiple.
- We expect growth in market rents and smart management to drive additional value.
Fundamental Growth
Did we make a mistake in evaluating the fundamentals underpinning industrial REIT growth? If the projected FFO and AFFO per share is falling, that could mean a mistake on Wall Street projections or a mistake in our estimates. We’ve been adamant about projecting strong average annual growth rates for industrial REITs. We expect REXR to have one of the very highest average growth rates measured over several years.
I pulled the consensus projections for FFO and AFFO per share for several REITs around late January / early February 2023. Before the Q4 2022 earnings results. We can compare the projections from that point with the projections today. There are three scenarios:
- Projections up: We can’t blame projections for weaker prices.
- Projections flat: We still can’t really blame projections for weaker prices.
- Projections down: Time to double-check why the projections fell.
The result is:
- Projections up. This is not the problem!
Here are the charts, starting with FFO:
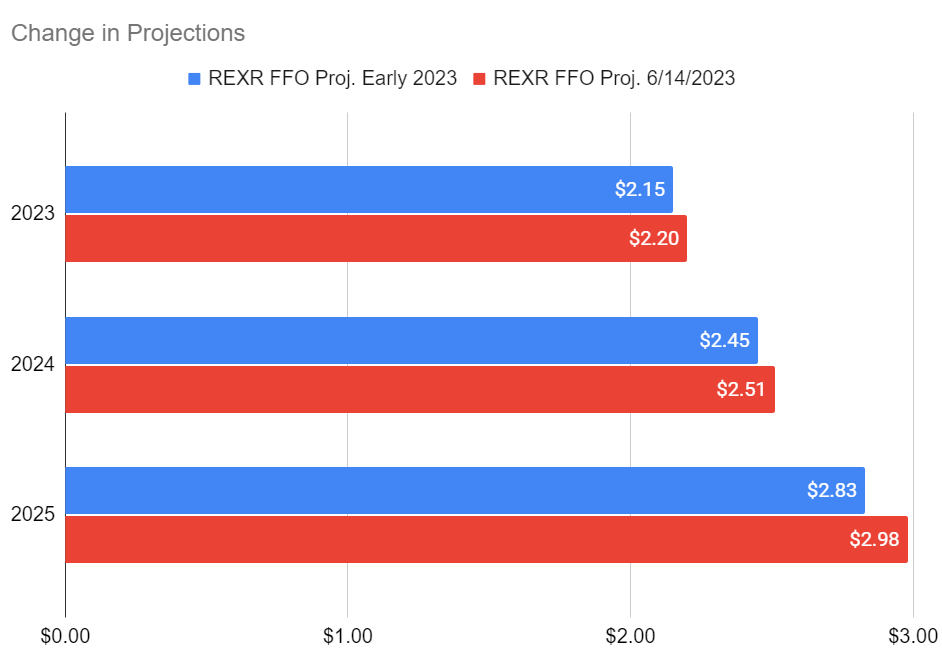
We have modest increases to FFO per share projections. About 2%, with a bigger increase for 2025. That’s certainly not a negative development.
How about AFFO?

Those are some pretty big increases. So, it’s not AFFO per share.
Treasury Rates
There’s been some volatility in Treasury rates:
Can we blame the activity on Treasury rates? It would seem that way in the first 2 months, but that connection didn’t last. I set up two charts to cover roughly the same period. It’s a bit rough, but the result is obvious enough that greater precision would be pointless:
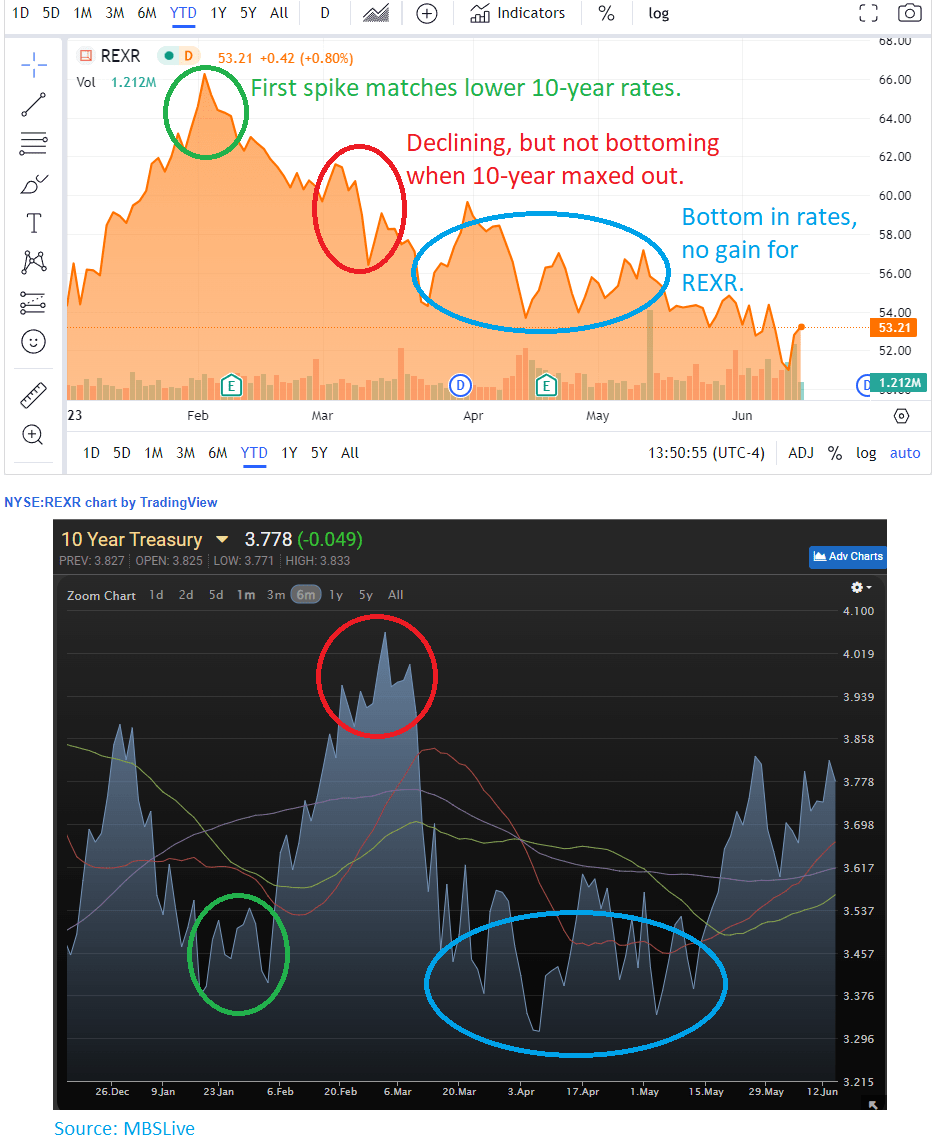
We can wipe out that theory. We should’ve seen a negative correlation in those charts, but we didn’t.
So, what else is happening?
Cash Leasing Spreads
One of the most important metrics for the overall health of the market is shown through leasing spreads. There are a few kinds of leasing spreads, but we tend to prefer using cash leasing spreads. Cash leasing spreads are:
- Easy to understand. It’s the change in rent between expiring and new leases.
- Does not involve any revenue smoothing, which would favor longer leases.
- Reported by many REITs.
Those are some big benefits. The biggest weakness is that a REIT may have acquired some properties where rent was exceptionally low or exceptionally high. If that happens, the renewal of that lease might push the averages for the quarter. Regardless, as long as you’re looking at multiple quarters, you’ll be in good shape. These are the cash leasing spreads for the 3 industrial REITs we’ve tracked closest.
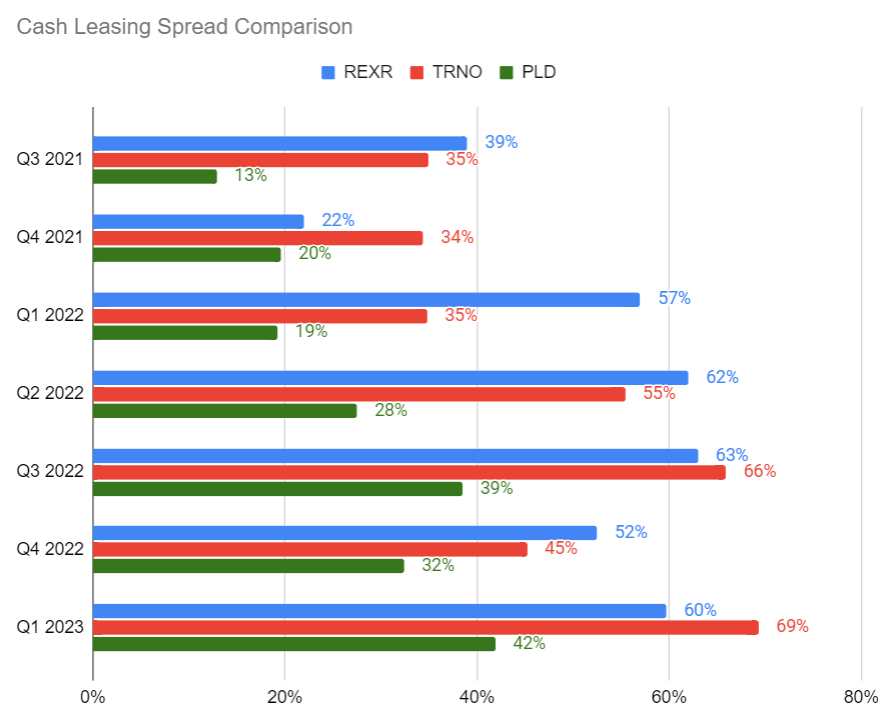
You can see that the values remain strong. Prologis (PLD) is seeing some huge gains in this area, but REXR and Terreno (TRNO) remain very strong. This isn’t a good explanation either.
New Supply Impacting Occupancy and Rates with PLD
We have a better explanation here, though it’s still not great. There was a big increase in development starts over the last few years. That leads to additional supply hitting the market, though some markets make it very difficult to build new supply.
Fortunately, the biggest developer of industrial real estate is one of the REITs. PLD has the most industrial real estate and the biggest development program. Consequently, we could even use the rate of change in PLD’s development activity as a proxy for the sector. PLD also provides some nice metrics for guidance, which really help with evaluating the sector.
You’ll notice PLD reduced their development starts in 2020, then increased them rapidly in 2021 and 2022. In 2023, they slashed new development.
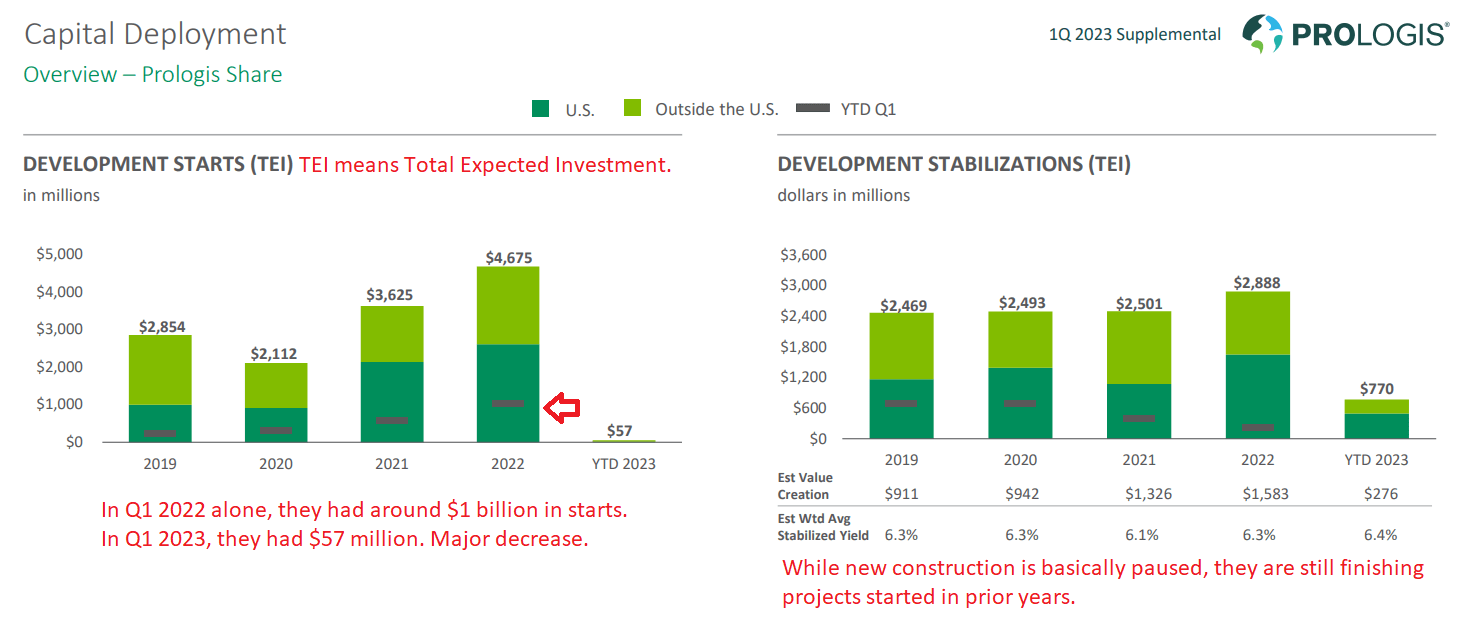
The reduction in new development starts will impact the supply growth rate in future years. In the near term, we have some extra completions.
PLD already projected this would weigh on occupancy. They are projecting 2023 average occupancy between 97% and 97.5%:

That would be lower than their recent level of 98%.
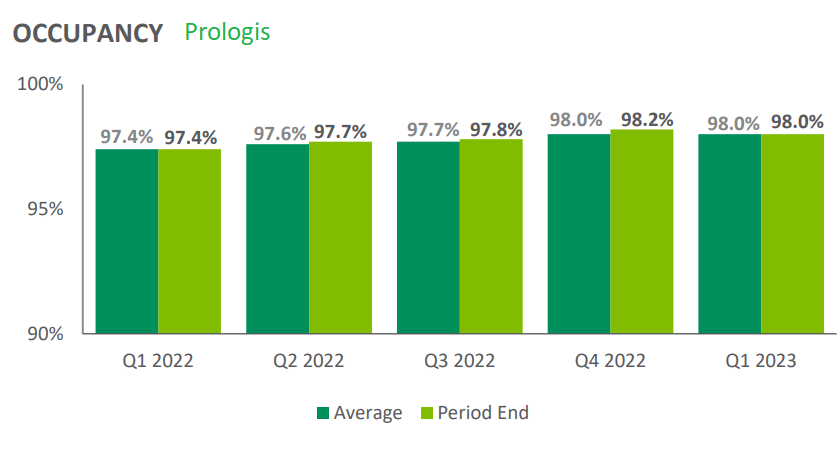
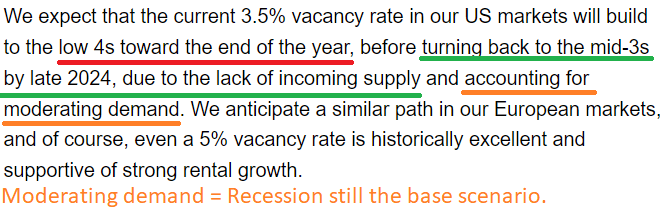
If the average dropped to 97%, it would suggest ending occupancy at around 96%. However, I should mention that PLD has been vocally predicting a recession as part of its base scenario. I think a recession is likely, but the point is that PLD’s guidance is already baking that in.
Looking at PLD’s Q4 2022 earnings call, management stated:
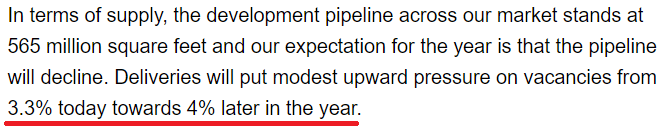
However, they also projected reduced development (where they are a major developer) leading to less supply coming to market around the end of 2023 or in 2024:
That’s positive for shareholders in any of the industrial REITs.
The trend was confirmed in PLD’s Q1 2023 earnings call when management said:
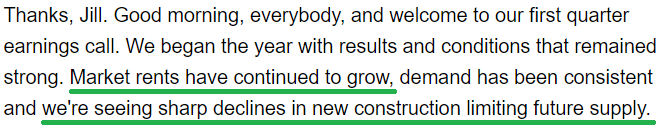
Later, they added:
REXR Occupancy
Turning back to REXR, we see a dip in occupancy during 2022.
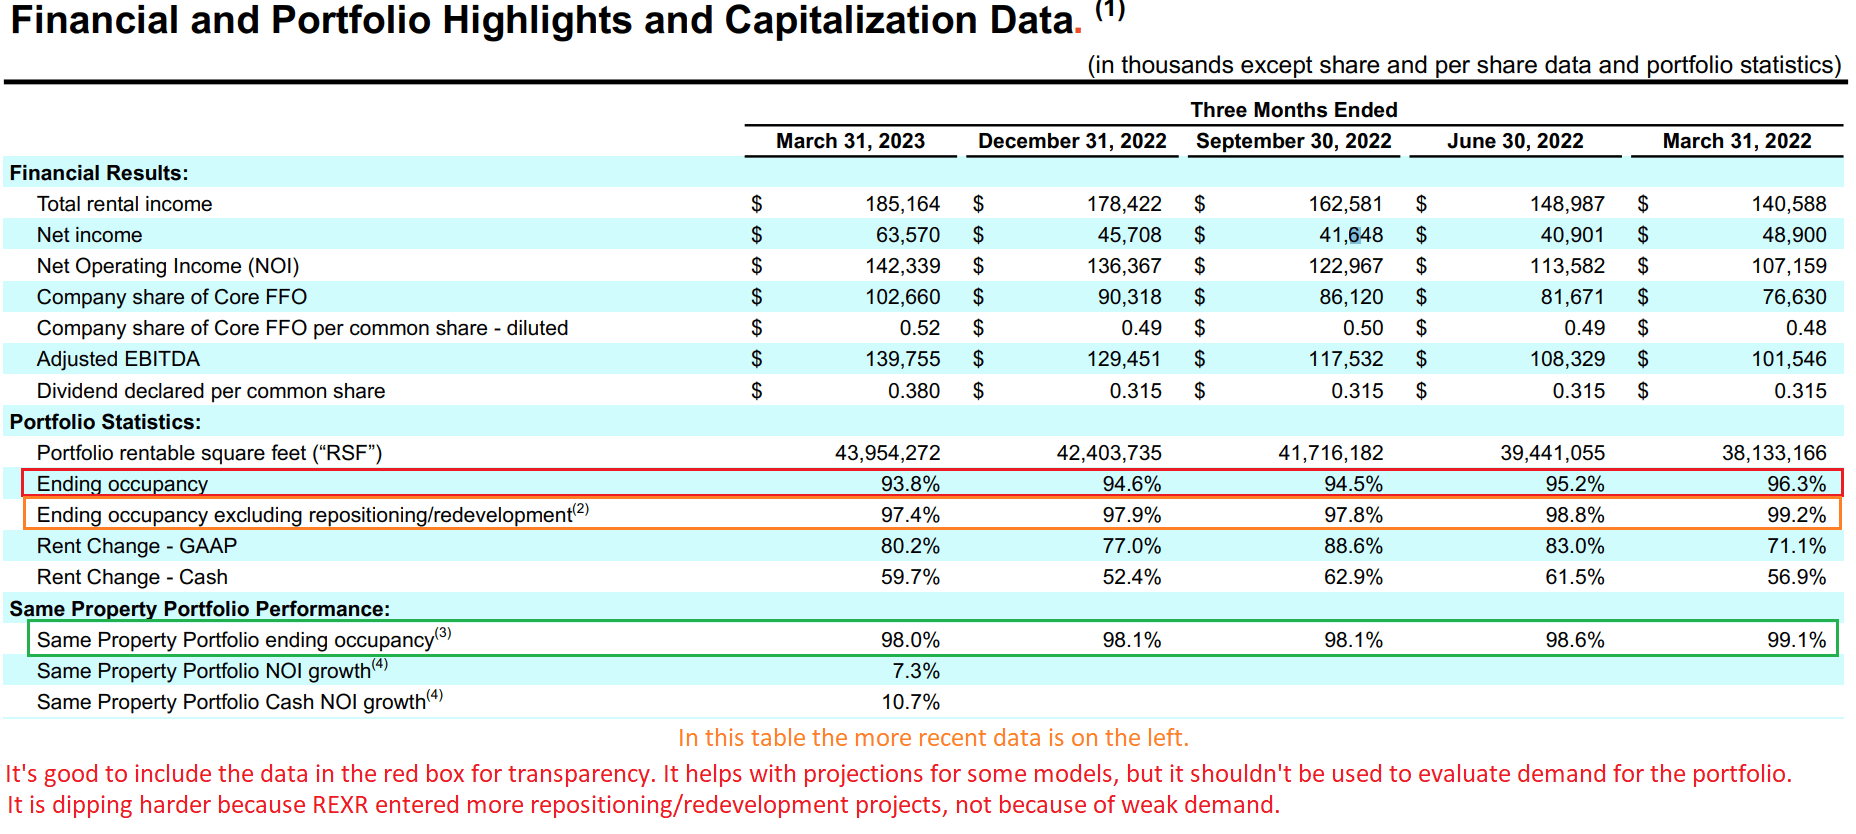
Occupancy dipped but remains pretty strong. The “Same Property Portfolio” (green box) is usually the ideal measurement tool here. An investor could argue for the orange box instead, but I wouldn’t. REXR often buys properties where the lease expires soon. If they are going to lease the property again without redevelopment, it would be included in the orange box but not in the green box.
Infill Southern California
REXR has a focused portfolio. While most REITs own real estate across the country or across the globe, REXR owns industrial real estate in Southern California. That’s where we have the ports to handle importing tons of junk from China. To be fair, we import it from some other countries as well. However, much of it comes across the Pacific Ocean.
Remember how occupancy dipped a bit for REXR during Q1 2023? If we use the same property portfolio, it was a minor dip going from 96.1% to 96%. It was a bit bigger if we just exclude repositioning/redevelopment projects, going from 97.9% to 97.4%.
REXR had 14.7% of their leases set to expire during the full year of 2023:
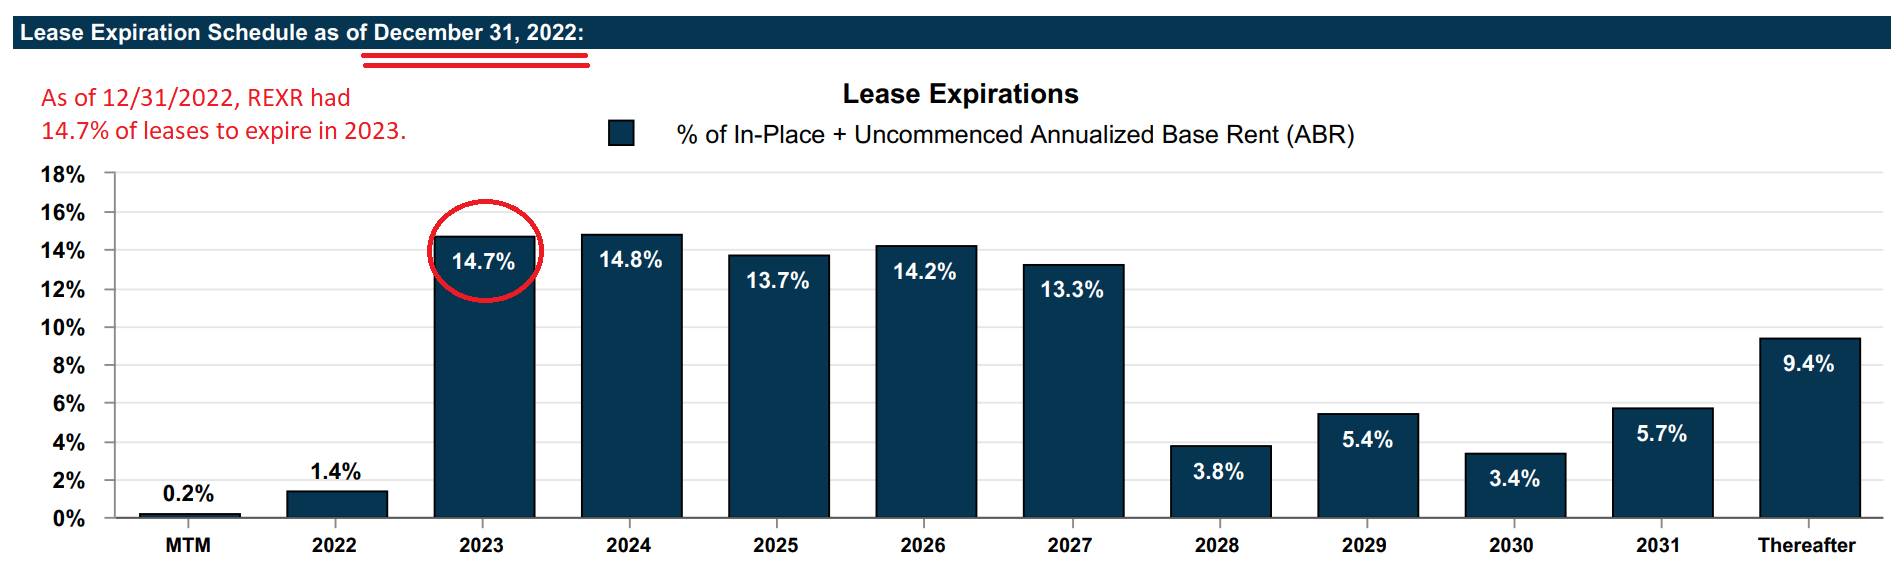
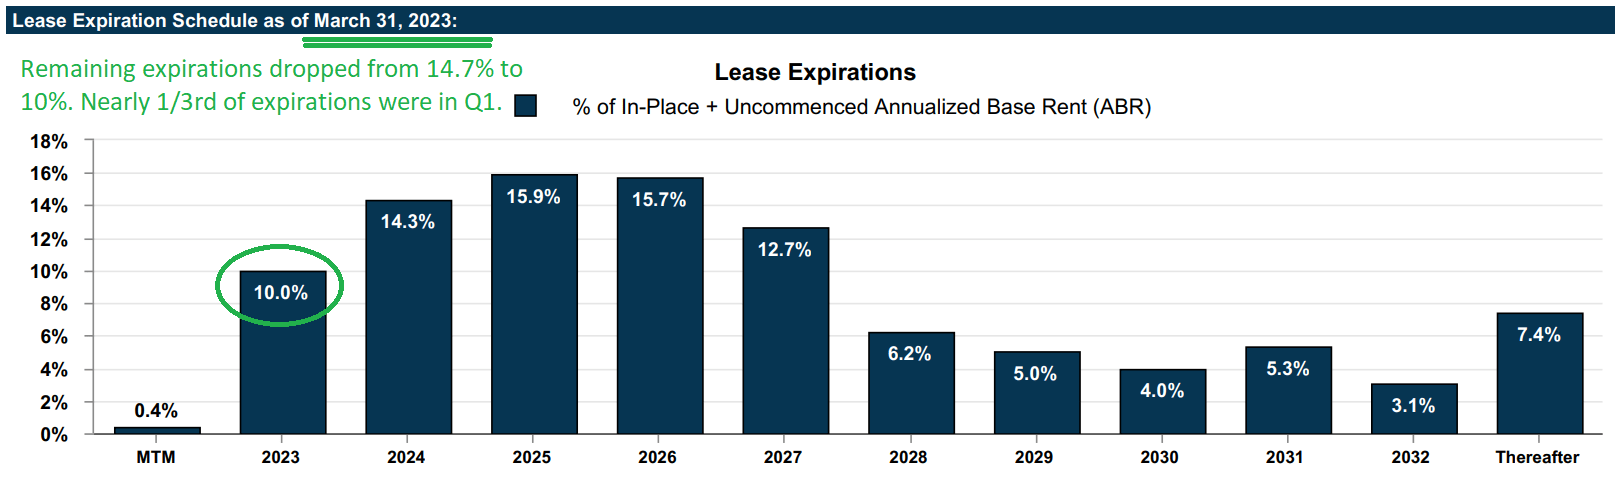
A disproportionate share of leases were expiring in Q1 2023, as the remaining expirations already fell:
While more space in REXR’s portfolio was expiring than being leased, they were putting a significant chunk of the real estate into their redevelopment program:
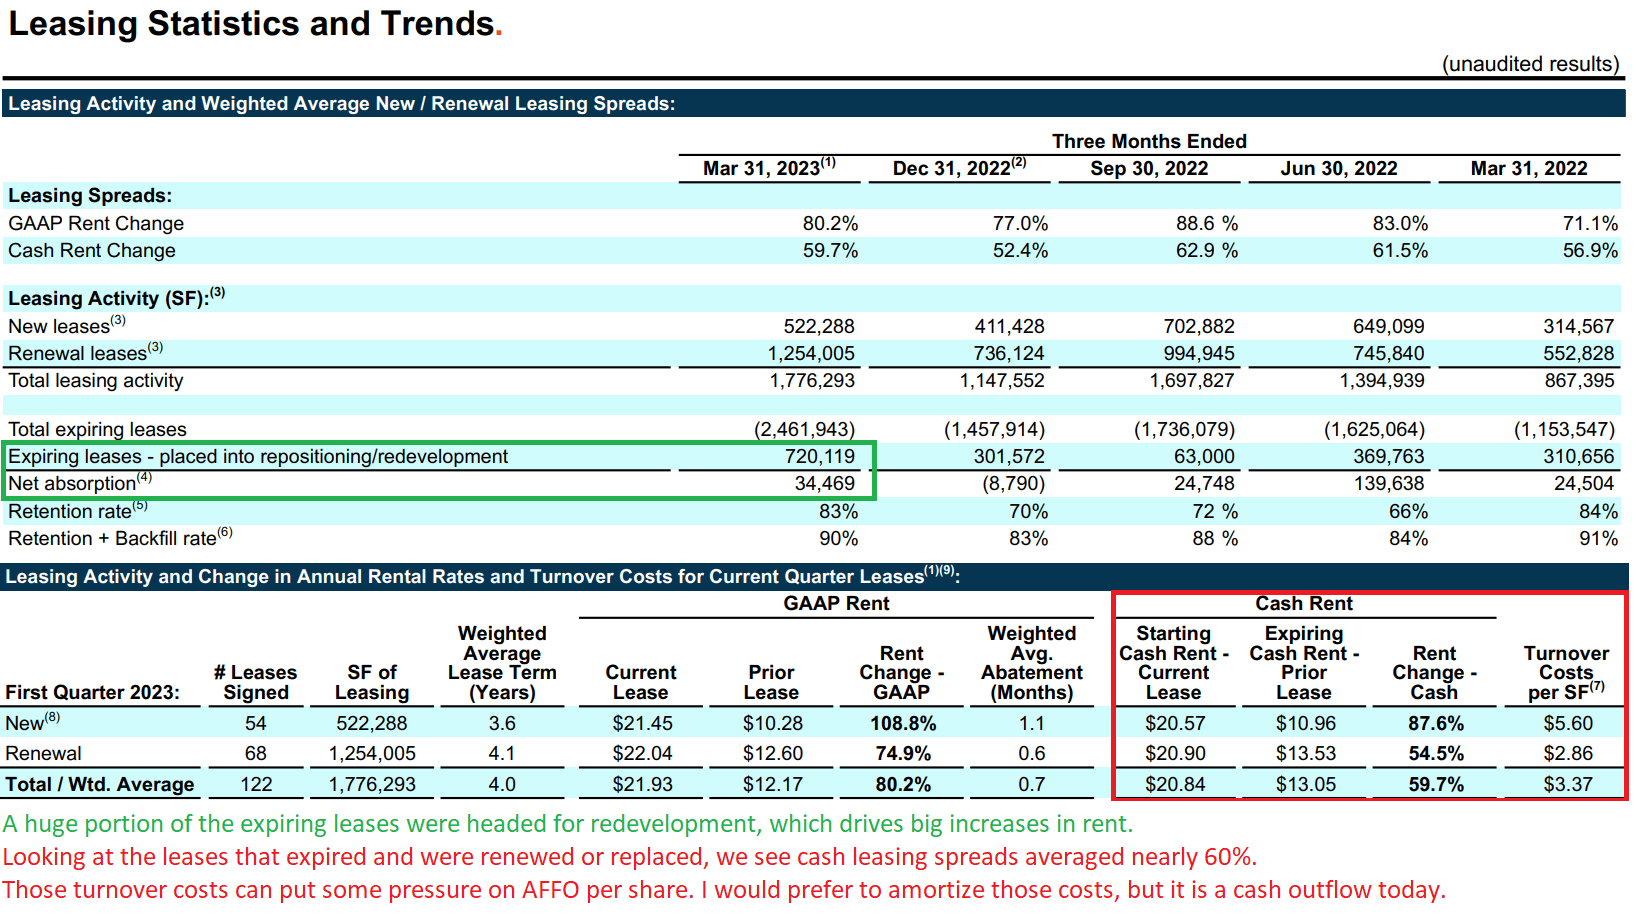
That’s why total occupancy is down. Because REXR has quite a few redevelopment projects underway. Higher cash rents drive higher AFFO, but turnover costs reduce AFFO in the present year. Consequently, more of the benefit comes in the following year.
Likewise, putting more real estate into redevelopment will hurt AFFO per share today, but it will drive higher rents and greater AFFO per share in the future. We actually want those leases to expire because each expiring lease is an opportunity to dramatically increase rents.
We can demonstrate that REXR’s strategy has driven growth in AFFO per share by looking at the growth rates recorded and projected:
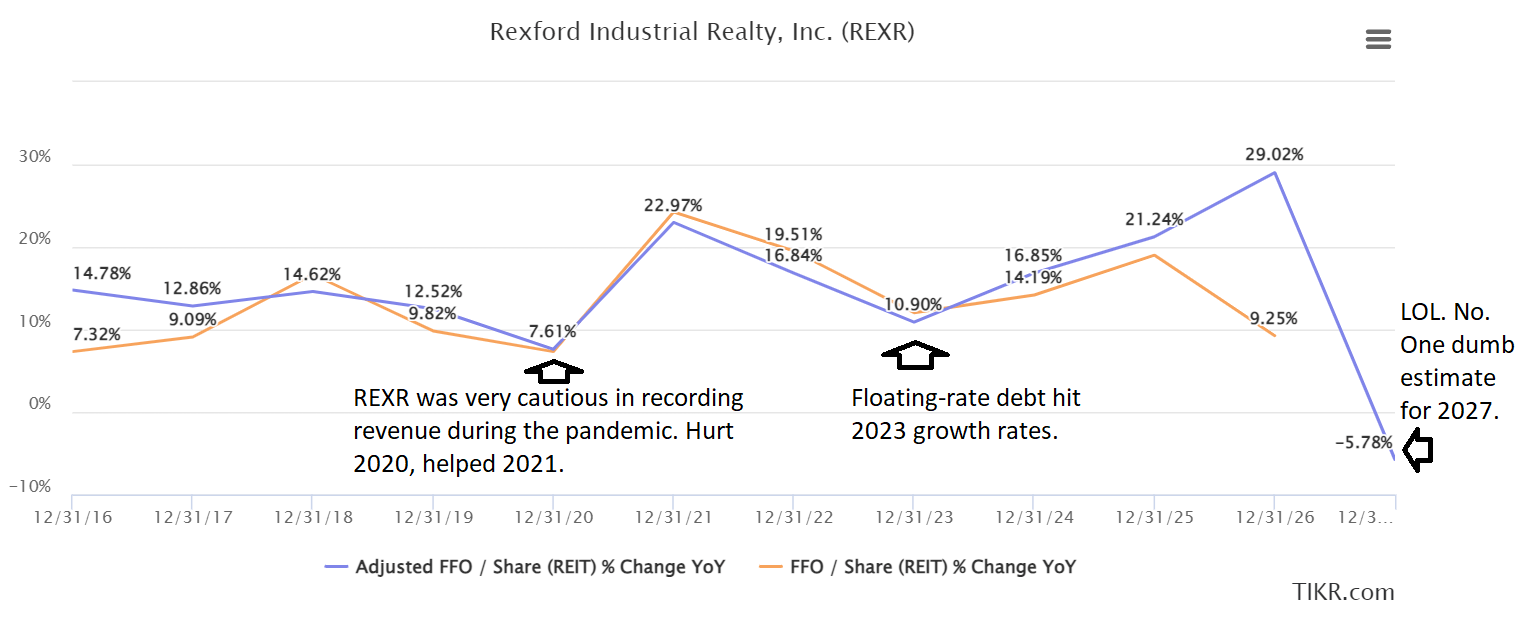
When we look at the total market for Southern California, we can see that there was negative “net absorption”. I think that’s driving additional negative sentiment around California.
However, much of the industrial real estate that was going vacant was less desirable real estate:
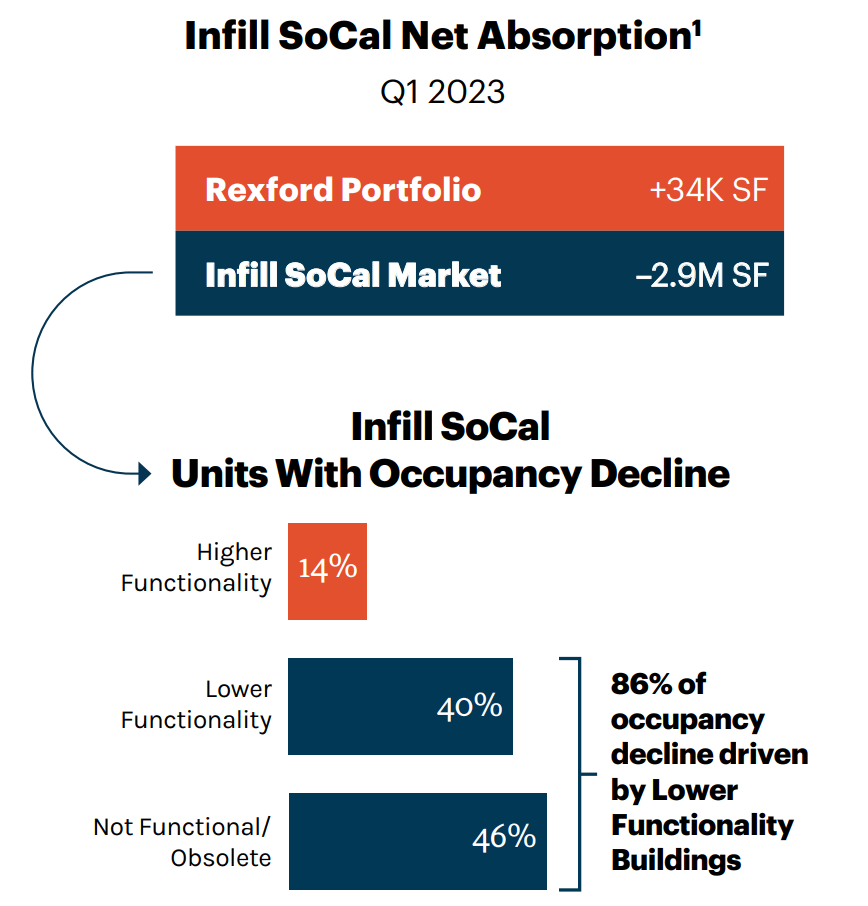
Remember that REXR’s leasing volume trailed expirations by less than the amount put into redevelopments. REXR even provided some additional details about the situation in Central LA:
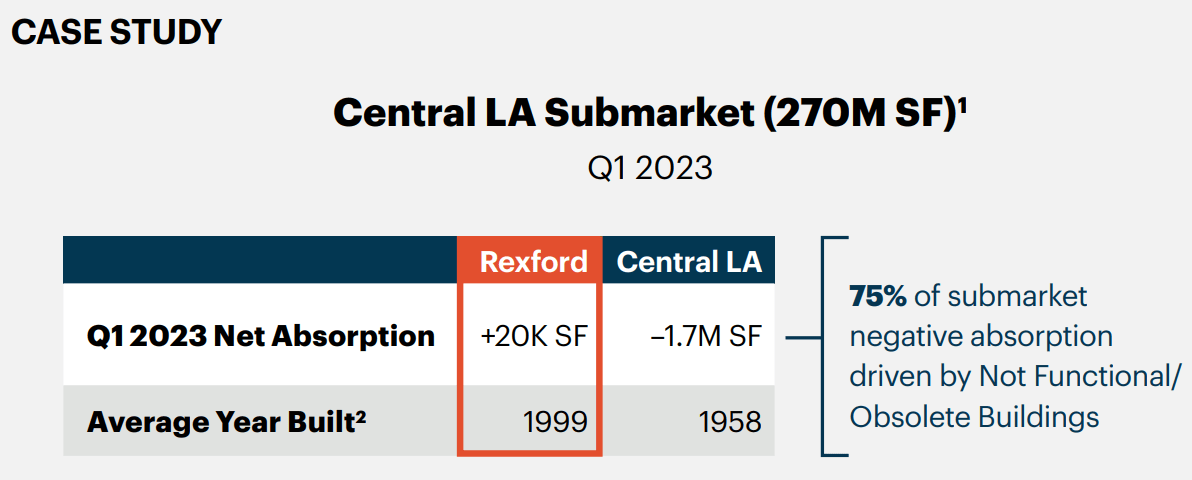
The average year those properties were built was 1958. That’s more real estate that’s going to need redevelopment to meet modern demands.
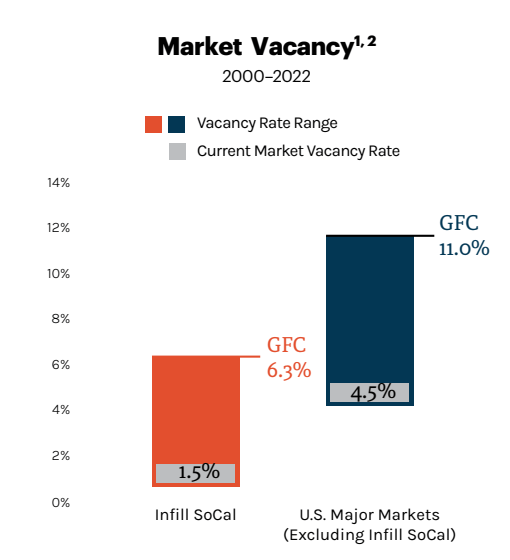
Before anyone starts to panic about the idea of nearly 3 million square feet of negative net absorption, allow me to highlight the total market size and vacancy rate:
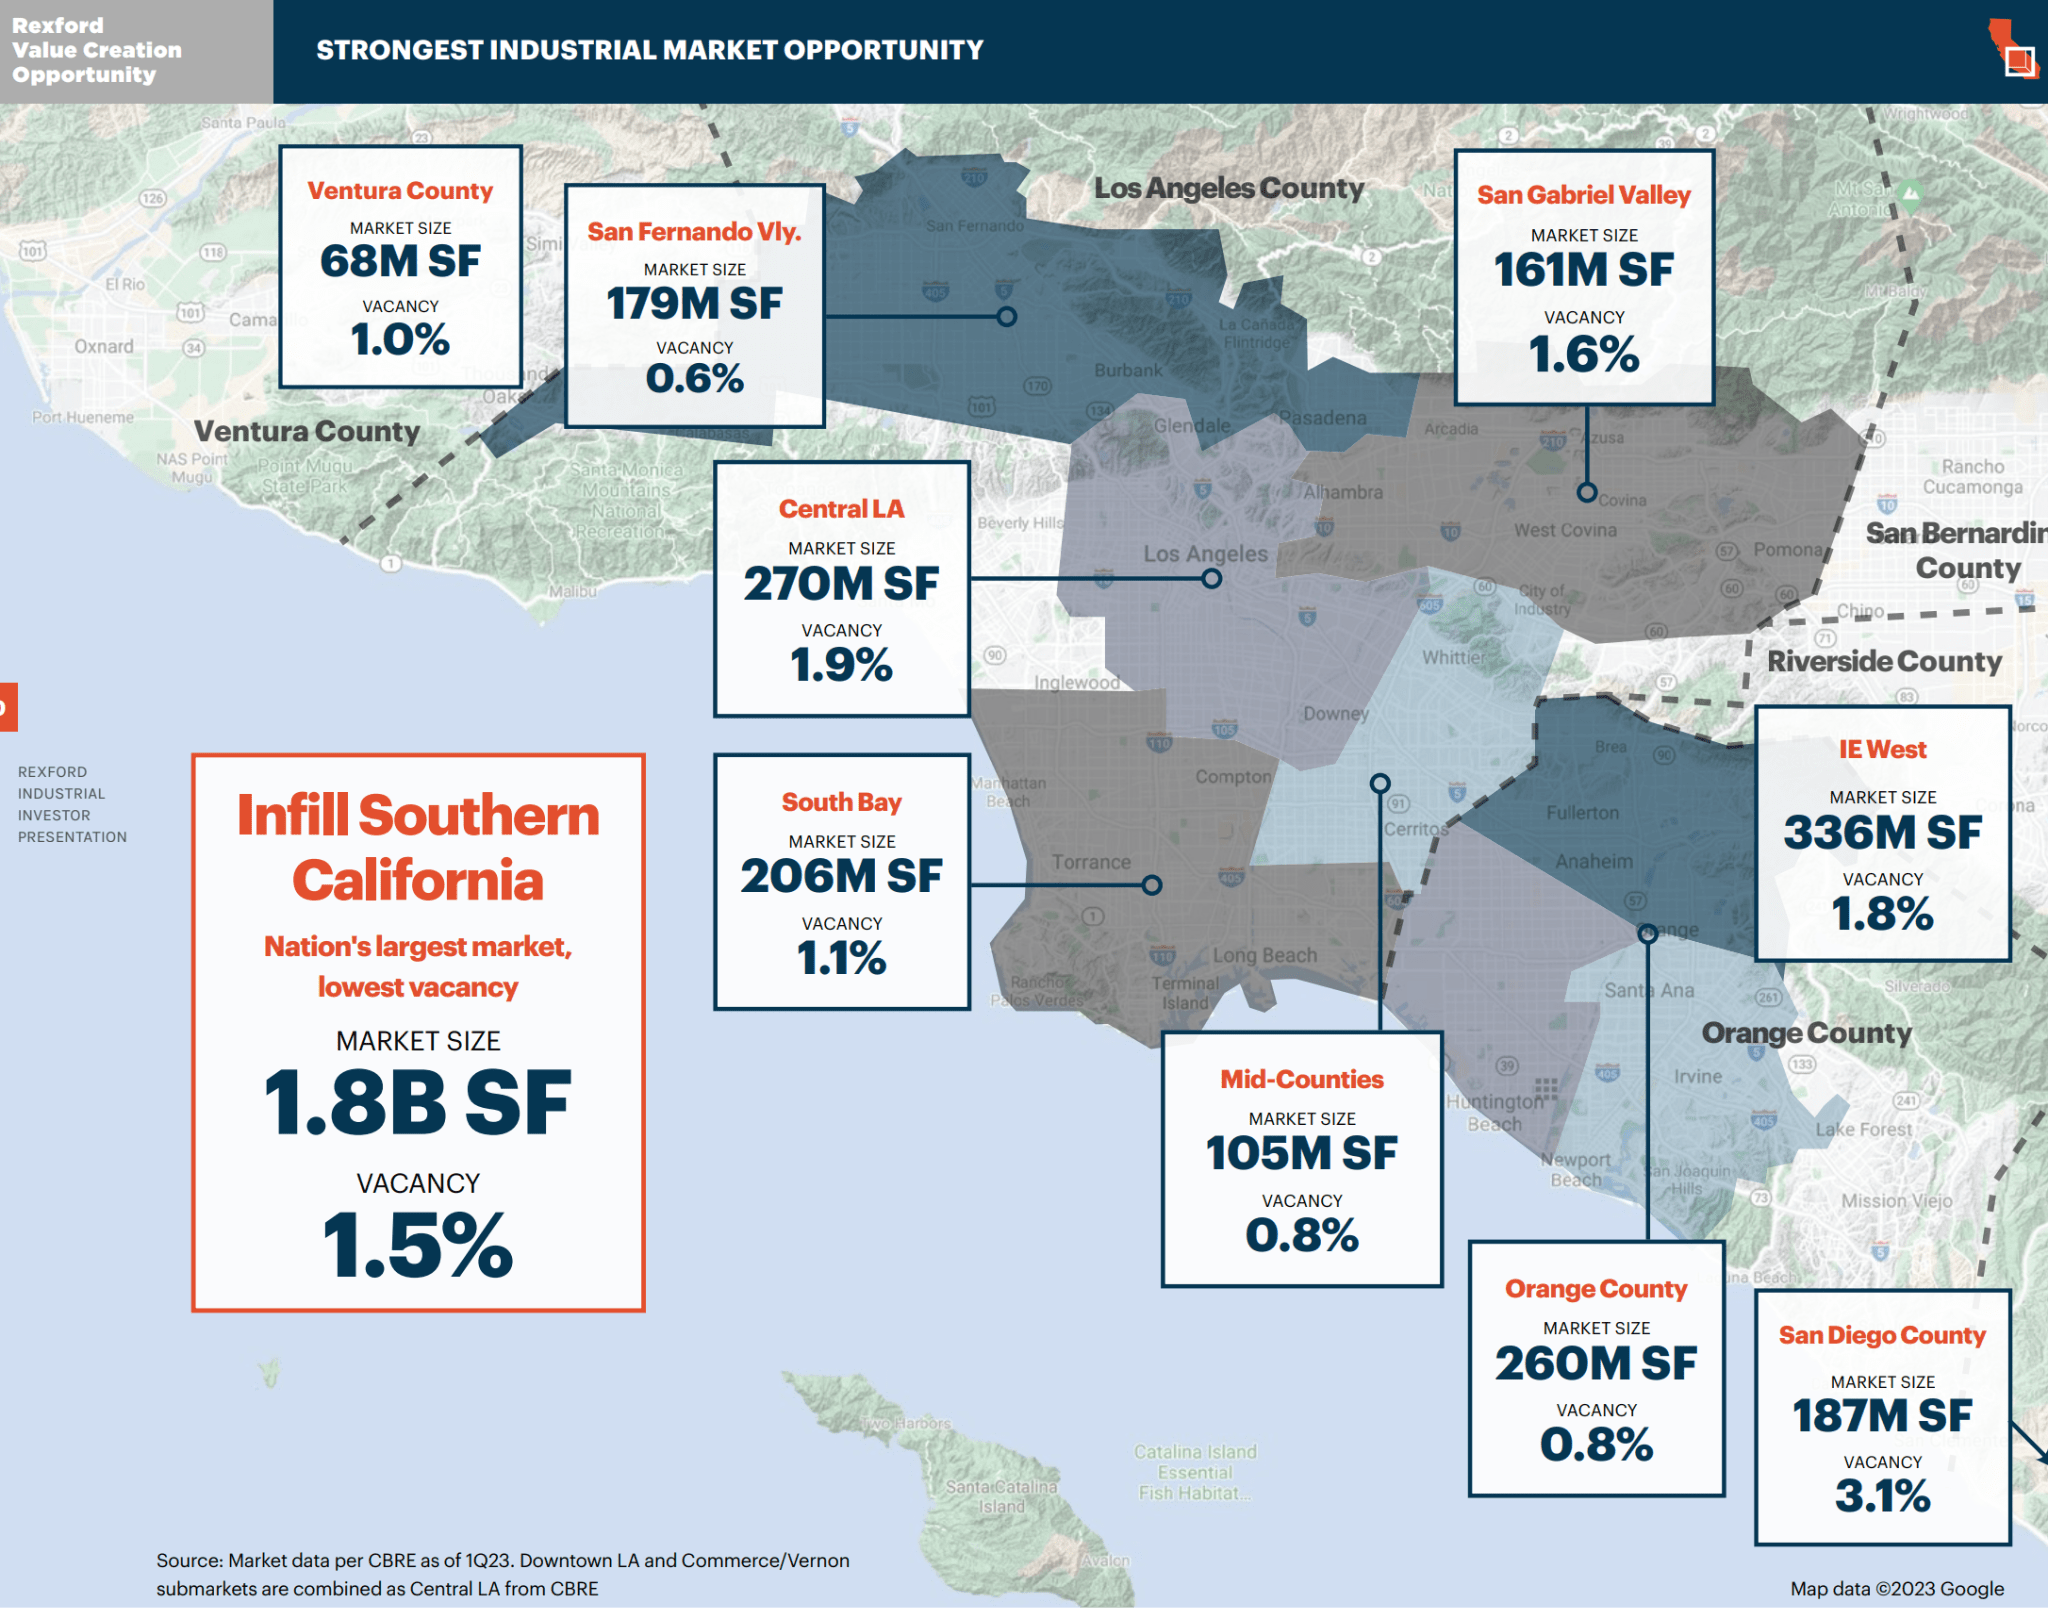
In that context, 3 million square feet is literally a rounding error. It would take 18 million square feet just to reach a 1% change in vacancy. So, 3 million square feet is about the difference between 1.33% and 1.5% vacancy.
Finally, I would remind investors that the wave of new supply is not in Southern California:

Southern California is one of the markets with the least exposure to new supply.
What About the Last 75 Days?
Maybe REXR just fell apart during Q2 2023? No. REXR was kind enough to provide investors with an update on their second-quarter leasing so far. Remember, the quarter is not yet over.
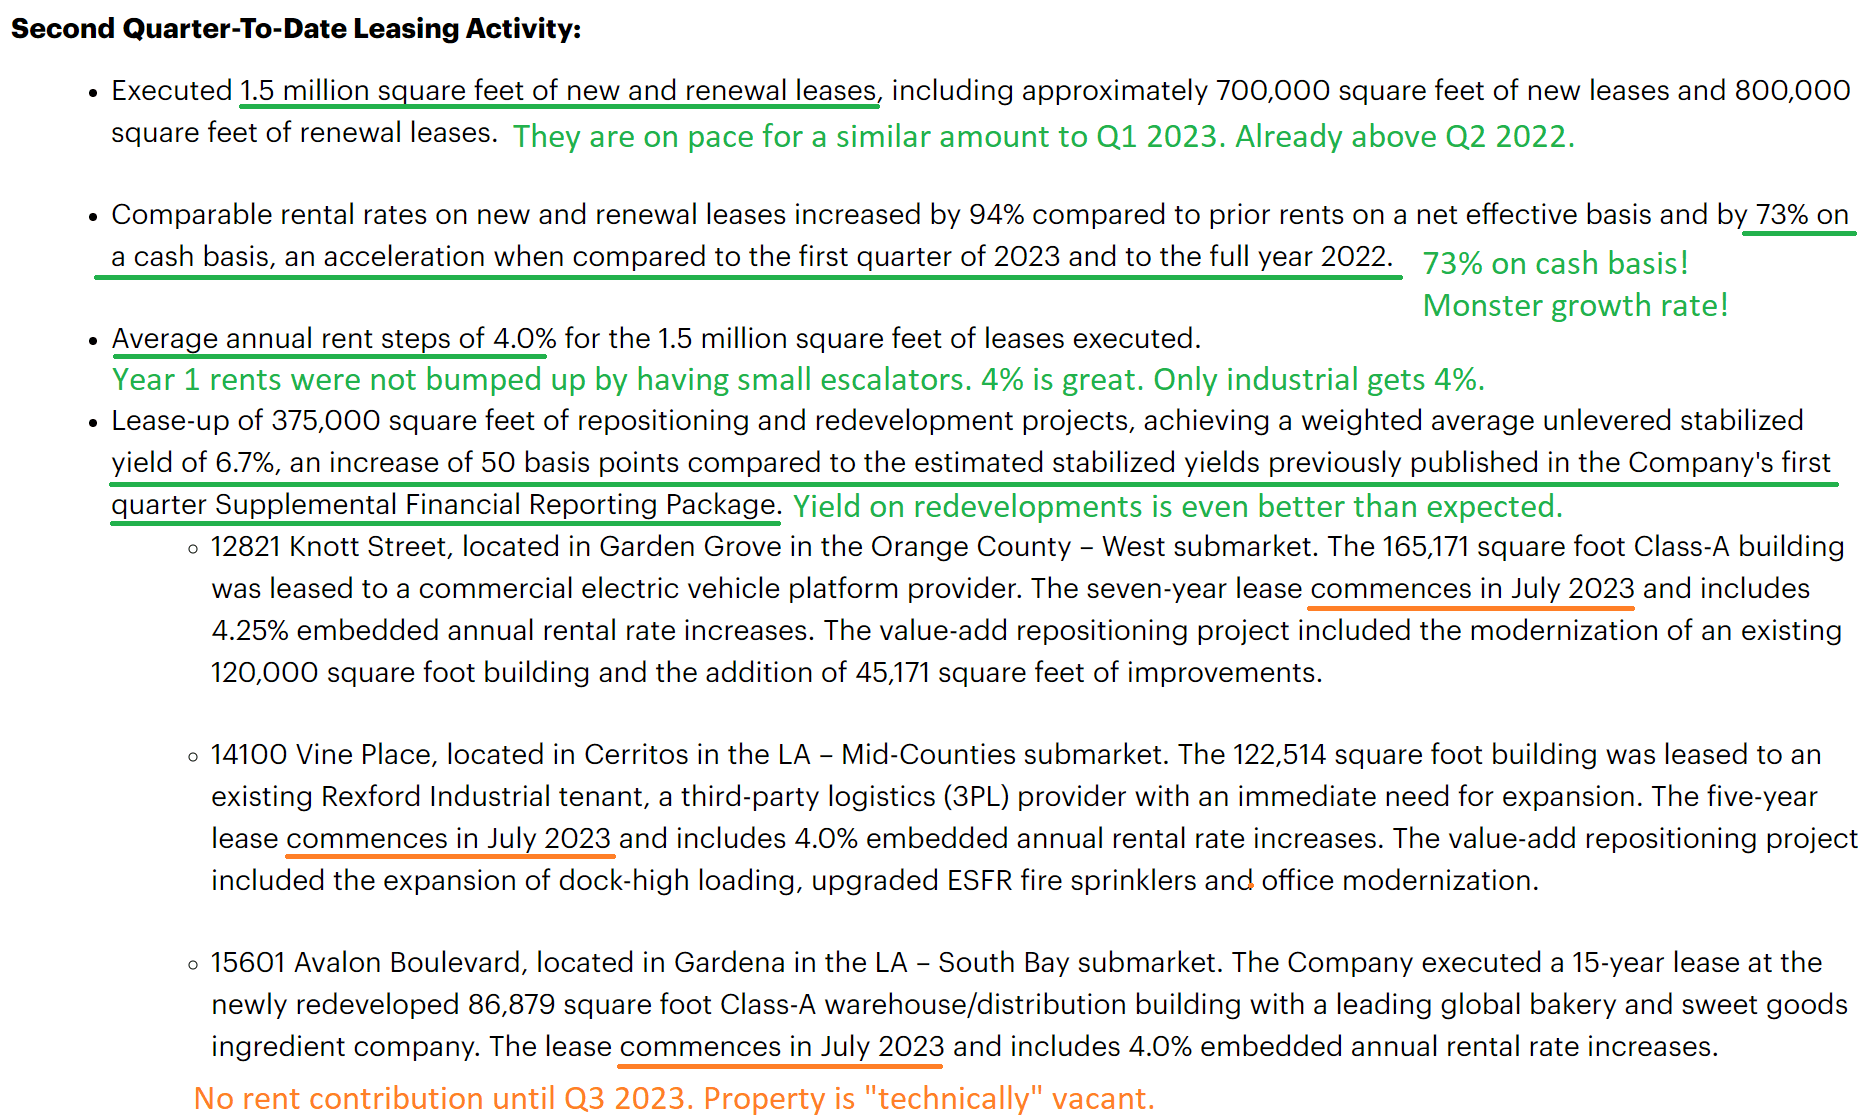
That looks like a great quarter so far. If cash leasing spreads end at 70% or above (73% so far), it would set a new quarterly record for the sector. The current record holder is TRNO, with 69% in Q1 2023. TRNO also has a chance to break the record in Q2 2022.
We bought more shares of REXR for $51.22 last Friday, and some members were able to buy it on Monday below $50.00. Shares have rallied back to $53.13 (as of Wednesday’s close), yet still represent a healthy bargain.
Were the huge leasing spreads exclusive to REXR’s portfolio?
No, Prologis provided an update as well:
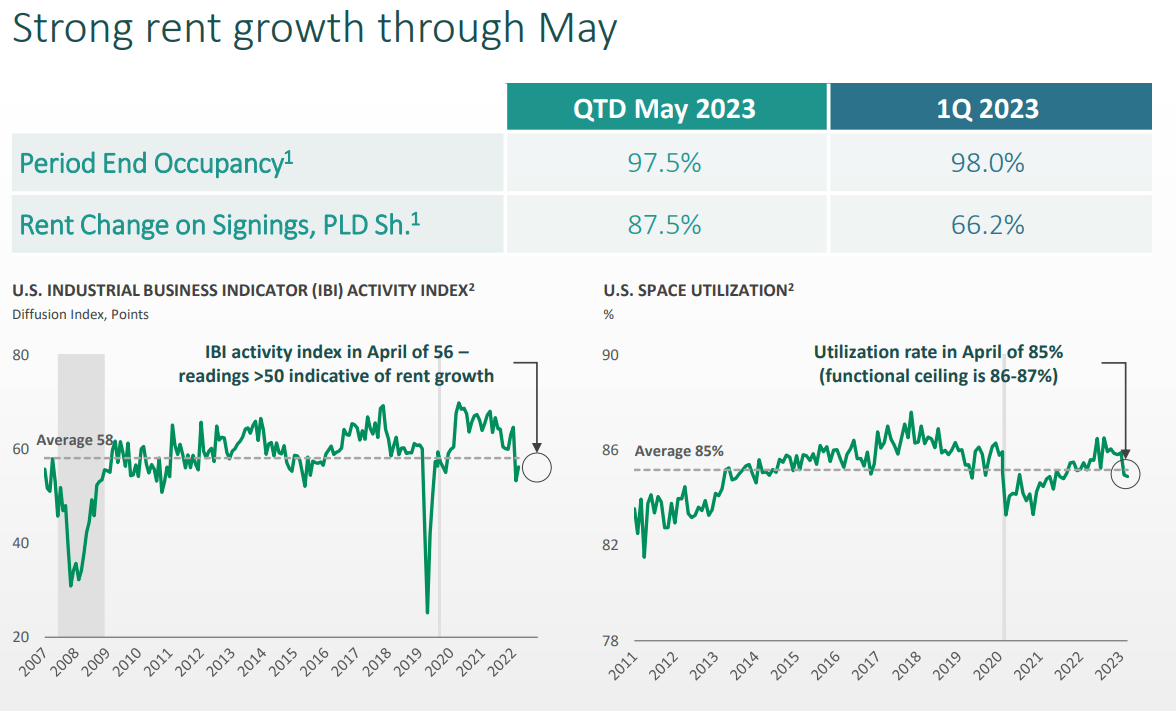
Note: The rent change QTD of 87.5% is not going to be cash rents. It will be a straight-lined figure, comparable to REXR’s 94% on straight-lined rents.
EastGroup Properties (EGP) isn't doing too poorly either. They haven't kept pace with PLD or REXR though. New and renewal leases averaged a 38.3% cash spread and a 50.9% straight-line spread.
When REITs Issue Equity
Some people get upset when a REIT issues new equity. They take a simplistic approach of thinking that more shares is bad. However, many of the best-performing REITs have issued a substantial amount of equity over the last decade. The question is whether the company gets enough cash and invests it efficiently enough to generate additional returns.
Allow me to demonstrate with a chart showing the change in weighted-average shares outstanding for four REITs:
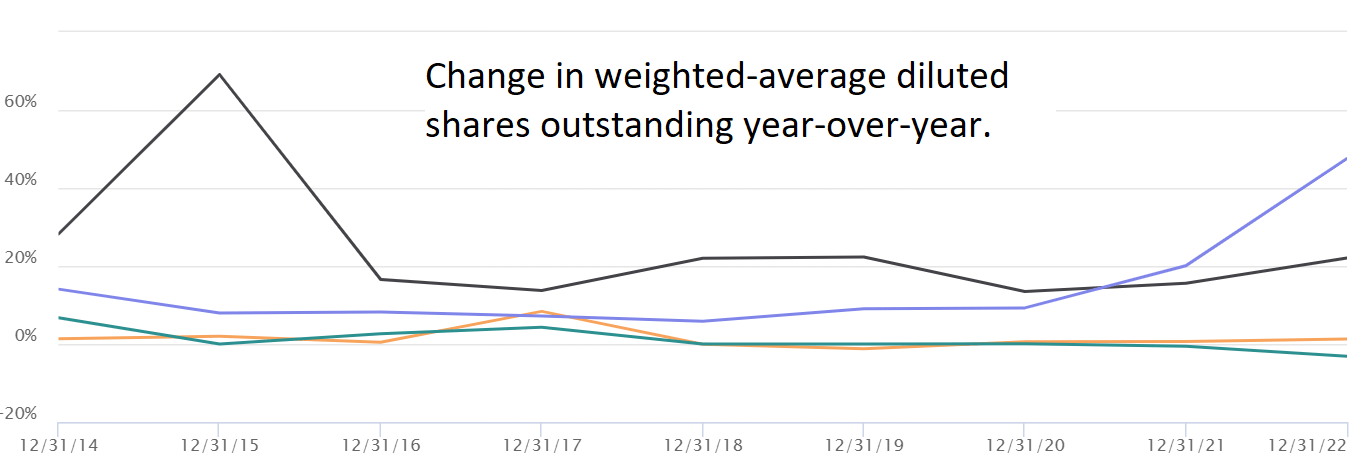
Can you tell from the chart which stocks delivered the greatest returns? Of course not. This variable can only be useful if you are building a bigger picture.
For reference, here is the key:

The black line is REXR and the purple line is Realty Income (O).
The bottom two lines were Franklin Street Properties (FSP) and Geo Group (GEO). GEO got a bunch of strong buy ratings while it crashed. GEO eventually dropped their REIT status, which gave them more flexibility on dividends. By more flexibility, I mean they cut the dividend to zero over two years ago and left it there:
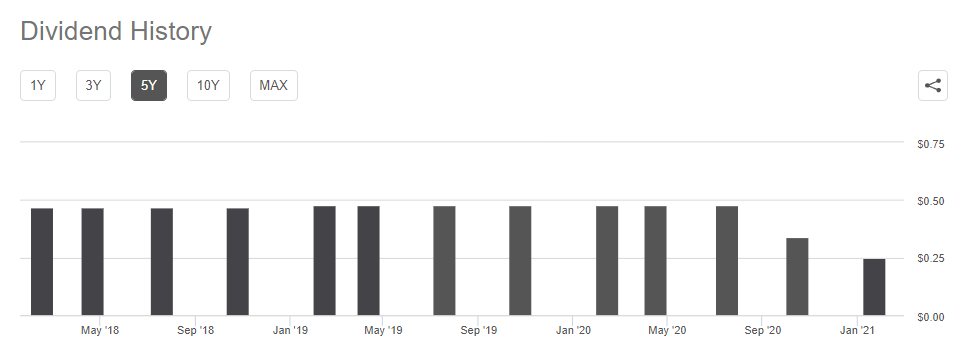
Source: Seeking Alpha
I pulled up a chart for their total returns (which includes dividends) over the same time period:
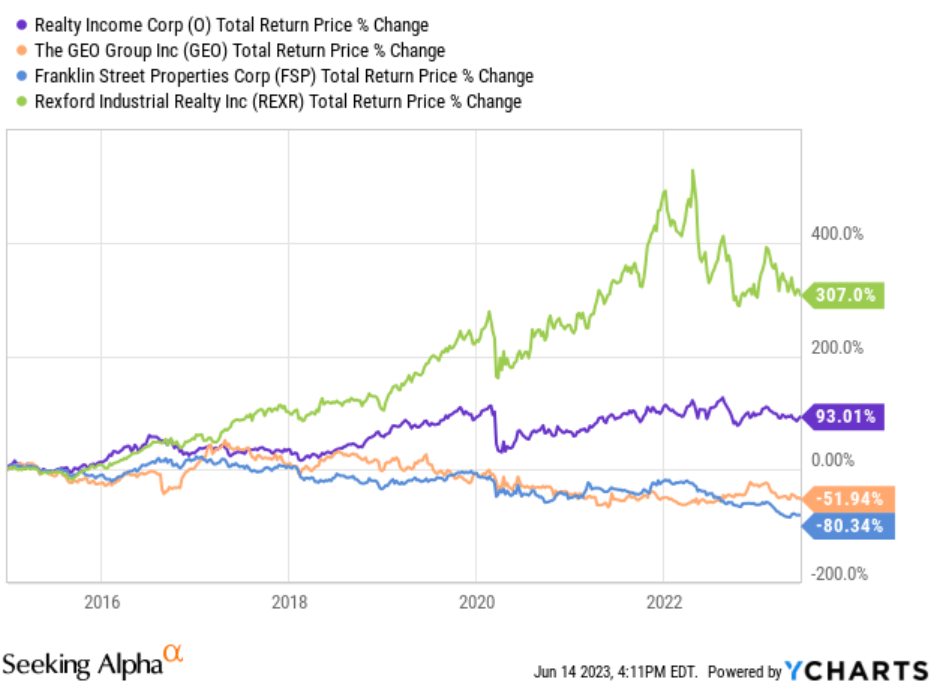
The bottom two lines for shares issued were also the bottom two lines for returns. It doesn’t always turn out that way. There are plenty of cases where a company issues stock when it should not be issuing stock. However, we don’t want to jump to conclusions. We should be aware of a company issuing stock and the transaction price, but we shouldn’t jump to conclusions.
REXR Issuing Equity
When REXR issued equity at $55.60 (proceeds net of fees will probably be about 1% to 2% lower), it didn’t look great. I don’t love the optics of issuing at that price. However, I do believe REXR will still be able to generate some value. Acquisitions and redevelopment carried cap rates in the 5.1% to 6.5% range. Even after cap rates increased over the last year, they are still running about 4.5%, so REXR was still generating value through redevelopments and acquisitions:
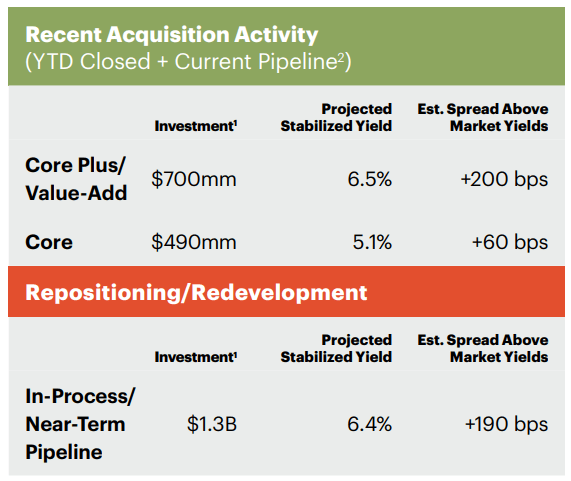
The reason REXR was still willing to issue shares is because they’ve had opportunities to generate accretive returns even accounting for the extra shares:
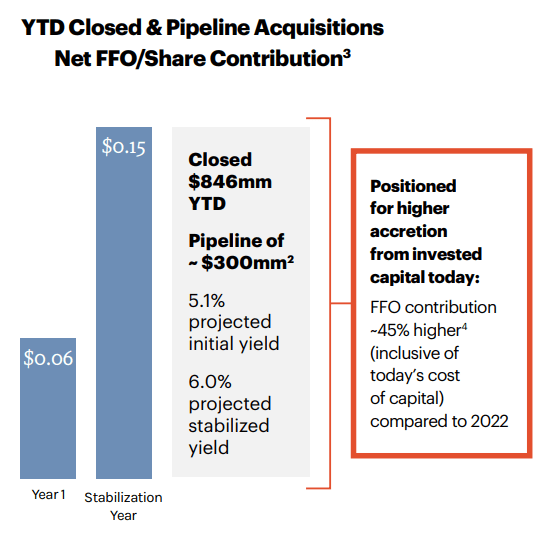
The acquisitions and development are part of how REXR has been able to achieve such massive growth rates in FFO and AFFO per share.
The Negative Factors
We already covered the negative factors. It was simply wrapped into a larger section.
There is negative sentiment around California in general. The negative sentiment is reinforced by seeing the net negative absorption of industrial real estate. However, the supply of industrial real estate in Southern California has been shrinking for years.
So what is net negative absorption? The simplified method is to just think of it as a dip in occupancy. As landlords, we prefer to see positive absorption, but occupancy is still at about 1.5%. That’s higher than it was a quarter earlier, but overall, a 1.5% occupancy rate still favors landlords:
Regardless, there has been a modest weakening of demand in California. It’s still strong, but not quite as strong as before. How did consensus estimates increase in that scenario? They started too low.
A Quick Reminder
We like industrial real estate because we expect rent growth to continue. The fact that expiring leases are vastly below market rates creates substantial embedded growth, but we still expect market rents to grow.
The reason we expect market rent to continue growing is because each dollar of e-commerce sales requires significantly more industrial space than a dollar of retail sales. PLD lists the difference as about 3x:
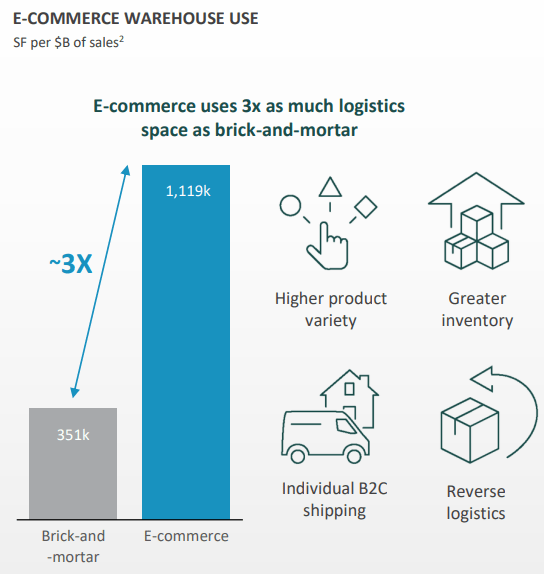
If you do the math on that (1,119 / 351), it’s just shy of 3.2x. As sales shift to e-commerce, the demand for industrial space grows. That is the big picture supporting industrial rents. As it stands, industrial rents are still very cheap relative to retail rents. As sales go online, we see a shift from needing retail space to needing industrial space.
REXR has premium real estate and commands higher market rents. However, their Q1 average cash leasing rates came in at $20.84 per foot for the first year. Higher than other industrial real estate, but still far lower than retail rents.
Conclusion
We remain confident in our industrial REITs delivering dramatic growth in AFFO per share over the next several years. That’s why we are comfortable having a strong buy outlook above 28.2x forward AFFO of $1.88 and 23.6x forward FFO of $2.25. As REXR’s existing leases are marked to market, ignoring the benefit of other opportunities, it would generate dramatic growth in AFFO and FFO per share:
I expect the ratio of AFFO to FFO will improve over the next several years because I forecast a decrease in recurring capitalized expenditures relative to FFO.
Even in a bearish scenario where market rents freeze (unlikely given E-commerce), REXR would generate a big increase in FFO and AFFO per share. In a normal scenario, market rents continue to grow and REXR gets even bigger increases in FFO and AFFO per share.
Math: REXR is using a current estimate of about $2.135 per share for 2023. That’s lower than the forward 12 months because it uses Q1 2023 instead of Q1 2024. Adding $1.90 would reach FFO per share of $4.035. At about $53.13 for REXR, that would be a 13.16x FFO multiple (if all leases were immediately reset to market rates).
It takes time to unlock that FFO because leases need to expire, but that math does not include growth in market rents or additional growth from smart acquisitions / development. It is just the growth from theoretically resetting every lease to current market rates.
While REXR has some of the largest embedded growth, having embedded growth is not unique. The other industrial REITs also have embedded AFFO growth. Consequently, we’re regularly looking for opportunities to buy into weakness. We don’t have to catch the very bottom on prices to look smart several years from now. We don’t have to worry about the REIT trading around 28x AFFO, when we see that kind of embedded growth. We can simply wait for leases to expire and be replaced by new leases at new market rates.
Disclosure: I added to our REXR position twice in June. Once at $51.22 on 6/9/2023 and again at $51.39 on 6/22/2023.
Like the article?
Share it with a friend:
Or just hit the like button. It’s always nice to hear from readers.
Member discussion