
Industrial REITs Deliver Again
Summary
- The industrial REITs continue to perform with strong leasing spreads driving same-property NOI.
- The sector is priced for growth. The reason for investments here is the expected future level of earnings generated at higher rent levels.
- Landlords have a very strong position in negotiations as restricted supply of industrial real estate meets consumer demands for more junk to be sold online.
- There isn’t an economically feasible way to significantly increase the volume of real estate available for industrial use within most major markets today.
- E-commerce requires significantly more industrial space to support each dollar of sales than traditional retail channels. The impact compounds over time.
This is an article we prepared for Seeking Alpha. You’re able to get early access to our public articles by following us here.
Industrial REITs have been rocking for several years and this year continues the trend. They deliver strong growth in same-property NOI and AFFO per share. There are only two difficulties for the sector. Prices are fairly high (measured in a few ways) and recurring capex eats into AFFO. Despite those disadvantages, they remain an interesting sector because the growth rate is simply so high. What drives that high growth? That’s part of the topic for today.
Prices
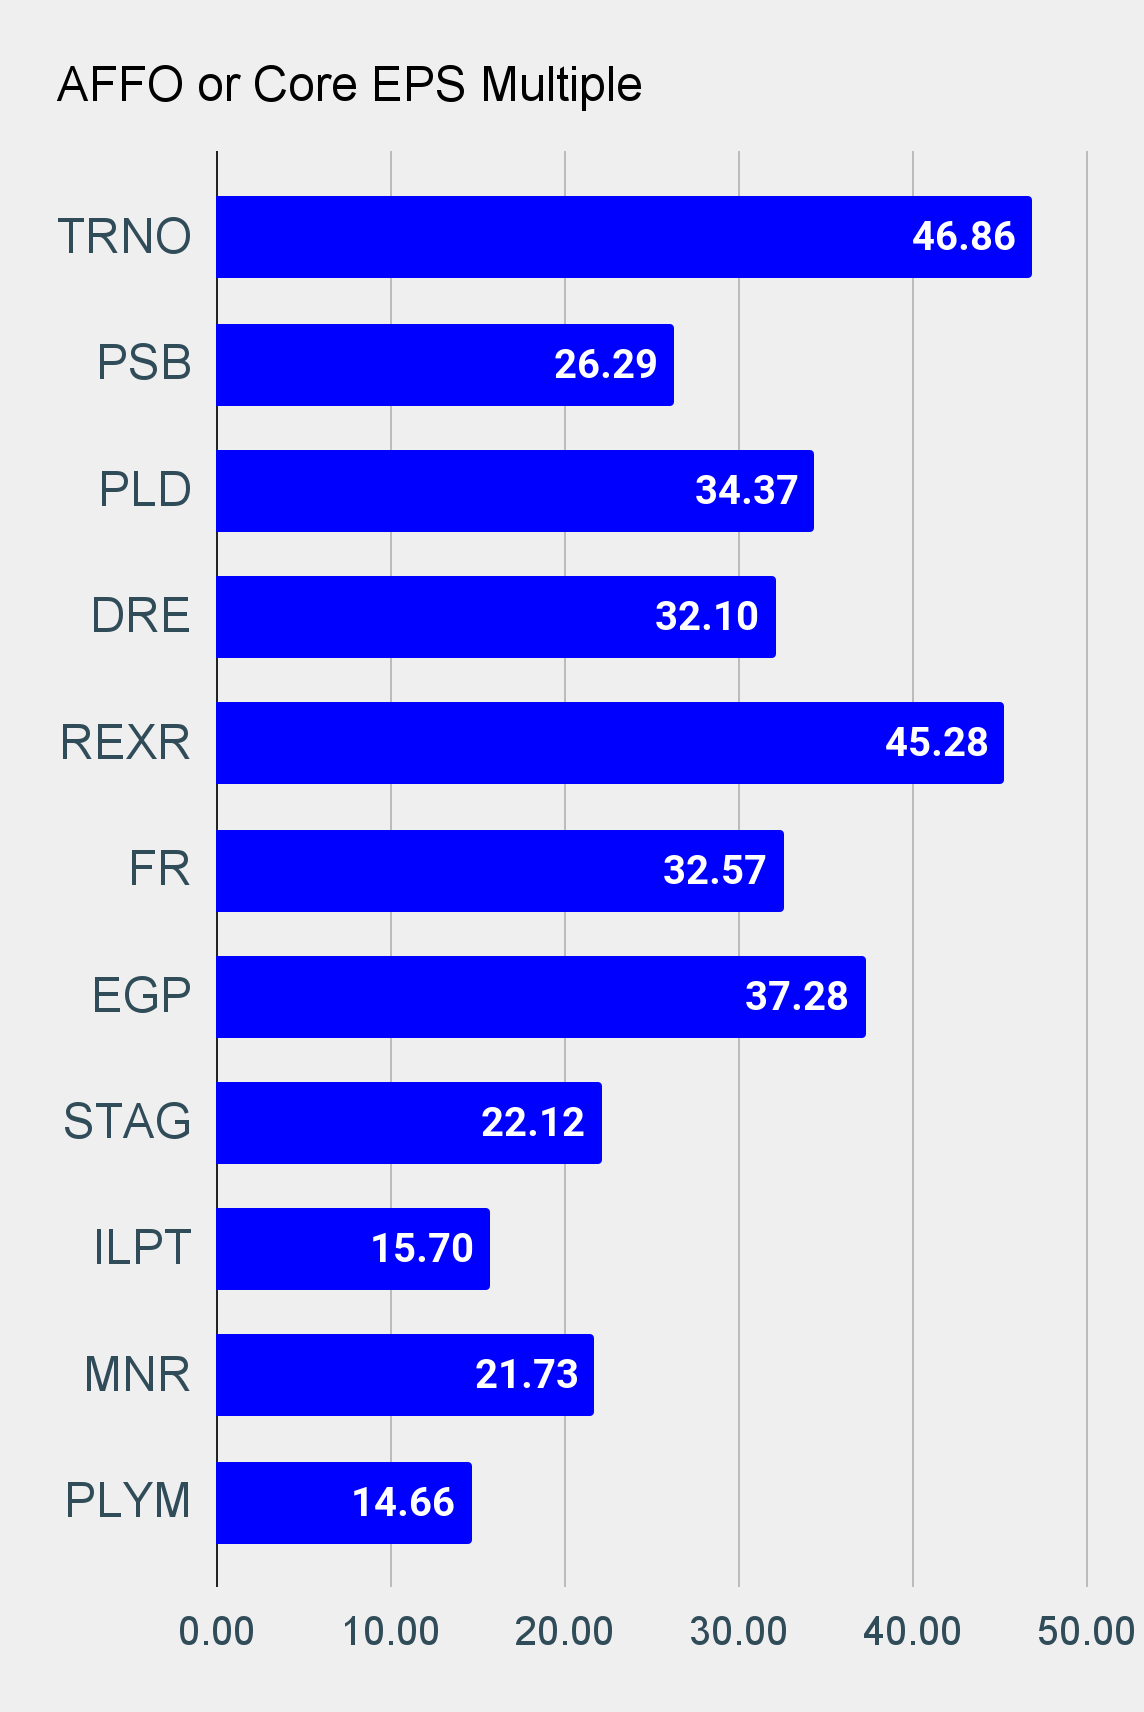
Industrial REITs as a sector command the highest AFFO per share multiples. If we view the REITs based on the implied cap rate, we see a similar picture. The implied cap rates are equal to the net operating income divided by the total of (debt plus market value of common stock minus cash and other assets at the analyst’s discretion) (net operating income divided by enterprise value, which is debt + market value of stock minus cash). Again, the market tells us that the REIT valuations indicate investors are willing to accept a very low cash return in the current period because of high growth expectations.
Do the REITs deserve high multiples? We believe they do, thanks to our expectations for growth.
Growth
We expect demand for industrial space to continue ramping up rapidly over the next several years. Occupancy levels are already high, so there aren’t many vacant properties available. The landlords have a strong position in negotiations with tenants and it has resulted in rapid increases in rent. Industrial real estate rents at lower prices per square foot than most other types of real estate and it facilitates a huge volume of sales (including online sales) for the tenants. Thanks to that lower rent level today, tenants can afford to eat significant increases in rent so long as the rest of their business is functioning.
Consequently, investors should expect to see large spreads between the rate on expiring leases and the rate on new leases. Those spreads should be absurdly large under GAAP (which uses the average revenue per year on the lease) and under cash reporting (which compares the first year of a new lease to the last year of the old lease).
Cash Spreads
Rental rates generally increase throughout the lease. Consequently, the most expensive year of the old lease is the last year. The least expensive year of the new lease is the first year. Therefore, cash spreads will generally be much smaller than GAAP spreads. Fortunately, many REITs provide both metrics which helps investors get a more accurate comparison. However, we should highlight that for smaller industrial REITs, since there are fewer renewals in any given quarter, there can be a little extra volatility between one quarter and another.
How high should the cash spreads be? In some cases like Rexford (REXR) and Terreno (TRNO), we expect it to be in the teens or higher. For many other industrial REITs, cash spreads in the high single digit percentages or low double digit percentages are still excellent.
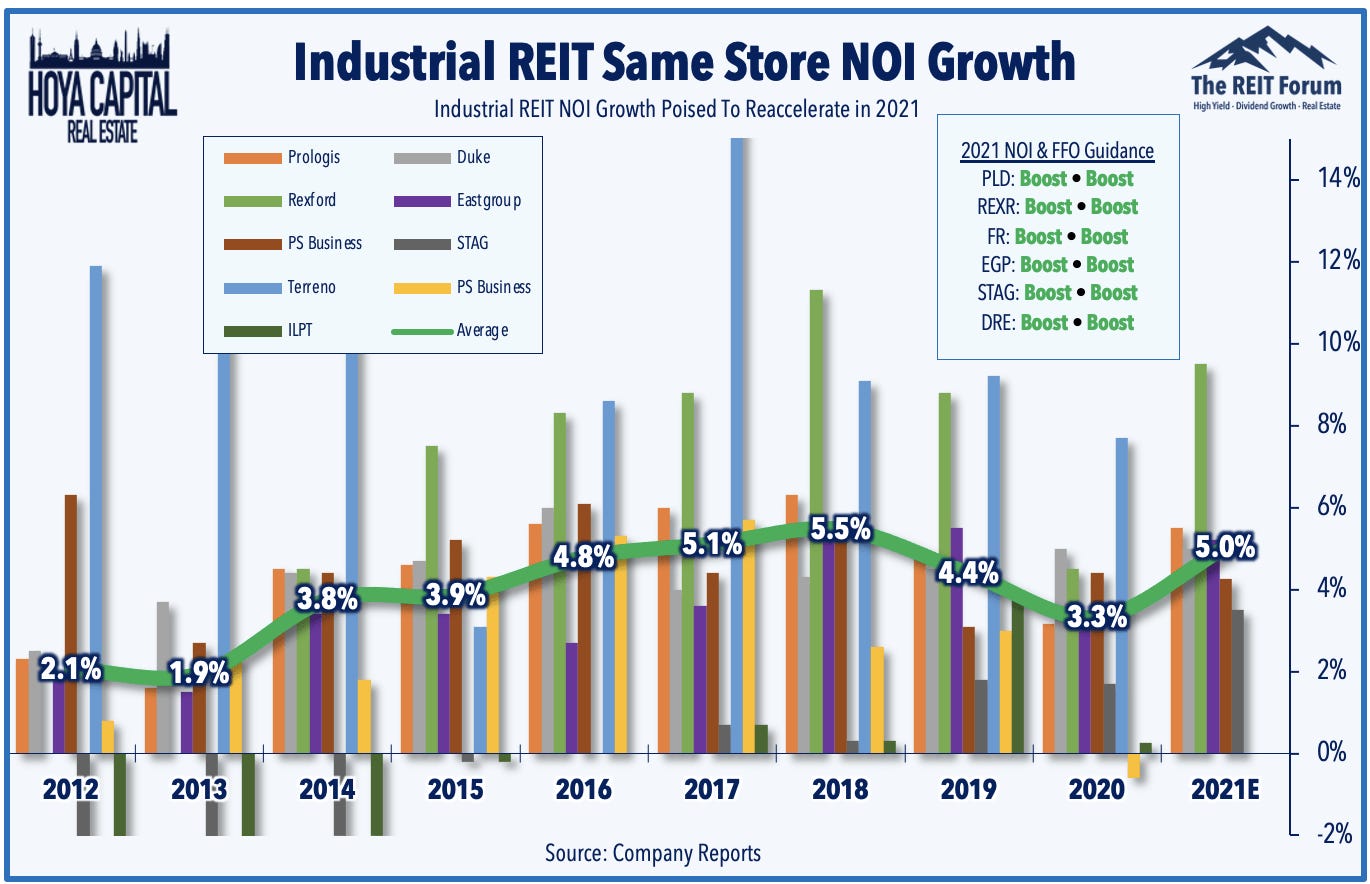
Thanks to the strong leasing spreads and embedded escalators within leases, industrial REITs are on pace for another strong year of growth in same-property NOI (net operating income):
Issuing Above NAV
This is another important part of the total return picture. NAV stands for “Net Asset Value” and when we use the term “NAV”, we are generally talking about “per share”. If we are not talking about the metric on a “per share” basis, we will explicitly refer to the “Total” such as “Total net asset value”.
We believe that industrial REITs will generally trade above NAV most of the time for the next several years. During that period we believe they will issue new shares and continue to buy additional properties. This increases NAV per share because the total net asset value (that’s assets minus debt) will increase faster than the rate of shares outstanding. However, the balance sheet can be confusing for investors. Under GAAP (which we use in the United States), the real estate value is recorded at the purchase price minus depreciation, unless the REIT determines the value should be even less. However, if the property were to double in value, that increase in value would not be recorded on the balance sheet for an equity REIT.
Regardless, issuing above NAV is usually good for common shareholders. I won’t say “always”, but the vast majority of the time it is positive. We’ve mentioned the importance of issuing above NAV frequently for triple net lease REITs. For industrial REITs, it is a smaller part of the business model. However, it is important when it comes to evaluating the current valuations.
Why Would You Ever Pay Above NAV?
Let’s assume for a second that all REITs were to trade at NAV all of the time. Which REITs would you buy? You’d want to pick the best property type with the best managers and the lowest cost of debt financing. If you’ve been with us for a while, you may recognize that we tend to buy REITs that are competing on all three of those factors. Yet REIT share prices are not tied to NAV. They can deviate, sometimes materially, and create opportunities that are much better (or worse). Further, finding NAV for equity REITs requires quite a bit of guessing. We can state confidently that at least some major investment banks have poor estimates when it comes to NAV calculations. How can we say that? We can point to instances of severely conflicting reports. If this is an area of interest for subscribers, I can provide some examples.
If you could go back about 20 years to buy some REITs, what are a few that come to mind? Realty Income (O) and Sun Communities (SUI) deserve to be on any list. They’ve regularly issued shares above NAV and used the proceeds to fuel accretive growth. They didn’t deliver amazing returns “despite” issuing shares, they delivered amazing returns in part “because” they issued shares. If you could be certain a REIT would trade above NAV for the next 20 years (hypothetically), you could be pretty confident that they would deliver strong returns.
Since investors recognize that they would prefer certain property types, would prefer certain management teams, and would like lower costs of financing, they would bid over NAV for some REITs even if they knew the real NAV (as opposed to relying on consensus estimates). As soon as you accept that premise, then you must (logically) also accept that these REITs will benefit from issuing shares over NAV. Accepting that point leads us to the premise that AFFO per share and NAV per share will see accelerated growth. When we accept the accelerated growth, we then have to think about how much more the shares are worth because of our expectations for that growth.
That may seem like a leap at first, but the entire process flows logically. Further, decades of investment returns have supported this technique.
First Conclusion
Despite the high AFFO multiples seen today, there is still some value in the industrial REIT space thanks to the extreme levels of growth. The growth can be seen in several metrics, but one of the clearest indicators looking forward is the leasing spreads. Exceptional strength on leasing spreads reflects that landlords and tenants agree on the importance of having access to industrial real estate in the right markets. This doesn’t mean we’re bullish on every industrial REIT or that investors should ignore the AFFO multiples or price-to-NAV ratios. Rather, it indicates that we see strong continued growth justifying high multiples in a market with fewer opportunities.
Ratings:
- None

The charts in this section will still be updated for each new article, but the rest of the text for the public version will be mostly repeated from piece to piece. We structure the article this way because the repeated sections are extremely important to understanding REIT investing, yet we find people rarely click links to access additional information. Therefore, it needs to be in the body of the article so any reader can easily refer to it.
Note: These charts are a bit too big. We’ll be looking for ways to get the size just right in future articles, but for now they will probably be absurdly large.
Cheap Stays Cheap
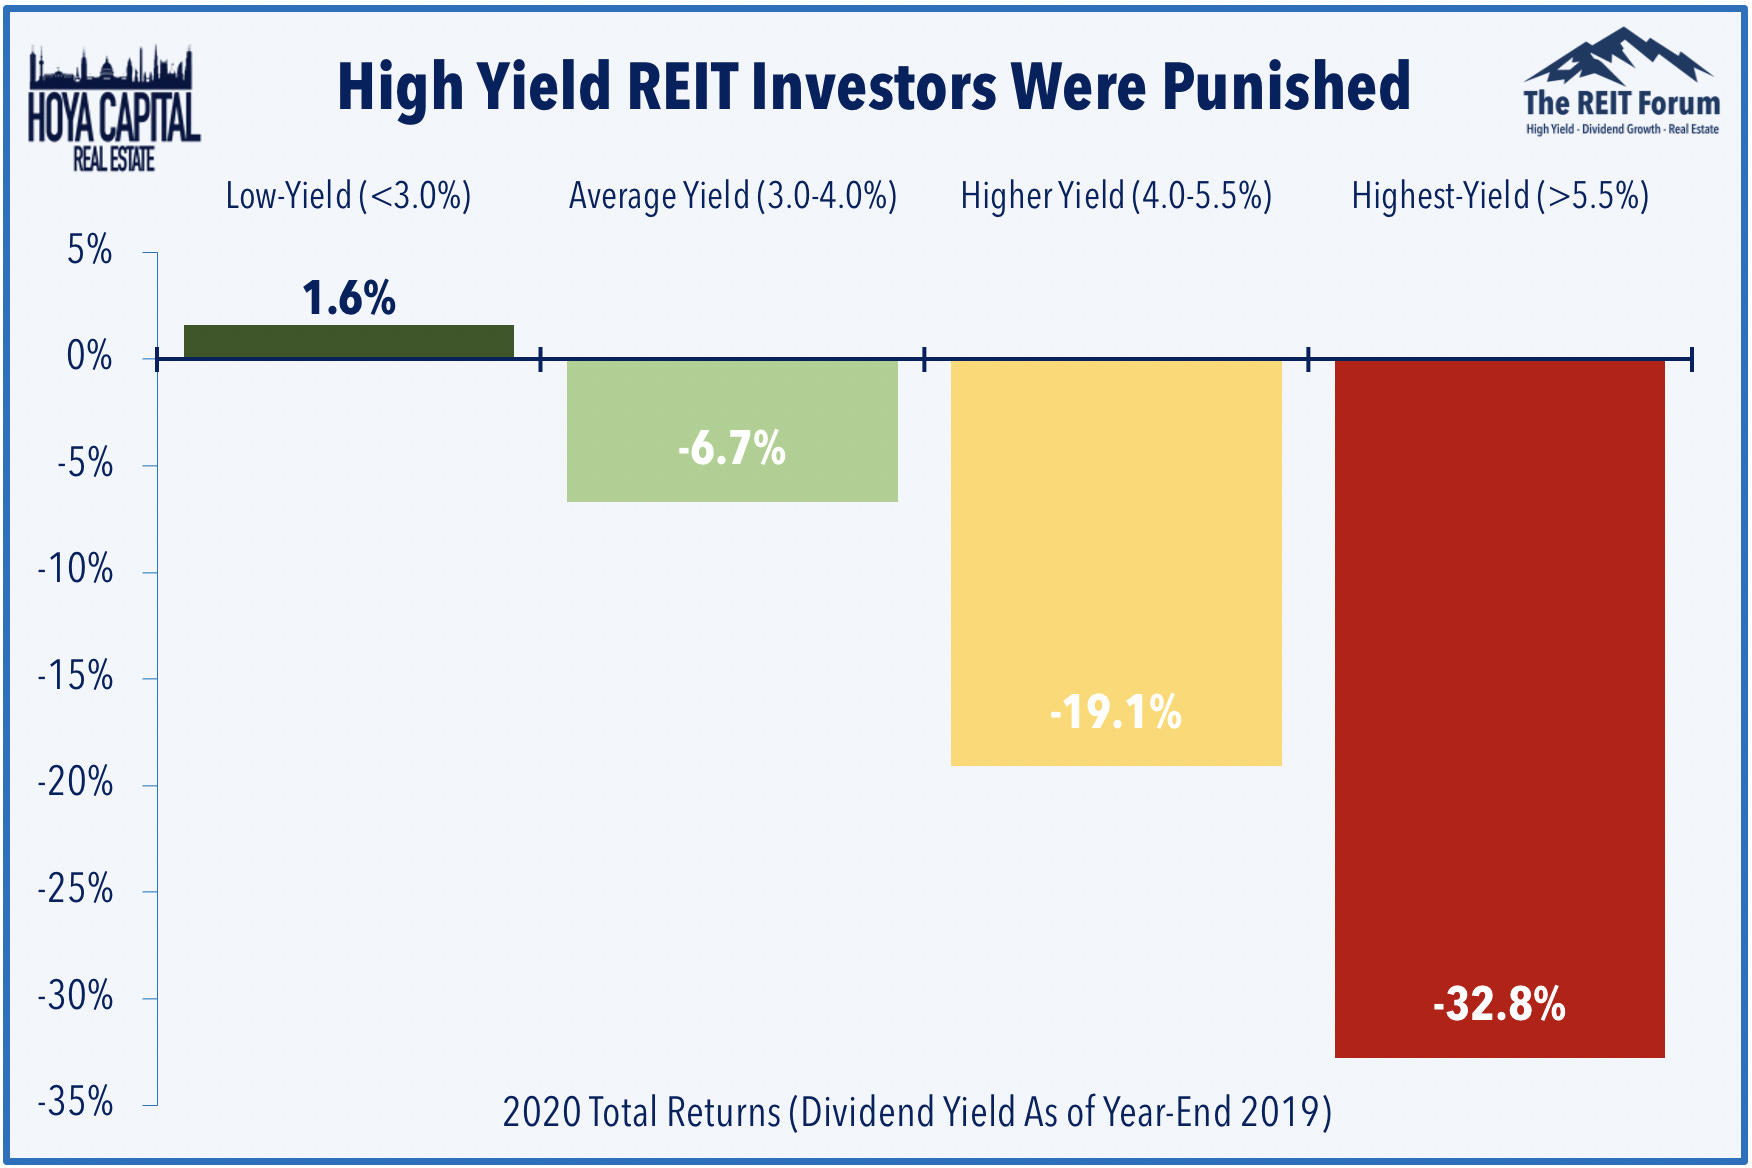
When Hoya Capital Real Estate wrote Cheap REITs Stay Cheap, he said:
“While the allure of high yield REITs can be tempting, we've stressed in our research that while there are no shortcuts in REIT investing, that one can indeed "tilt the playing field" in one's favor by having the discipline to focus on high-quality names and long-term dividend growth rather than "juicy" yields that can be cut at any moment. High yield REIT investors had a rough 2020 as REITs in the highest quadrant of dividend yields entering 2020 plunged more than 30% and saw the vast majority of dividend cuts while REITs in the lowest dividend yield quadrant produced positive total returns.”
He hammered the point home with this chart:
Misconceptions
There are a few common misconceptions. Sadly, these are so prevalent that I need to address them on a regular basis.
- Several investors who have begun to learn about NAV believe that buying at a large discount to NAV is always a good idea. While a discount can be attractive, it shouldn’t be used in isolation. REITs that persistently trade at a large discount to NAV simply do not outperform.
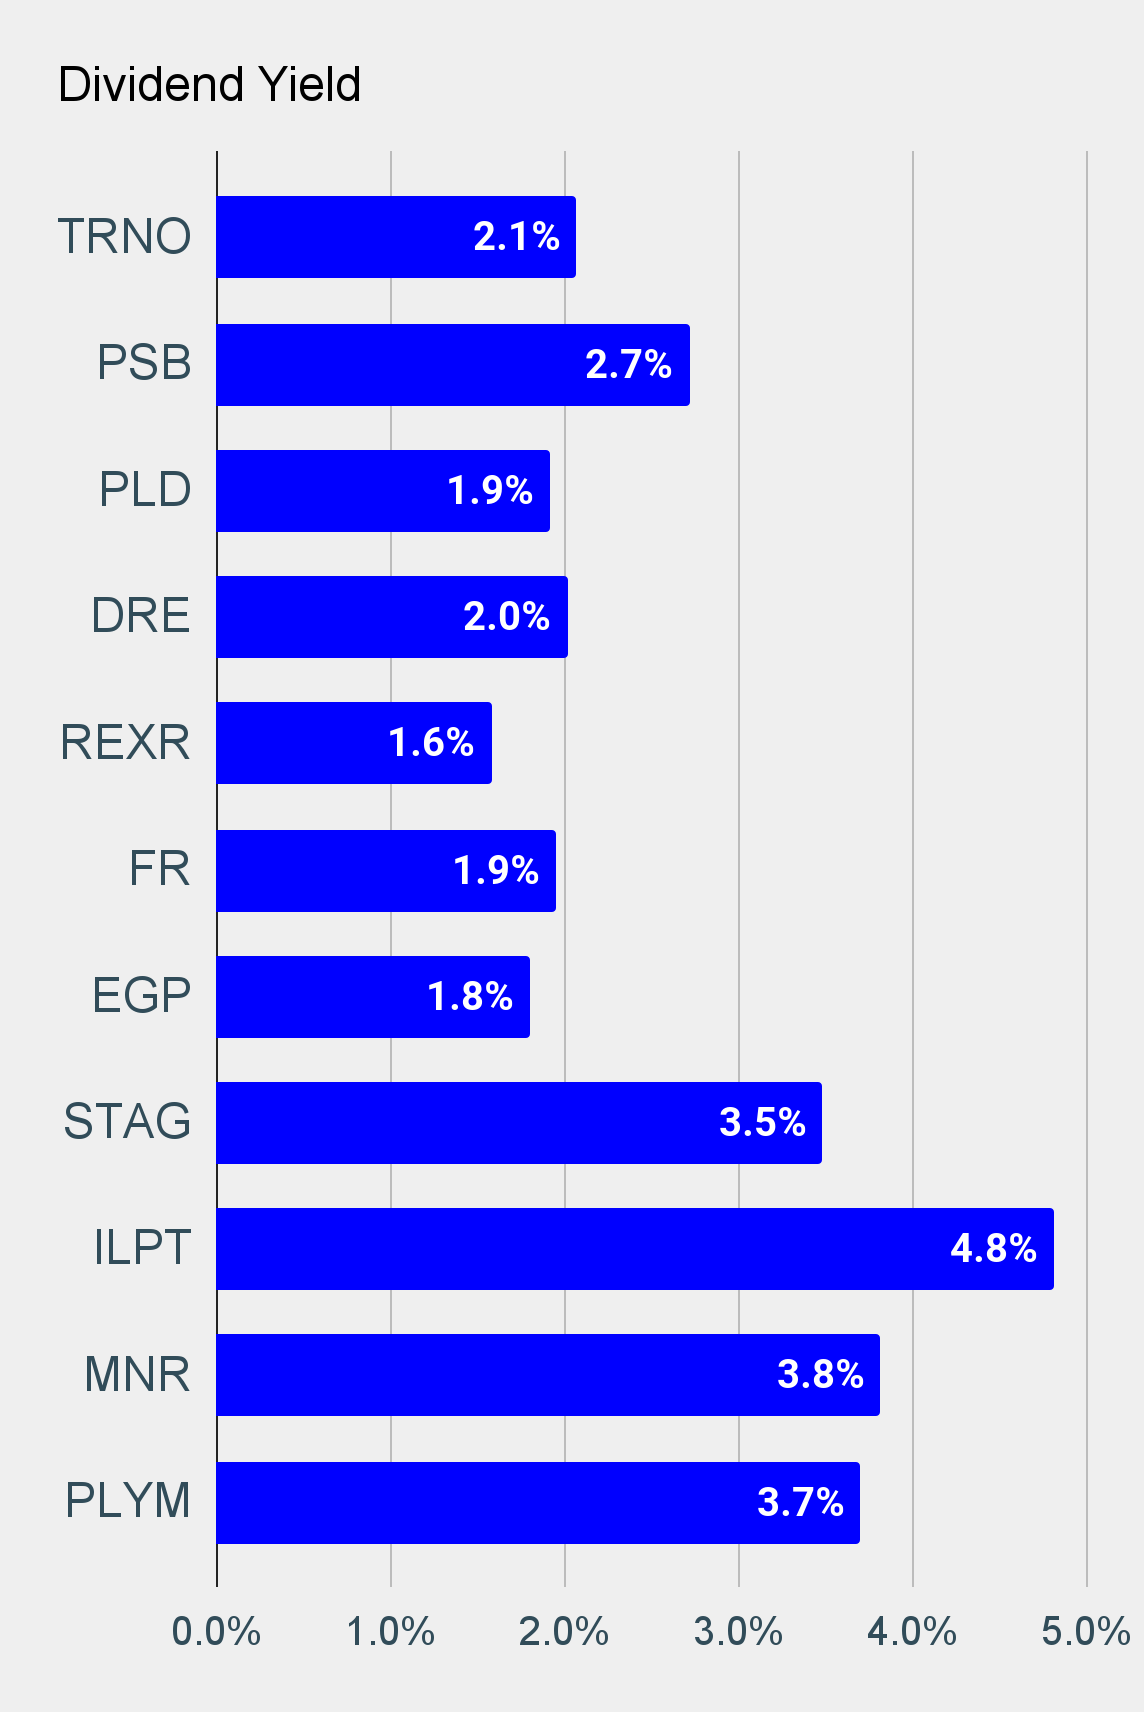
- Many investors believe that by “demanding” a higher return in the form of dividend yield they can achieve higher returns. This doesn’t work. It has never worked. It regularly results in worse returns.
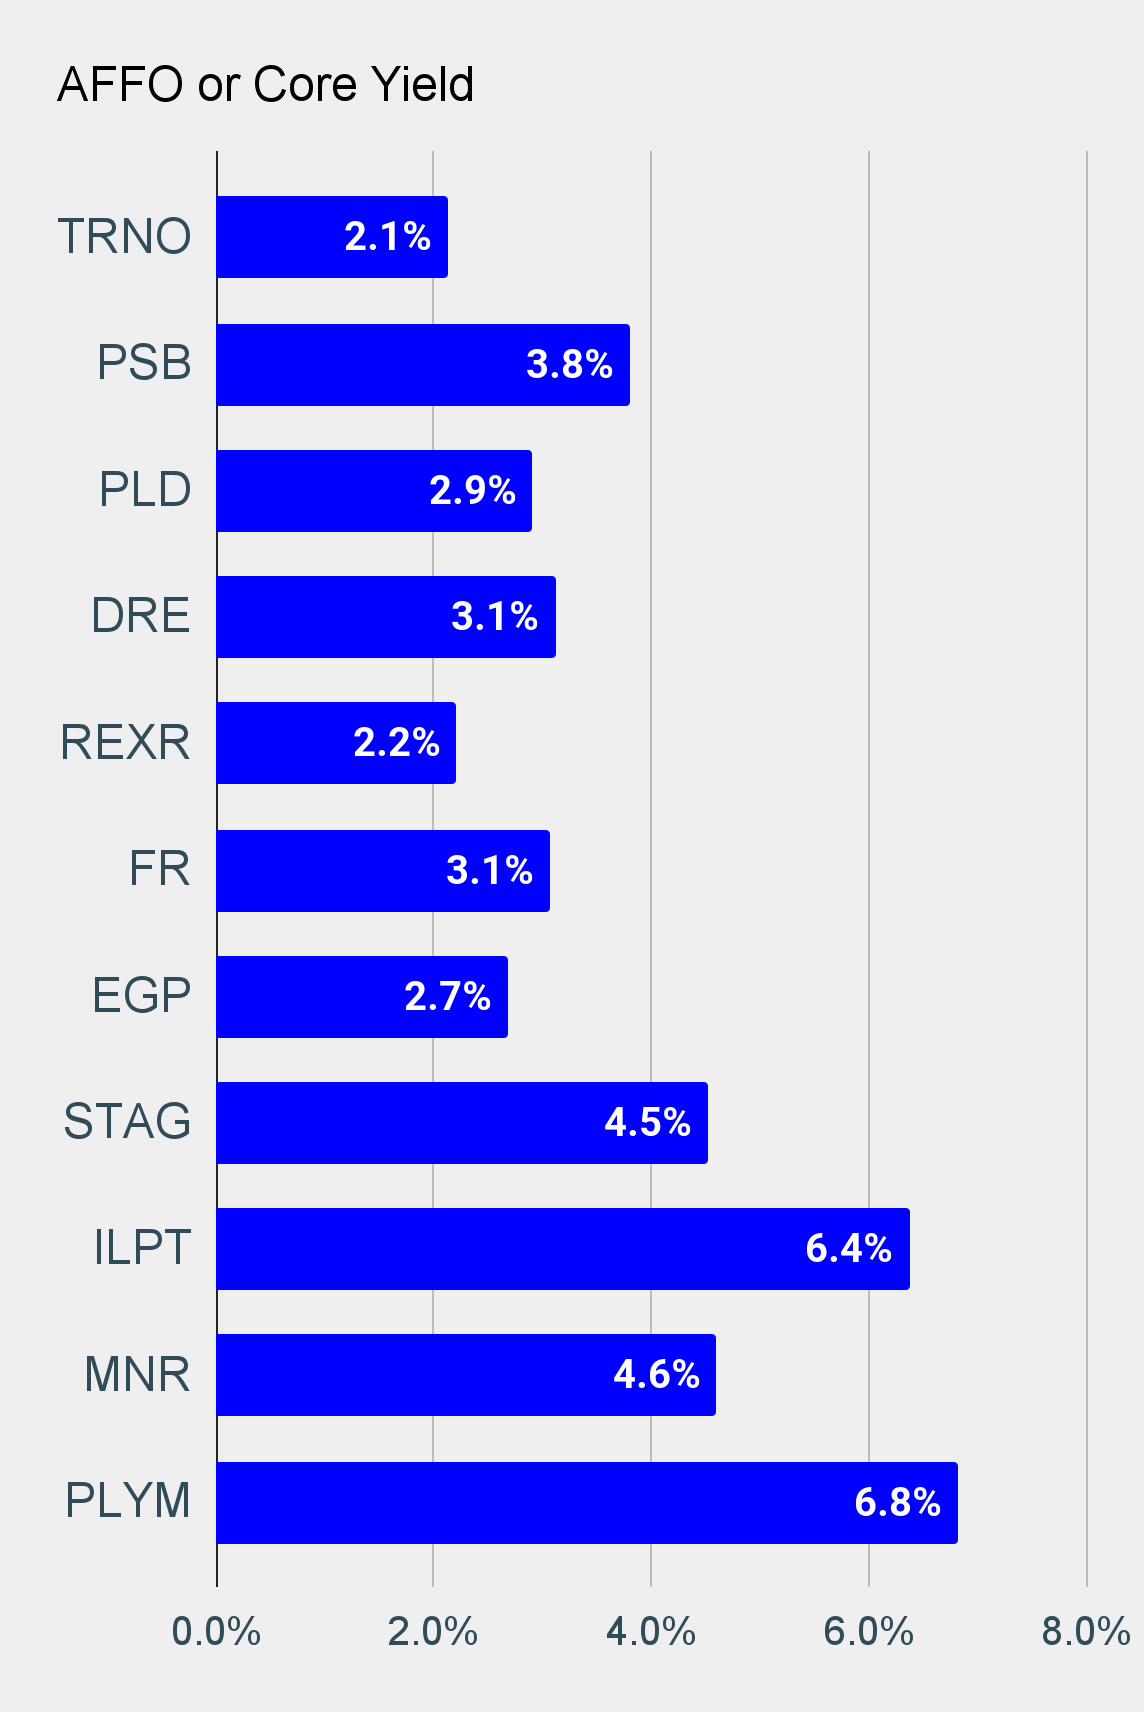
- Many investors believe FFO can be used in isolation to determine if a REITs dividend is safe. This is categorically false. We’re providing charts using “Analyst AFFO”, which subtracts for recurring capitalized expenditures such as replacing roofs and repaving parking lots. If you owned a physical building, could you spend rent money on replacing a roof and then spend the same dollars on paying for a cruise? No. If you stick to using FFO instead of AFFO, you will fail dramatically at valuation.
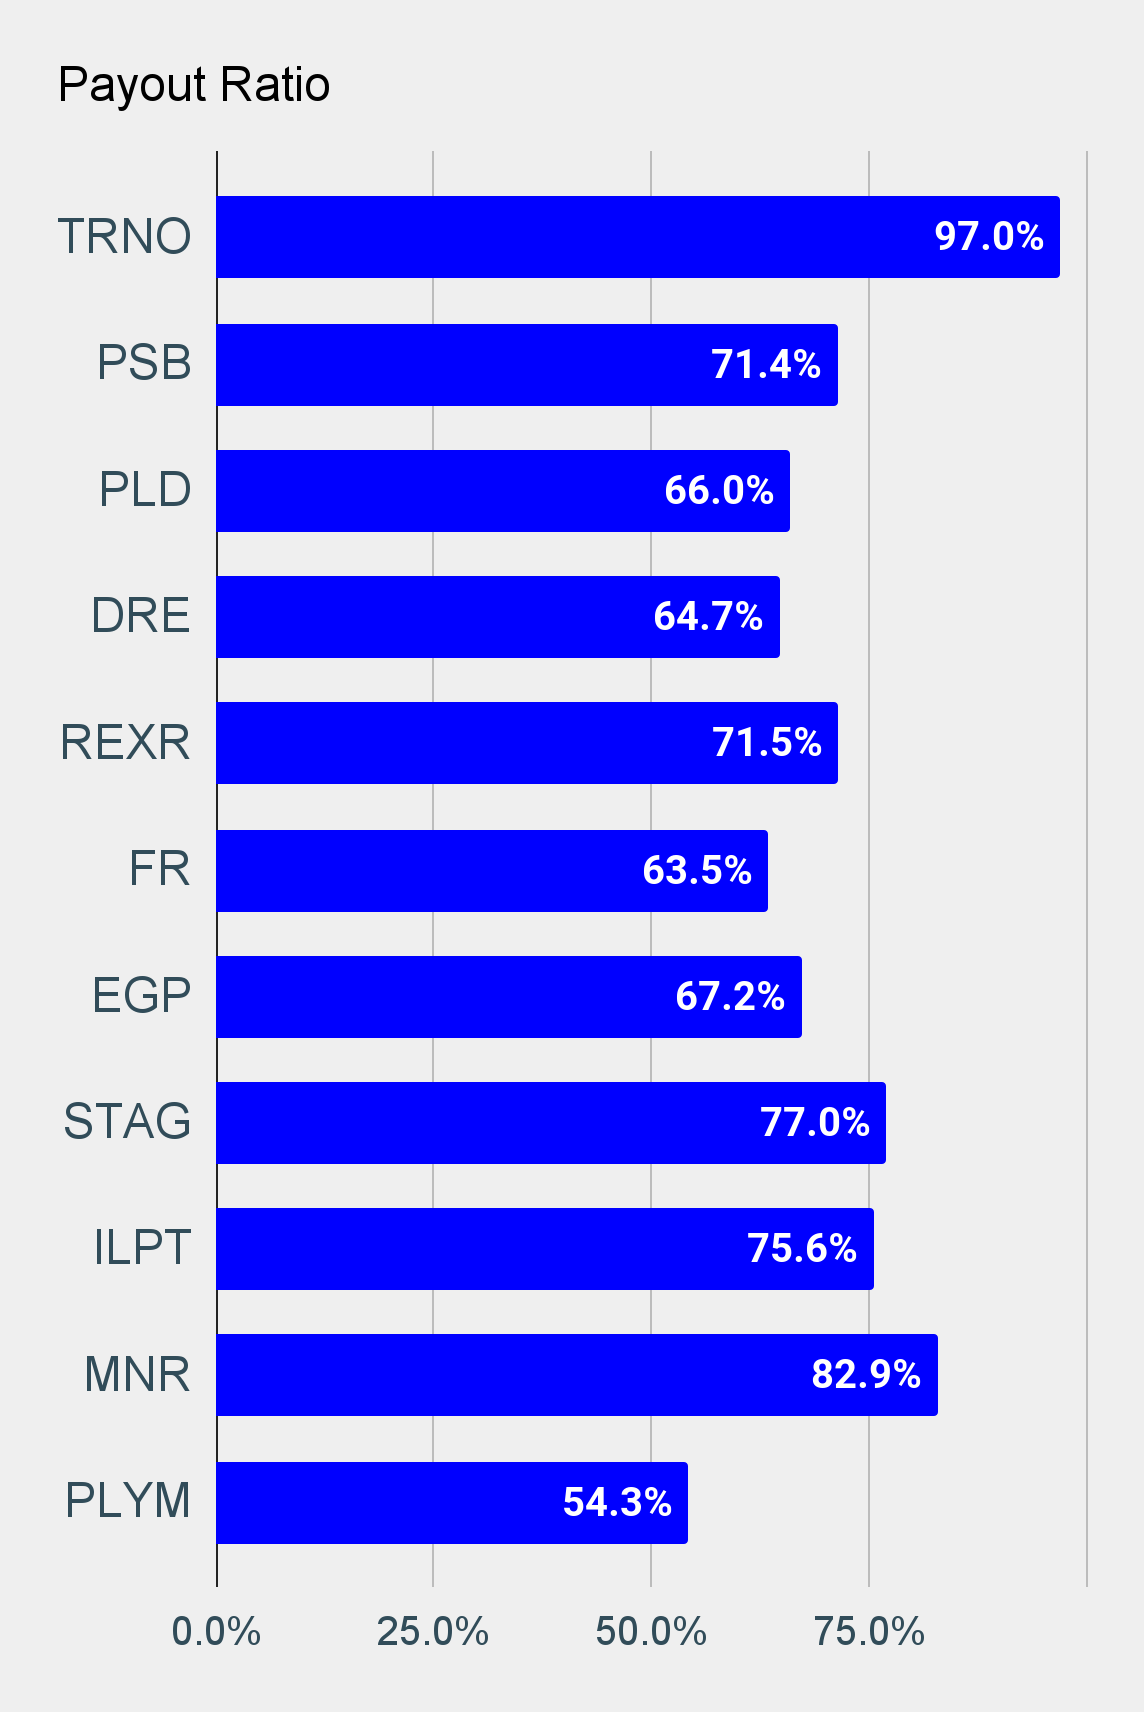
- Some investors think payout ratios in a single year are enough to tell them everything they need to know. That isn’t true either. Sometimes there are non-recurring factors that can still impact “Analyst AFFO”. Despite attempts to standardize definitions, there are some unusual factors that can still have significant short-term impacts. That doesn’t mean you can shrug off a high payout ratio, it means you need to dig deeper.
- Many investors fall into one of two extremist camps. The first camp thinks no one can beat the market regularly, therefore they are only interested in index funds. Ironically, these investors still choose several different index funds instead of just using one target date fund, which automatically diversifies their holdings. The second camp assumes that beating the market is simple and becomes overly confident. These investors may often be heard disclosing trades months later, but never in real-time. You can guess why.
Member discussion