
Higher Interest Rates And Popular Lies (Part 2)
This is part 2 of our series “Higher Interest Rates and Popular Lies”.
You can click here for part 1.
As a reminder, the main points of the series are as follows:
Summary of Series (includes Parts 1, 2, and 3)
- The Federal Reserve has talented economists. However, they have relied upon facts which were later proven to be definitively false. (Part 1)
- Evidence from the 1980s demonstrates inflation was actually driven by cost of production. The Federal Reserve raised rates and inflation declined, but correlation is not causation. (Part 2)
- Today we are seeing a similar situation in the cost of production. Supply has been reduced, driving prices higher. Higher interest rates reduce production, rather than increase it. Bad solution. (Part 3)
- The free market is already working to reduce inflation. By raising rates as the market works, the Federal Reserve can yet again claim victory for a battle they didn’t fight. (Part 3)
- This policy has the potential to create a recession, reduce output, spur trillions of additional deficit spending, and drive billions in net interest income to Bank of America. (Part 3)
Part 2
The Popular Myth: Interest Rates Are The Cure for Inflation
Before we begin, allow me to emphasize that interest rates do have an impact. They are one tool that can impact inflation. However, impacting inflation and curing inflation are dramatically different.
With year-over-year inflation (but not multi-year inflation) running into double digits, people are recalling the 80s. A time when, as popular culture tells it, the only way to solve inflation was through ruthless interest rate hikes.
It would take a lion of a man! Someone willing to create a severe recession to slay the beast of inflation. Someone with the courage to sacrifice another person’s job for the sake of bringing down inflation.
Looking At The Narrative
We should begin by visualizing the change in CPI, the change in 1-year Treasury yields (as a proxy for short-term rates), and the recessions:
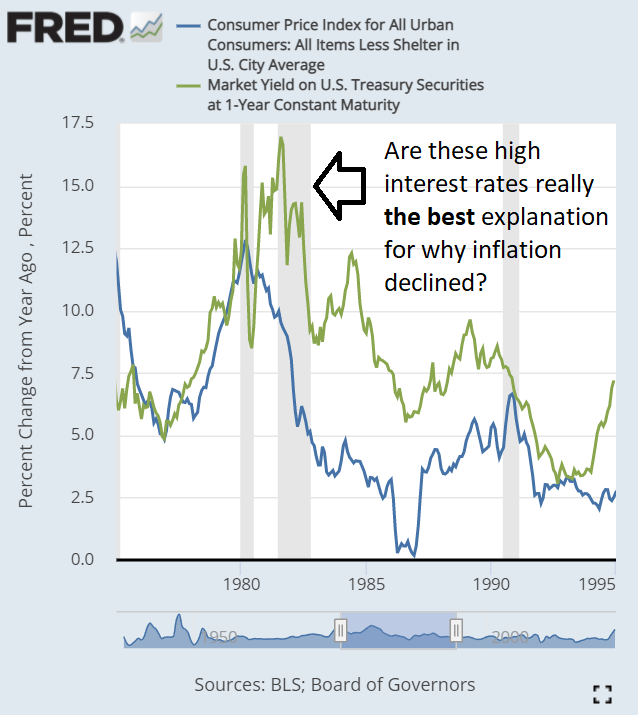
There are a few observations to highlight:
- Raising interest rates significantly appears to have contributed to the recessions.
- Prices (using inflation) were still rising significantly throughout the early 1980s.
- Inflation measured year-over-year peaked in early 1980. The rate of inflation decreased significantly over the following years, from over 12.5% to around 6%. That doesn’t mean prices declined, but the rate of inflation slowed.
- The rate of inflation for this period bottomed out from 1986 to 1987.
With interest rates peaking in the early 1980s and inflation plunging, the Federal Reserve took credit. This narrative is so widely circulated that it is even repeated by Nobel Prize winner Paul Krugman. Could we really expect him to depart from the groupthink? If top economists were challenging the existing theories, the myths around negative interest rates and the monetary base driving inflation wouldn’t have persisted for decades.
An Alternate Explanation
If we are willing to put aside the things we were told about interest rates, we can evaluate the evidence. We begin with supply and demand. These are the factors that actually drive inflation in the absence of price controls, so we should be asking ourselves what factors can have a substantial and fairly quick (within 1 year) impact on either supply or demand.
The Big Demand Factor
What would cause the typical American family to cancel planned expenses?
- Lack of money.
That list doesn’t actually need any more bullet points. Maybe someone lost their job. Maybe they were barely getting by and increased gas or housing costs eliminated the wiggle room in their budget. Regardless of the reason, lack of money is a major factor in reducing demand.
The Big Supply Factors
What influences supply? There are a few factors to consider, so I’ll rank the ones I consider most important by how quickly they impact supply:
- Competition
- Cost of production
- Cost of investing in new capacity (interest rates influence this one)
We can see that competition has the largest impact by looking at recent examples. For instance, when brokers began cutting fees on trades the prices charged to consumers plunged rapidly. Within a week, several brokers went to a $0.00 commission as they responded to competitive pressure. Competition works.
The next factor is the cost of production. Suppliers may be locked in at contracted rates for a given period of time, but companies won’t continue to sell at a loss. Higher costs of production are passed on to consumers. This could be a process that takes months or years.
The final factor is investing in new capacity. If it is too expensive to invest in new capacity, then those investments won’t be made. That gradually leads to less intense competition as the amount of goods or services which can be produced is limited. In this sense, raising interest rates would increase inflation long-term by reducing productive capacity. However, it takes several years for this impact to be seen and therefore it is usually ignored.
The Producer Price Index
We can’t chart “competition” very effectively, which is unfortunate. However, we can chart the cost of production and compare that with the changes in the CPI. We’ll do that using the PPI, which is the “Producer Price Index by Commodity: All Commodities”. This gives us a reasonable idea of the cost to produce things:
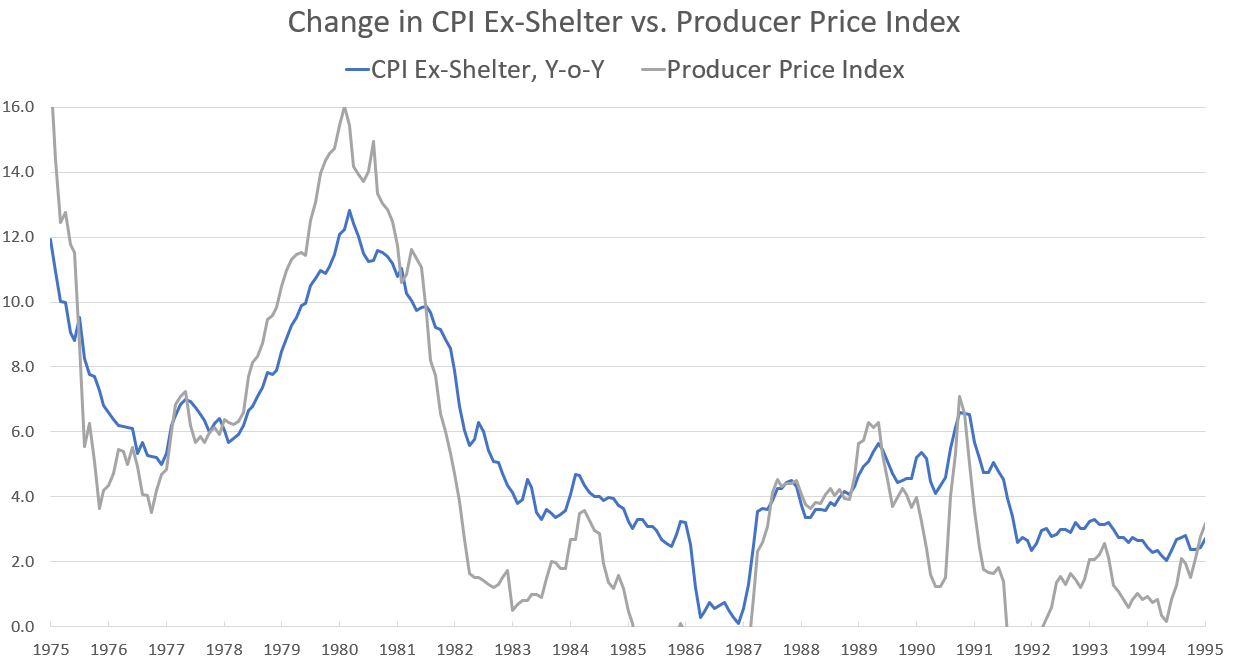
In this chart, it becomes pretty clear that the producer price index is more volatile, but it also tends to move sooner. The change in the producer price index was providing a clear signal about inflation.
Now you may be saying “well duh, but you can’t just change the cost of production”. That’s mostly true, but let’s go a bit deeper.
Oil Prices
Many of you will remember oil prices soaring around those times. We should add oil into the mix to see how that chart looks. However, because oil prices increased so dramatically, we need to use a second X-axis. The second axis lets us simply chart the price of crude oil in dollars per barrel:
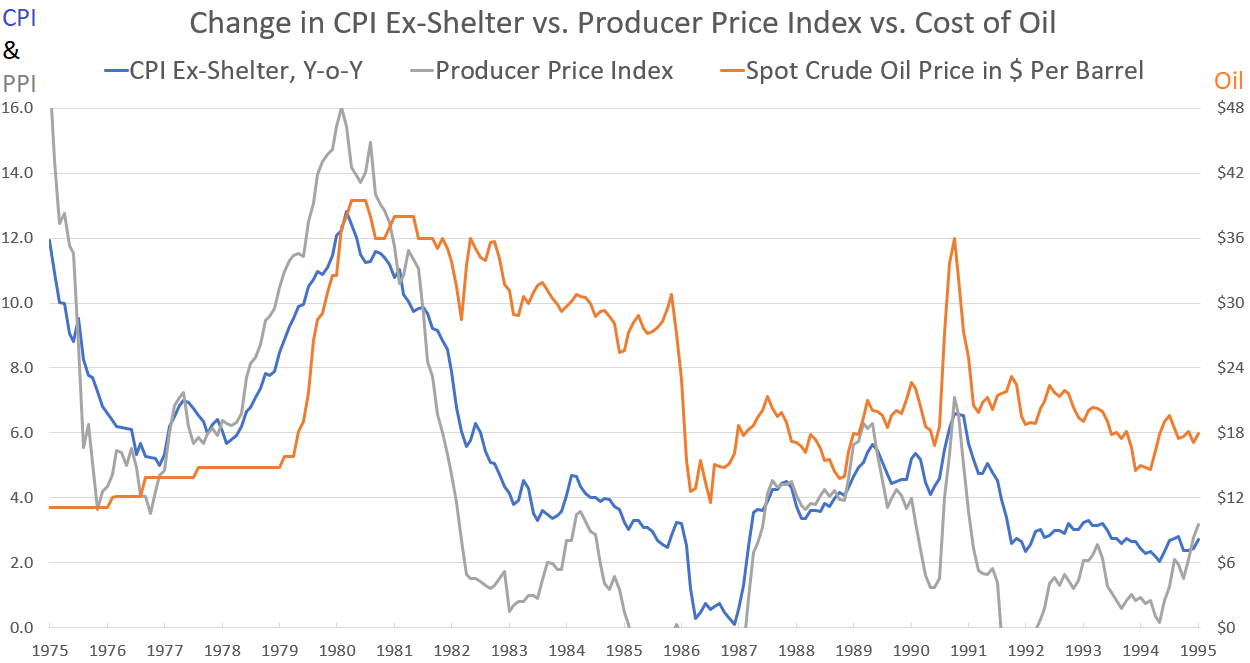
That’s a nice chart, but can I really say "oil" was a major factor causing changes when the price of oil was trailing the other indicators in 1979?
Absolutely. I’ve enhanced the chart with some commentary:
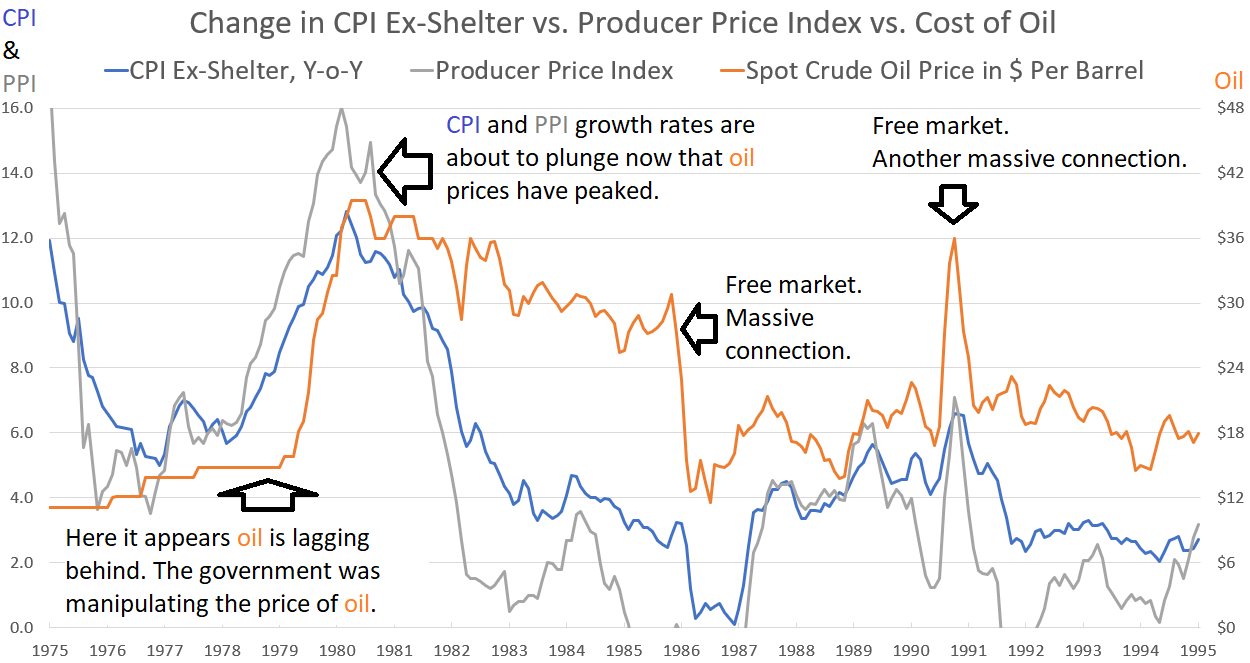
Starting in 1980, there is a massive connection between the cost of oil and the change in both CPI and PPI. The connection was hidden before June 1979 because of price controls. Quoting from University of Chicago:
Despite resistance from Congress and consumer groups, Carter began phasing out price controls on oil as soon as EPCA allowed (June of 1979).12 Carter also increased the allotted markup for refining in early 1980, increasing gasoline prices independent of the change in crude prices.
There you have it. The period where oil was not a useful predictor was when the price of oil was artificially controlled (prior to the summer of 1979) rather than determined by the free market. Oil is particularly important to this story because oil is involved in manufacturing and transporting goods.
Recap For Part 2
Americans have been told for decades that the cure for inflation is higher interest rates. The evidence demonstrates interest rates are a mediocre tool. Correlation is not causation. Oil prices were held artificially low in the 1970s, which obscured the relationship. After oil prices were set by the free market, they capped out and stabilized. When oil prices stabilized, the rate of inflation promptly fell.
By raising interest rates and creating a recession, the Federal Reserve took credit for solving inflation. However, the Federal Reserve wasn’t doing anything to reduce the costs of production. They do not deserve credit for solving inflation in the early 1980s.
I don’t send out many alerts from this service, so the easiest way to find them is to subscribe for free e-mail updates.
We don’t sell your e-mail address and you won’t get other e-mails. You just get an e-mail when I post a new article to this site. If you don’t like the e-mails, they all include a button to unsubscribe.
Member discussion