
Guide To Mortgage REITs: Changes in Book Value

Note: The index for our guides is here.
This guide was originally published on May 29, 2019.
On September 6, 2024, I added a new intro and a substantial addition to the end.
This guide is not mandatory reading to understand our service.
It is for investors who simply love to learn.
I considered writing a brand new guide but decided republishing with an update was better because:
- Providing the old guide verbatim (except for minor grammar fixes) creates more transparency.
- The concepts in this guide remain relevant.
- Starting with the old guide allows me to provide a few updates at the end.
- Despite the attraction of a “new” and “fresh” guide, readers would have to wait years to see if I was right.
- Because we’re dealing with investments and there is a factual record of how things played out after my comments, I believe an older guide (with updates) provides materially greater value.
Therefore, I decided to keep the old guide and repost it.
There are just a few other things I want readers to know before we get started:
- This guide primarily pertains to mortgage REITs that invest in “Agency MBS”. Currently, that means AGNC, NLY, DX, TWO, ARR, ORC, IVR, and CHMI.
- MBS = Mortgage-Backed Securities. Agency means the MBS is insured by one of the major agencies like Fannie / Freddie.
- The general concept of tightening and widening can be applied to other mortgage REITs but with substantial caveats.
- Statements about “my positions” in the section from 2019 only pertain to the time the article was written.
- All of the “updates” will be included at the end in a new section.
Finally, I must confess that there will be some grammatical errors. This piece is over 6,000 words and the grammar check in Google Docs is awful.
If you catch something and mention it in the comments, I’ll get it fixed. In hindsight, there are some sections that I would present much differently today than I did in 2019. The concepts remain accurate, but I talked about some of the hardest concepts with no warmup.
Let me know in the comments if you like the part from 2019 or the part from today better.
Now, we are traveling back in time to 2019.

Original Guide As Presented on May 29th, 2019
The residential mortgage REITs have been rocked since May 1st, 2019. It’s been brutal throughout the sector.
We’ve seen two events occurring at roughly the same time, each of which is pressuring share prices:
- Spread widening
- Dividend cut previews
Key Terms
Before getting into this article, we want to highlight a couple of terms. Specifically, you will see terms like “Widen” and “Tighten” used extensively. These terms refer to the difference between the expected yield on assets at recent prices and the cost to hedge those assets.
These metrics do not have to do with the shape of the yield curve. The shape of the yield curve can become “Flatter” or “Steeper”, but it does not “Widen” or “Tighten”. We will not be discussing the shape of the yield curve at any point in this piece as it has not changed substantially in the last couple of months.
What Does Spread Widening Do?
When spreads widen, book value declines. However, the mortgage REITs gain a much better environment for reinvesting their cash flows. If spreads are wide, a mortgage REIT can hedge most of their “Duration” risk.
Duration risk is the risk of interest rates moving higher or lower. A REIT can hedge against duration risk through a handful of derivatives. The most widely used is the “LIBOR Swap”.
If the spreads are wide, it means the REIT can enter into LIBOR swaps where they pay a fixed-rate that is materially lower than the expected yield on their assets.
During Q4 of 2018, we witnessed spread widening. It significantly reduced book value for many mortgage REITs.
During Q1 2019, we witnessed spread tightening. It brought book values higher for most mortgage REITs.
During Q2 2019 - so far, we witnessed spread widening again. Consequently, we expect book values to be lower.
How to Manage the Portfolio with Wide Spreads
If spreads are wide, mortgage REITs want to increase leverage and hedge out most of their duration risk. This way they are able to capture the wider spread. In this scenario, the major risk for the REIT is that spreads widen further. However, there are two risks:
- If spreads widen further, the REIT would lose book value faster.
- If rates become more volatile (moving EITHER up or down), the REIT would lose. This occurs because of “negative convexity”.
On the other hand, the REIT could “win” in two ways:
- Spreads tighten driving book value higher.
- Rates become less volatile, driving book value higher (and potential earnings).
In this “wide-spread” scenario, the REIT is earning most of their income from the spread between the cost of hedging and the yield available on assets. They are attempting to gain book value by spreads “tightening”.
A Treasury Example
If interest rates decline, the fair market value of a Treasury will increase. This follows the simple premise that when rates go down, bond prices go up.
Imagine that you own a Treasury paying 3% with 10 years left to maturity. If the market rate for the 10-year Treasury falls to 2%, the value of your investment increases by roughly 10%. The new buyer would pay $110.
The buyer would lose $10 in price over the life of the bond (get $100 back at maturity), but they would collect $30 in interest. That is a roughly fair deal compared to another investor buying a bond for $100 and collecting $20 in interest. Each investor comes away with a total of $120 across the span of 10 years.
Note: We are ignoring some of the more complex adjustments because they are not necessary to understand this concept.
If the 10-year Treasury rate fell to 1%, what would happen to your bond price? It would increase by another $10. The buyer would pay $120, lose $20 in value over the life of the bond, but earn $30 in interest. That is roughly fair when compared with a buyer who pays $100 for a bond and earns $10 in interest.
If interest rates increase from 1% back to 2%, the fair market value of your bond falls from $120 to $110.
Hopefully, this is a pretty simple concept. It lays the framework for negative convexity.
What is Negative Convexity?
Negative convexity refers to the idea that mortgage-backed securities perform best when volatility is low.
Much like Treasuries, a decline in interest rates would increase the value of MBS. However, it doesn’t increase it nearly as fast as it would for Treasuries. Why is that? Imagine that you have a mortgage at 5% and your bank calls you to offer you an opportunity to refinance at 3% at no cost to you. You don’t have to take out additional equity or pay any of their costs. That’s a very easy deal for you to take (if you don’t find better). This is one form of “prepayment”. When interest rates fall significantly, prepayments increase. The owner of the MBS doesn’t see the full gain in the value of their security because the homeowner may simply refinance into a better rate.
Now consider the opposite scenario. You have a mortgage at 5% and interest rates have increased to 7%. You are far less likely to pay off any additional principal on your mortgage. If your bank encourages you to refinance into a 7% loan, you would laugh at them. You might even choose to continue owning a house as a rental or to stay in it longer to maintain the benefits of having a mortgage at 5%.
In this scenario, the owner of the MBS is disadvantaged because you are paying the minimum required amount. If rates increased from 5% to 7%, they may wish you would simply pay off the mortgage so they could purchase new MBS at a higher rate.
Whether rates move higher or lower, the MBS won’t perform as well as a Treasury. That can be a bit of a difficulty. The mortgage REITs hedges will act like Treasuries, moving up or down in response to the rates. However, their assets won’t gain quite as much when rates are falling
When interest rates fall, the value of MBS increases. However, it doesn’t increase as rapidly as a bond.
The hedges a mortgage REIT uses will function more like a bond. Consequently, if the mortgage REIT were to hedge out all or almost all of their “duration” risk by carrying a large hedge portfolio (quite common today), their book value would fall if rates moved materially higher or lower. If rates increased significantly, the losses on their MBS would exceed the gain on hedges. If rates fell significantly, the losses on their hedges would exceed the gain on MBS.
When Is Negative Convexity Risk High?
When volatility is increasing or when leverage is high, the risk of negative convexity is more important. Currently, we’ve had quite a bit of volatility and leverage is fairly high for many mortgage REITs.
What Does Steepening Do?
When the yield curve is steeper, it increases the potential reward for taking on duration risk. When the curve is steep, the cost of borrowing money for short periods is low. That can be attractive for the current period, but it implies future periods will have higher rates.
Most investors believe that steepness is the major factor for mortgage REITs, but we find wideness to often be more important.
How to Manage the Portfolio with Steepness
If the yield curve is steep, the mortgage REIT can reduce their leverage some and reduce their hedges even further. The idea of lower leverage with a steep yield curve may sound insane, but it is quite viable.
If the REIT were to run high on leverage with a steep yield curve, they would need to hedge against more duration risk. Unless spreads are wide, that hedging would be expensive and would eat into their returns. With a steep yield curve, the REIT makes more of their income from duration risk. By having lower leverage, the negative convexity on assets becomes less important. The spread between MBS and hedging rates also becomes less important if the REIT has a steep curve available.
The Ideal Scenario
The ideal scenario would be one with wide spreads and a steep yield curve. In this scenario, the REIT could run high on leverage (to the wide spreads) and could take on some duration risk to further ramp up their expected returns.
Adjustable Rate Mortgages
We won’t be talking about ARMs (adjustable-rate mortgages) much. They have become far less common and generally don’t have a significant impact on the portfolios for most mortgage REITs. However, we will touch on them briefly. A mortgage REIT which owns ARMs wants to get their money invested while the curve is somewhat flat, then they want to see the curve steepen. Ideally, it would steepen with short-term rates not moving much but 7 to 10-year Treasury rates roaring higher. When your mortgage REIT holds ARMs, you simply want the curve to steepen since it reduces the incentive for prepayments.
A Flat Curve
We can all agree that the yield curve is “pretty flat”. The difference between a 2-year Treasury and a 10-year Treasury is about 15 basis points. That’s 0.15%, measured in absolute terms. For instance, the 2-year Treasury yield is 2.11% and the 10-year Treasury yield is 2.26%. This math is done by subtracting the 2-year Treasury rate from the 10-year Treasury rate.
If someone tells you the difference in the yields is (2.26% / 2.11%) -1 = 7.11%, they would also be “technically correct”, but it would be useless for analysis. This is not how spreads are measured.
To avoid any confusion we will regularly refer to these differences in basis points. A spread measured in basis points is always calculated by subtracting one number from the other.
Current Coupon
When we discuss the yield on MBS, we like to use “Current Coupon”. This term refers to a bond that is selling near face value. We want to evaluate the yield available on an MBS that sells for about $100.00 per $100.00 of face value. The buyer of the bond doesn’t know if the homeowner will refinance or not, but they won’t be recording a capital gain or loss when it happens. They will simply earn the rate of interest until the principal is paid off.
The Spreads
When we look at the spreads available on MBS (using current coupon) and the rate on new hedges, we find they look better than they have for quite a while. However, that isn’t the same as being great in a historical context.
By our estimates, the spread between the rate on a current coupon 30-year fixed-rate mortgage and a 7-year LIBOR swap is .97% (97 basis points). Using a 5-year LIBOR swap it is 1.01% (101 basis points).
We put together a quick table to demonstrate these spreads over the last few years:
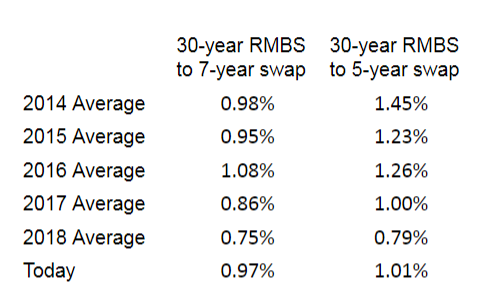
Note: The average is computed by using the spreads at the start of the year and at the end of each quarter. IE: 1/1/2018, 3/31/2018, 6/30/2018, 9/30/2018, and 12/31/2018.
Alternatively, we also built a chart to demonstrate:
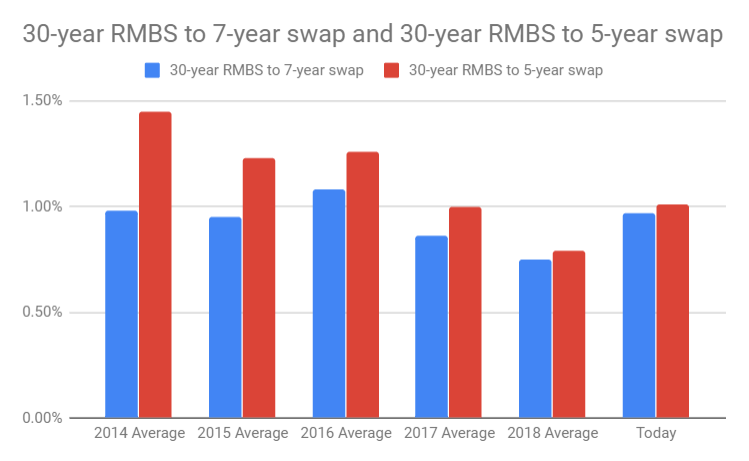
If we compare the spreads relative to 2018, they are much better. If we compare them to 2017, it is roughly a draw. However, 2017 was a bit of an interesting year. The spreads were much wider in the first half of the year and thinner in the second half.
However, we also have to point out that spreads aren’t particularly good compared to 2014. If we are comparing to 2014, spreads look poor. Compared to the averages for 2015 and 2016, the values still look mediocre. However, we don’t expect spreads to return to those levels. If we saw spreads that were that wide, we would feel much more comfortable with the idea of holding shares for a longer period. Instead, we treat the shares as trading instruments and look to capitalize on changes in the price-to-book ratio.
What About Dividends?
Remember why we trade in these instruments. The market is inefficient. Dividends do matter as a component of total return, but investors place too much emphasis on the dividend relative to the book value. When you learn how net interest spreads work and how book value works, it leads to a very different view on dividend policy.
Annaly’s Book Value Performance
It is easiest to demonstrate these concepts using a mortgage REIT. Annaly Capital Management (NLY) is easily the most followed mortgage REIT and they provide a handful of useful charts. We will plan to use them for charts. We built the following table to show NLY’s ending BV per share:

You can spot changes in BV through that chart, but it could be easier. If we want to target the drops in BV, we can use the following chart:

It becomes clear the vast majority of the book value losses came in three specific quarters. If we removed those 3 quarters, BV would’ve been roughly flat. We can also see that twice the plunge was heavily impacted by rates roaring higher. In Q4 2018 we saw rates decline, but a widening of spreads. As we expected, book value bounced back during Q1 2019.
So far in Q2 of 2019, we are seeing spreads widen back out and erasing the gains to book value seen in Q1 2019. However, we believe this is setting the stage for better months to come. When we see the widest spreads (using our methods) since the end of Q2 2017, that bodes well for book value performance starting from today. Book value for Q2 2019 is already damaged, but the share price has plunged. We see the damage already being priced in.
Note: In our experience, it makes sense to assume that spreads will trade within a range. The boundaries aren’t perfectly defined, but a large widening of spreads suggests that a shrinking of spreads is more likely than an increase. This is simple “reversion to the mean”.
Dividend Change
Annaly Capital Management reported its earnings on 5/1/2019 after the market closed. During that earnings release, they indicated that adividend cut was planned for Q2 2019. Since then, shares plunged:

Falling by 10% during a single month in which there is no dividend (to offset 3% in price decline) is a substantial fall.
We believe the movement in NLY’s price is heavily influenced by that announcement. Book value has declined also, but the price-to-book ratio dropped significantly because the price dropped so much more.
It is worth highlighting that the price might continue to drop after the dividend cut is announced, or it may already have dropped enough. Who would want to jump into shares before the cut gets more publicity? That’s a big incentive for the big buyers to stay away. The recent fall could be plenty to scare off several of the retail investors as well.
Sector Momentum
Momentum in a sector can be scary. There are few things that give us as much pause as seeing the largest companies in the sector hitting fresh 52-week lows. That won’t stop us from going in, but it does encourage us to be more careful. We placed a few other trades in mortgage REITs earlier this year, but there was less negative momentum for peers. We don’t mind grabbing a share that is plunging, but we are wary if the peers are also plunging.
Many investors only look at one or two stocks at a time. We’re evaluating the entire sector. That’s part of being able to grab the falling knives.

Outlook Changing
Based on the widening of spreads relative to the levels seen over the last 2 years, we’re comfortable with slightly higher price-to-book ratios on average. The decline in BV lowers our price target, but a slight increase in target ratios is partially offsetting it. Our outlook is shown below.

Which REITs are Ripe For Trading?
We want to use sector momentum to our advantage. We want to catch REITs that have recently underperformed through no fault of their own. That eliminates Arlington Asset Investment Corp. (AI). AI has been the worst performer, but it was due to massive book value losses, issuing dilutive equity, and we’re not particularly fond of their issuing preferred shares at an 8.25% coupon rate. Those moves all stink of terrible management. While most price-to-book targets are increased, we’re lowering the targets on AI to demand a larger discount on the stock.
The following chart highlights NLY, Two Harbors (TWO), and ARMOUR Residential REIT (ARR) as 3 REITs which appear to be hitting attractive valuations.

Note: We arranged the order of the stocks on the right to match the order of the lines as they enter the chart. That should make it a little quicker to spot the relevant line.
Based on that chart, MFA Financial (MFA) would be pretty dangerous. They did quite well the last two quarters and we still like their fundamentals, but we are concerned by their momentum relative to the sector. They went from a cheaper than average price-to-book ratio to a far above average ratio. The only two residential mortgage REITs with higher price-to-book ratios are Chimera (CIM) and New York Mortgage Trust (NYMT), which have regularly been the two REITs with the highest price-to-book ratios.
We also have Dynex Capital (DX) and Anworth (ANH) within our target buying ranges. However, we’re prioritizing the other 3 on the basis of recent relative performance. DX and ANH don’t have the “benefit” of recently underperforming their peers by a large margin. That separates them from NLY, TWO, and ARR as short-term trading opportunities.
Price to Book and Dividend Yield
We find the market considers both factors in pricing shares. We usually expect NLY to trade between 80% of BV (extreme weakness) and 110% of BV (euphoria). We also expect shares to usually carry a yield around 10% to 12% as that is the level that seems to bring in more retail support. A 10% yield would put shares at $10. A 12% yield would hit at $8.33.
These expected dividend yield levels match up with a more reasonable (tighter) range of price-to-book estimates. Over the last couple of years, the price-to-book ratio has generally been towards the upper end of the range we would expect.
Upcoming Presentations
Spread widening may be occurring at just the right time. Several mortgage REITs are going to be presenting at the Keefe, Bruyette & Woods Real Estate Finance and Asset Management Conference. DX presents on 5/30/2019.
This will be an opportunity for executives to make the case that wider spreads are better for long-term income generation. If analysts are swayed, it could benefit the sector.
We see this as a fairly minor factor, but it is a positive factor when most investors are still focused on the upcoming dividend cut for NLY.
Future Cuts
We would like to see even wider spreads to support double-digit dividend levels, but we doubt NLY will cut again within the next 24 months absent a complete meltdown in markets.
Kevin Keyes
NLY’s CEO (Kevin Keyes) has a knack for running circles around analysts and investors. He can make anything short of a disaster sound positive. We expect more positive commentary in about 2 months when the Q2 2019 earnings release hits. Don’t ask anyone to spin a 16% dividend cut into a positive light. That’s beyond the powers of any executive.
The Sector We Avoided
We avoided mortgage REITs so much over the last 2 years that we changed our service from “The Mortgage REIT Forum” to “The REIT Forum”. We expanded coverage on preferred shares and equity REITs. We believed the residential mortgage REITs were mostly toxic. We were right. For the last 2 years, most investors ended up eating negative total returns while our preferred shares continued to pay out dividends and increase in value.
This is the plunge the sector needed. We can’t call precisely when it will end, but this fall reset valuations to a much more reasonable level for entering trades again.
Conclusion
The negative sector momentum is enough to be a significant concern. So far Q2 2019 has been terrible for book values due to spread widening and the announcement of dividend cuts has put the sector on edge. However, we doubt spreads will continue to spread rapidly from here.
Recent underperformance by NLY, ARR, and TWO should put them at the top of investor’s lists for trading positions.
For buy-and-hold investors, we still recommend building the portfolio using preferred shares from mortgage REITs. We don’t have many sales there currently, but the common shares of the mortgage REITs are still built primarily for trading. In the case of ARR, we are especially focused on using it for trading opportunities.
Note: We are long DX and ARR. We will look to add shares of NLY and TWO. NLY closed at $8.95 and TWO closed at $12.62. Those valuations sound fine to us. Currently, we are projecting that to be .94 price-to-book for NLY and a .91 price-to-book for TWO. However, upon updating for movements in rates over the last 2 days, that may be .95 for NLY and .92 for TWO. We consider these high-risk trading opportunities. We accept that prices might move against us, but believe the odds are in our favor following the drop in share prices.
Update to Present Day
Prepared September 6th, 2024.
You’re entering the update!

There were quite a few claims there. Keep in mind that the original guide was prepared before the first cases of Covid 19.
Given that huge black swan event, it should be particularly interesting to see how we did.
Return on Positions
I referenced the following positions:
- Was long DX.
- Was long ARR.
- Was looking to add shares of NLY and TWO.
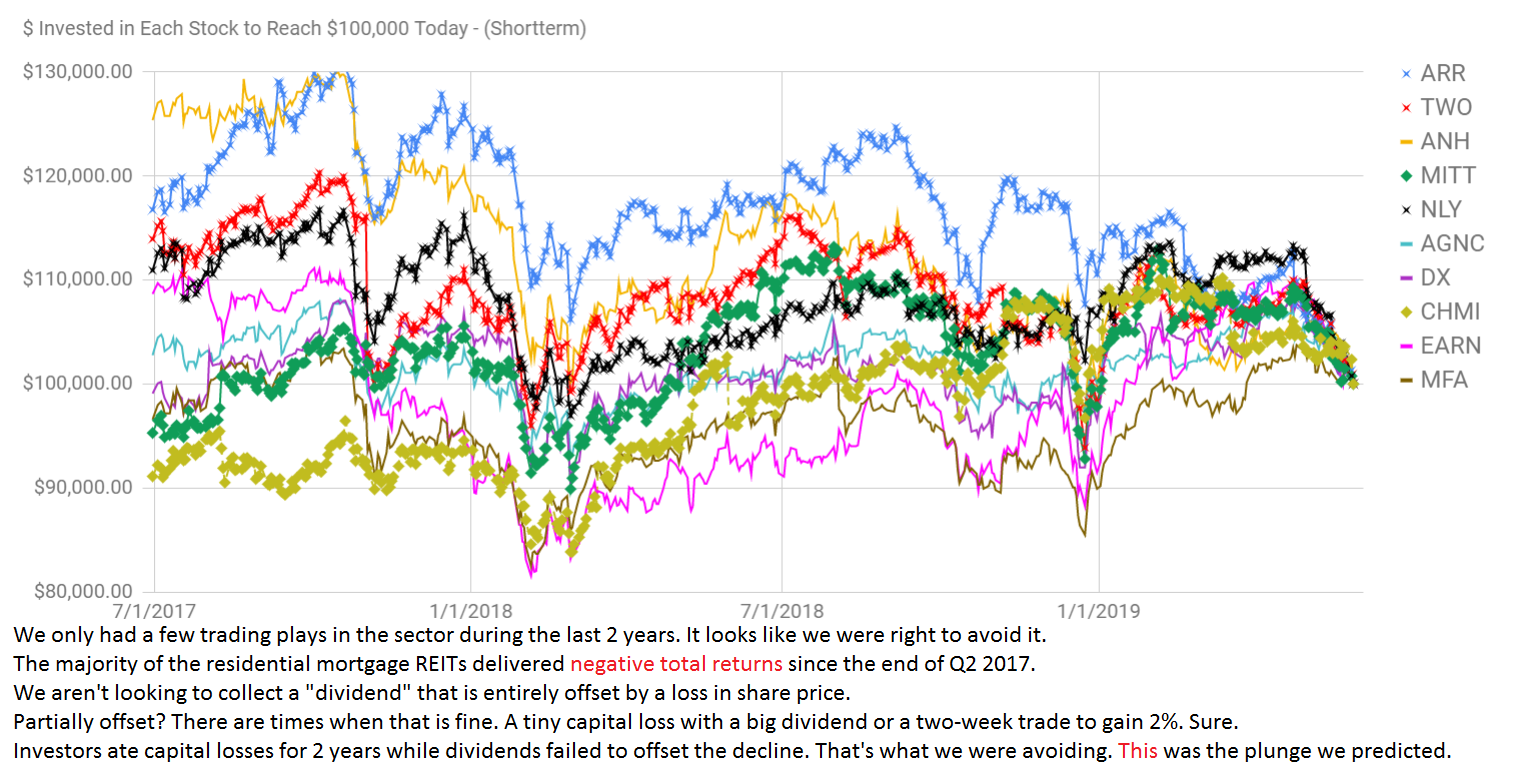
The chart below shows the performance of each position.

Note: While most of the returns on these positions were fairly small, most were extremely short-term trades. The annualized performance turned out well for most of them. We are usually invested for longer than a month or two, but at that time we were running more very short-term trades.
The shares I owned at the time of the update are shown in yellow.
The shares I foreshadowed are shown in green.
Subsequent additions to those positions are shown in pink.
Most of those trades were short-term. We were in and out pretty quick.
I wouldn’t include most of those trades in a highlight reel, but it is good to share them. We were not holding those positions going into the pandemic.
If we had been, it would’ve been ugly. Since we weren’t handcuffed to the positions, we were able to keep moving and trading around the swing in valuation.
The majority of our trades are longer than that. We aren’t packed full of trades that last less than 40 days. It just happened with this specific batch.
Note: I’ll have to end this article with a disclosure of our current positions as of September 6th, 2024.
Annaly Capital Management
I included a chart for Annaly Capital Management in the initial article. Annaly trades right at $20.12 on the afternoon of September 6th, 2024. However, shares had a 1 for 4 reverse stock split in September 2022. Due to the reverse split, the current price of $20.12 would be like a price of $5.03 without the reverse split.
This chart for Annaly Capital Management applies the reverse split across the entire timeline. So anythin before the reverse split has been multiplied by 4:

You may notice that 2022 was awful. We’ll get into that with much greater detail in the section using AGNC.
I’m going to add another chart for NLY near the end of this article to build on the lessons we are about to cover.
How Spreads Changed
Spreads between MBS and Treasuries surged higher during the pandemic. The mortgage REITs were faced with several challenges during Q1 2020.
- When interest rates move dramatically, that’s generally bad for mortgage REITs. Even if rates are plunging, that’s still bad. Mortgage REITs want consistency.
- The widening in spreads caused book values to plunge even further.
In short, Q1 2020 was a disaster. It wasn’t as bad as the change in share prices, but it was still a horrible quarter.
Spreads tightened during Q2 2020 and drove book value much higher.
By the end of Q4 2020, they were quite tight.
They remained tight through about the end of 2021.
Then we saw rates surging higher and spreads widening at the same time.
By the end of Q3 2022, spreads were exceptionally wide.
They would tighten a bit in Q4 2022, but generally remained wide over the next several quarters.
To demonstrate how this impacted book value, I have a chart of AGNC’s book value over time.
It also includes the share price, but that’s just because I’m using a tool I already have built.
Enjoy the chart:
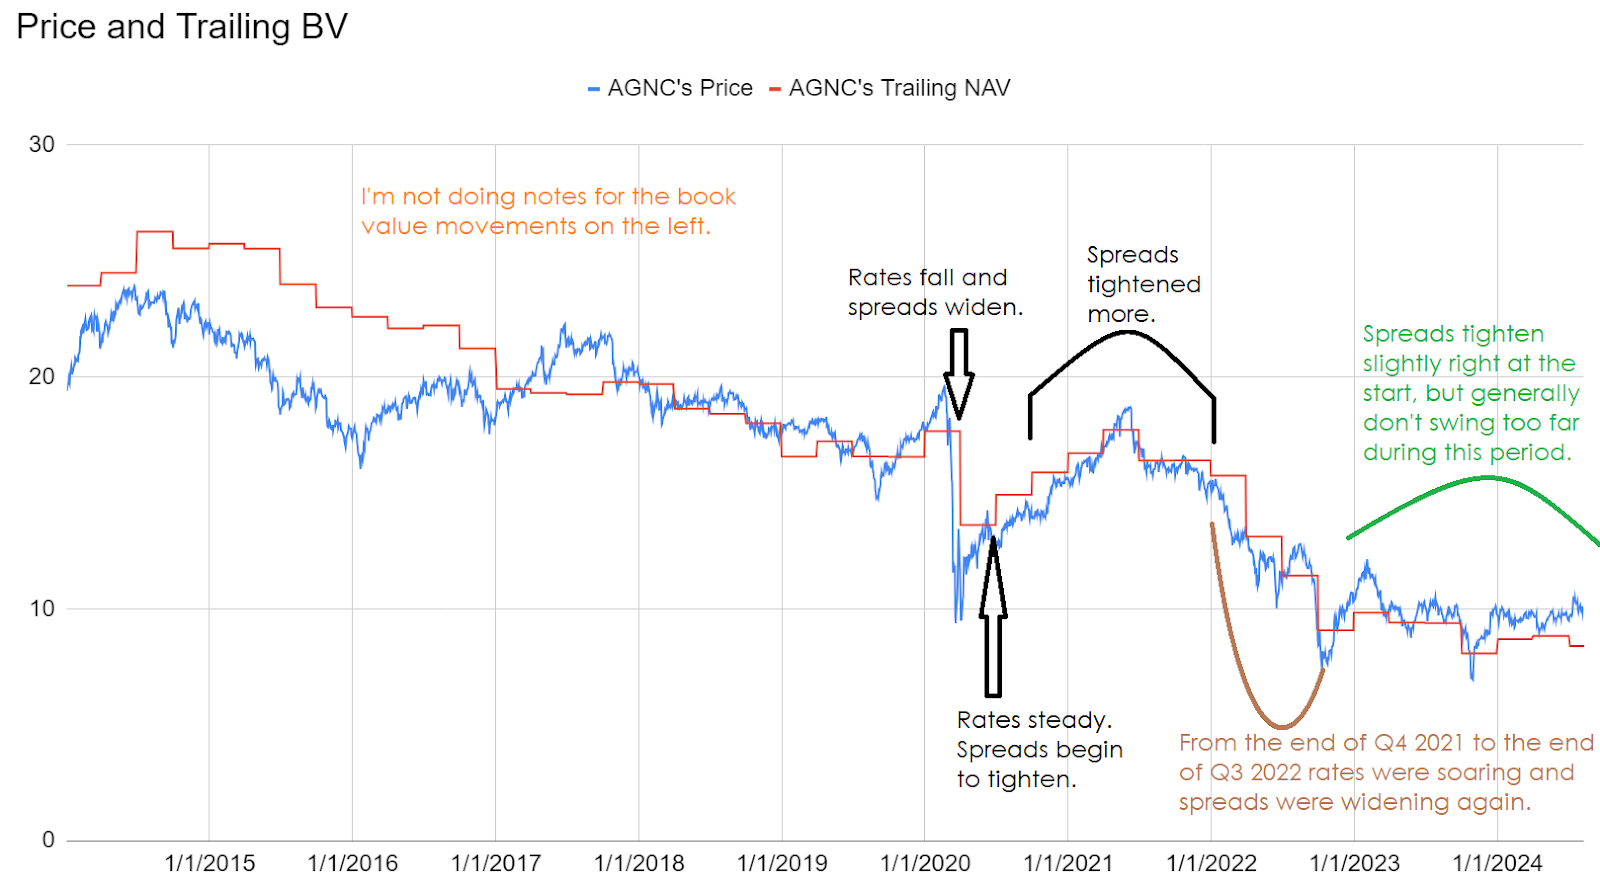
As you can see, during periods of substantial spread widening, we see a decline in book value.
The benefit of the wider spreads available today is that mortgage REITs can earn a better return on their invested capital.
Return on Invested Capital
With wider spreads, mortgage REITs can hedge more against duration risk and expect to generate more income than they could previously under tight spreads.
However, they absolutely cannot hedge completely and just lock in huge profits. That’s not how anything works.
Even if a mortgage REIT hedges against modest movements in interest rates, they will still be exposed to damage from larger swings.
Unfortunately, the way hedging works, it’s possible for a mortgage REIT’s performance to appear artificially strong or artificially weak.
Is that really unfortunate? I’m sure it is. The confusion around mortgage REITs can drive absurd price movements. Absurd price movements make trading more profitable. So perhaps “unfortunate” is the wrong wording here.
What is unfortunate is that several smart people could have different definitions for “Return on Invested Capital”.
Therefore, I’ll need to use different terminology.
Net Interest Spread
The net interest spread is the difference between the rate earned on assets and the cost of borrowing.
Many investors are confused by this topic.
When the mortgage REIT reports these values:
- Interest income is influenced by the historical amortized cost of the assets.
- Interest expense is influenced by the hedges that are in place.
Consequently, neither of those metrics represents current market rates.
Congratulations, the reported net interest spread is not necessarily indicative of the current spreads.
So when I’m talking about the spreads, I’m using market rates.
In short, if you can earn 6% on an MBS and hedge it at 4.5%, then the spread at market rates is about 1.5%.
Apply 6 turns of leverage (that’s being conservative) and you would be at 9%.
Some of the assets are financed with equity though, so there’s no debt cost.
That gives you 6% from the assets financed on equity and 9% from the leveraged net interest spread.
Now the REIT has 15%. They will pay management first. That’s probably going to be between 1% and 4%.
We are left with 11% to 14%. That’s great.
Except, we need to remember that hedges will be far from perfect. Even if the mortgage REIT hedges heavily, a big movement in rates would still hurt them.
Therefore, 11% to 14% is the optimistic scenario.
When Net Interest Spreads Were Very Tight
The tightest we’ve seen net interest spreads was somewhere in the 0.4% to .95% range. That’s a material difference. It really depended on how the mortgage REIT was hedging.
At that time the yield on new assets was well under 2%. Consequently, the leveraged spreads would’ve been around 0.4% x 6 = 2.4% to 0.95% x 6 = 5.75%.
Note: If anyone wants to yell “don’t hedge the stupid way”, I would like to clarify that it isn’t that simple. I was referencing the amount of duration risk the mortgage REITs would choose to hedge. The more they hedged, the lower the net interest spread would be.
I’ll round the yield on new assets at that point (around late 2020) up to 1.5%.
Remember, we get to finance part of the assets with equity. So we add 1.5% to the leveraged spread of 2.4% to 5.75% and we get 3.9% to 7.25%.
You won’t see that in the presentations because the mortgage REITs were not resetting all of their assets and liabilities to the market rate.
Now, would you rather have the mortgage REIT hedging extremely hard and earning 3.9% or hedging lightly and earning 7.25%?
It really depends on the exact timing. There were parts of 2021 where low hedges were great. But by the end of 2021, the ideal solution would’ve been largely sitting in cash or owning some derivatives designed to increase in value when rates rise.
Remember that in 2022 the agency mortgage REITs got pulverized. Even if they had hedged heavily, they just couldn’t be prepared for the massive spike in rates.
Being heavily hedged was vastly better than being lightly hedged, but it was a brutal period.
A Popular Inaccurate Theory
Some investors believe AGNC would see book value rip higher if interest rates fall. They are horribly wrong.
AGNC’s management provided the following slide, which I’ve enhanced:

That won’t make sense for many readers though, so I want to supplement it with another slide:
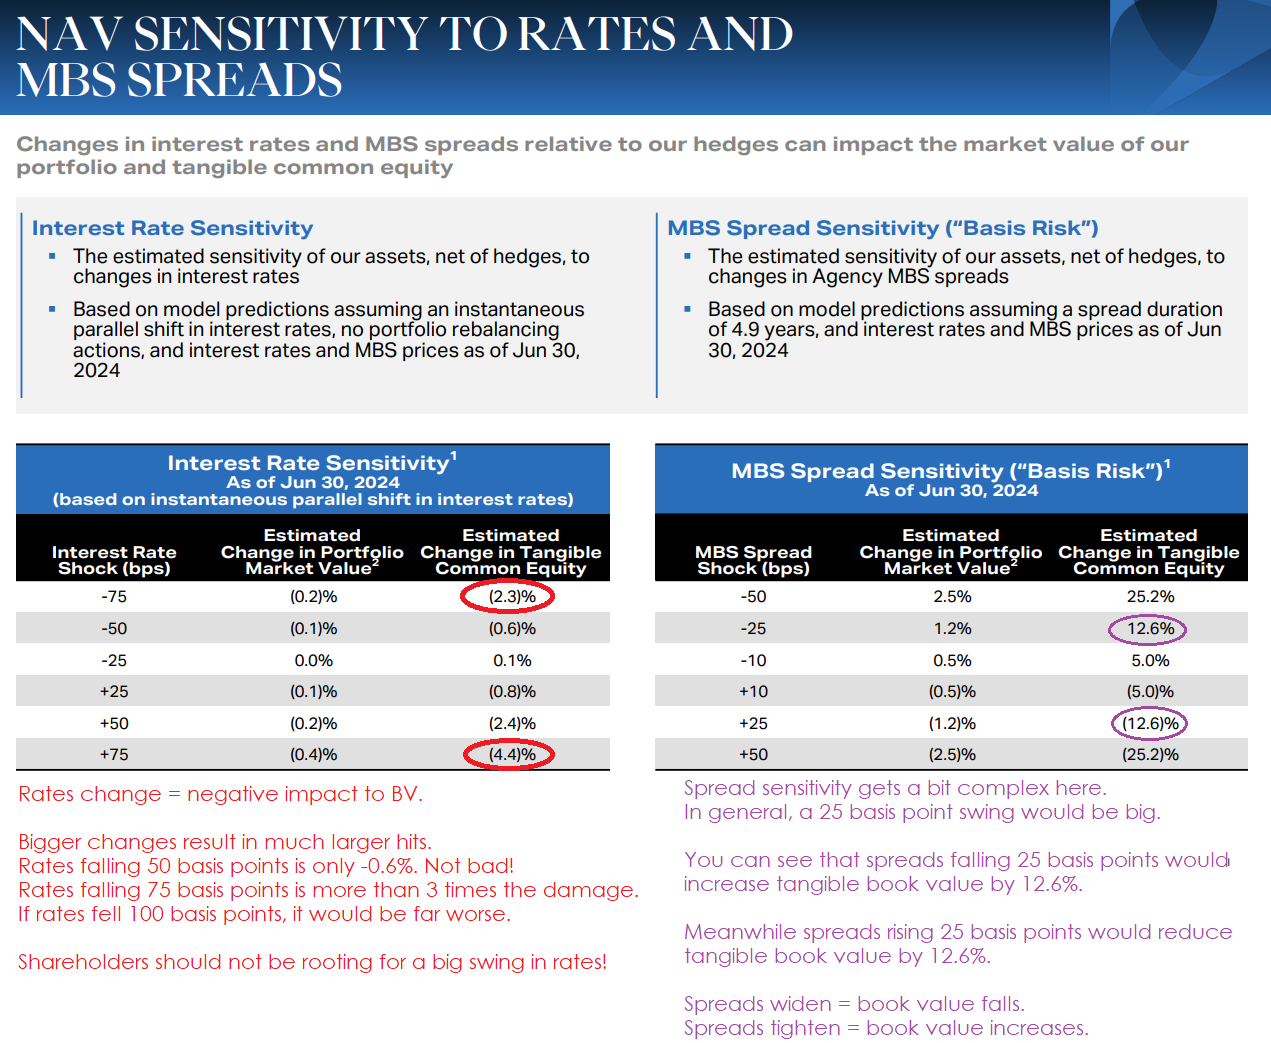
Despite spreads having a material impact on book value, valuation should still focus on price-to-book ratios.
When spreads are wide, mortgage REITs can earn more.
You might assume that investors would see that and bid higher price-to-book ratios.
If only markets were able to follow such logic.
Wide spreads between MBS and Treasury or LIBOR rates have not historically indicated a higher price-to-book ratio.
I know that sounds absurd, but that’s how it worked.
Often high price-to-book ratios occurred while spreads were quite thin.
- AGNC traded at a material premium to book value during Q2 2021. Spreads were weak.
Meanwhile, we’ve often seen low price-to-book ratios while spreads were wide.
- Since late 2020, one of the largest discounts to book we saw for AGNC was in October of 2022. Spreads were exceptionally wide. That’s also why AGNC reported a huge book value loss (as we predicted) in their Q3 2022 results. So one of the biggest discounts to book occurred when spreads were wide.
Yes, this is the market getting it precisely wrong.
Best vs. Worst Scenarios
The ideal situation for a buyer is to enter at a low-price-to-book ratio while spreads are wide.
When spreads are already wide, they have more room to tighten (improving book value) than widen (decreasing book value). It tilts the odds a bit in the shareholder’s favor.
However, having an unusually large discount to book value generally improves the odds much more.
This somewhat happened in October 2022. The discount to book wasn’t huge, but the spreads were wide. Some peers had much better discounts to book. We haven’t seen an exceptionally large discount to book value for AGNC since 2020. Consequently, it is harder to use them for this example. Regardless, you could see in the chart that buyers in October 2022 did much better than others. We had a bearish rating on AGNC going into that period, then upgraded them after the price plunged.
The worst situation, excluding some outliers, is when shares have a high-price-to-book ratio and the spreads are tight.
Those outliers involve a REIT with exceptionally weak management or assets that aren’t really worth book value. Those are unique situations. They are important, but they are outside the scope of this discussion.
Looking back at the chart for AGNC, you’ll notice that in Q2 2021 AGNC achieved a premium to book value while spreads were already quite tight. It was a horrible risk/reward profile. It played out exactly as you might have expected. Investors ate a substantial loss. The magnitude of the loss was compounded by the large increase in interest rates.
AGNC’s Price-to-Book
Investors hoping for rates to plunge shouldn’t be so excited about a REIT trading at a substantial premium to our estimate for current tangible book value.
We will have new book value estimates after this weekend, but I’d like to get the guide finished.
Using our estimates from 8/30/2024 (one week ago), AGNC’s book value was probably about $8.75.
Today the share price is $10.21. Therefore, the price-to-NAV (or price-to-book) is about 1.17x.
That’s high. Painfully high.
There are peers (other agency mortgage REITs) trading at much lower multiples, but the agency mortgage REITs are generally not trading at large discounts. The price-to-book ratios range from about .83 to 1.17 for agency mortgage REITs using our latest book value estimates and today’s share price.
One Strange Note
Normally MBS with higher coupon rates are more expensive than those with lower coupons.
Recently we’ve seen the 15-year fixed-rate agency MBS with a 4.5 coupon trading at a lower price than the same security with a 4.0 coupon.
This is from August 8th, 2024:

Source: MBS Live
Should that happen? No.
Does it happen? Yes, that’s how I got the screenshot.
It’s very rare though.
The Chart for Annaly Capital Management
I promised one more chart to build on the lessons contained here.
This is that chart.
Yes, it’s really tall.
Yes, it is two charts on top of each other.
Can we move past that?
Use the brown boxes to compare the same periods in each chart and you’ll notice that price-to-book does an awfully good job of depicting when the price is too high. We don’t see lots of huge gains to book value, so price-to-book is a great way to see when the price is probably near a top. Since you don’t want to buy near a top, you don’t want to buy when price-to-book is high. The simplest technique to becoming better than average is simply not to buy stocks that are obviously near a top. Using this chart, I think it’s pretty fair to refer those periods as being “obvious”.

Conclusion
Understanding the difference in these terms can help investors understand how the mortgage REITs actually work.
Did you need to understand all of these things? No. But hopefully, you do now.
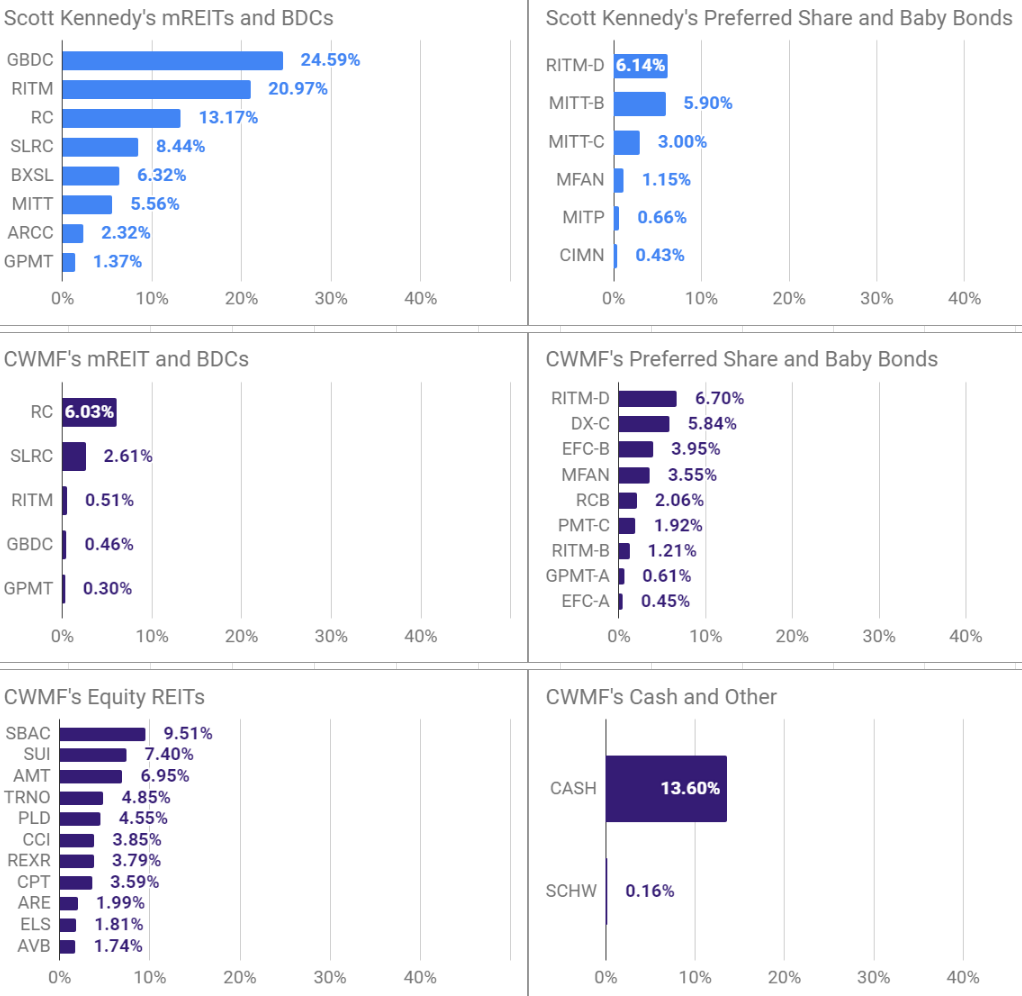
Disclosures:
Michael VanLoon (Colorado Wealth Management Fund) and Scott Kennedy have the following positions as of the date of publication (09/06/2024):
Thank you for reading.
If you're not signed up yet, you'll have an opportunity to sign up below. You can get alerts when we publish new free articles.
Member discussion