
Exposing Our Mortgage REIT Record
I’m snarky. There’s no denying it. I don’t care to censor myself.
If I don’t speak clearly, people may not understand me. A failure to speak clearly could cause my followers to miss out on attractive investments. That would be bad. If I hurt a few feelings along the way, that’s an acceptable cost to achieve clarity.
No one has ever told me they return to read my articles because I’m just so gosh darn cuddly.
Disclosure: Seeking Alpha sometimes disagrees because feelings matter. Apparently, being wrong about how to calculate EBITDA, leverage, risk, cash flow, net asset value, and AFFO is acceptable (based on what I see published), but the line is drawn at being curt.
Readers come back because:
1. I speak clearly.
2. I have a long record of getting calls right.
Those two things make a great pair. Like mac and cheese, wine and cheese, or meat and cheese. Okay, I like cheese. Deal with it. This is The REIT Forum. Not The Diet Forum.

Eat Your Own Cooking
Speaking clearly and a strong record pair well because investors can verify our record much faster.
That brings up a few questions:
- How can you illustrate which ratings count for more than other ratings?
- How can you ensure that you don’t just forget about a rating?
Easy. Just buy the stuff you’re telling readers to buy!
Within a real portfolio, each position has a weight. It’s easy to calculate by looking at the total value of the portfolio and the total value of the position. Bigger positions have a bigger impact on returns, so they matter more.
Further, dumb analysts with bad ratings lose money. Karma.
Three Kinds of Positions
There are only three kinds of positions:
- Open Positions
- Closed Positions
- Imaginary Positions – We don’t have these.
The third one shouldn’t be a category, but for most analysts, their entire “Portfolio” is imaginary positions. That’s trash.
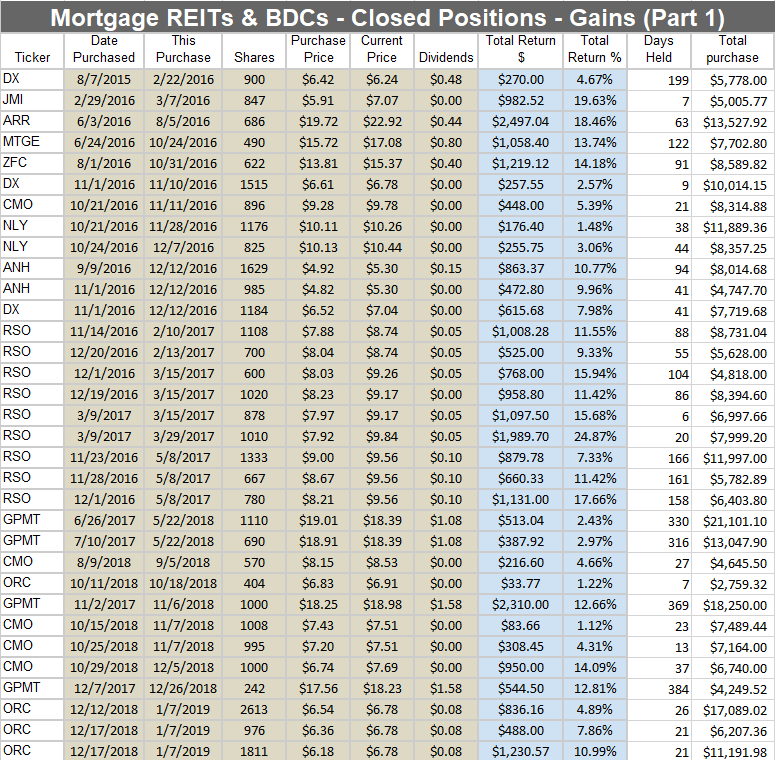
Our Gains on Closed Position
We’re moving on to the trades where we made money. This one will require more images because there are more positions to list. While we lost money on 20 transactions, we made money on 99 transactions. As you might guess, that takes up more rows. Sorry about the extra rows. Not actually sorry. I love my gains.
The first 33:
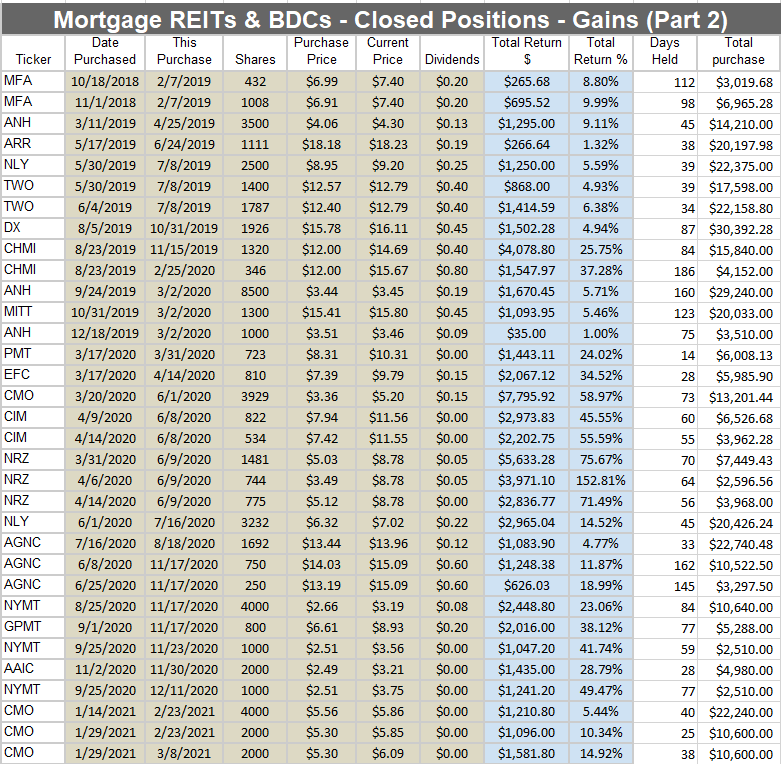
The second 33:
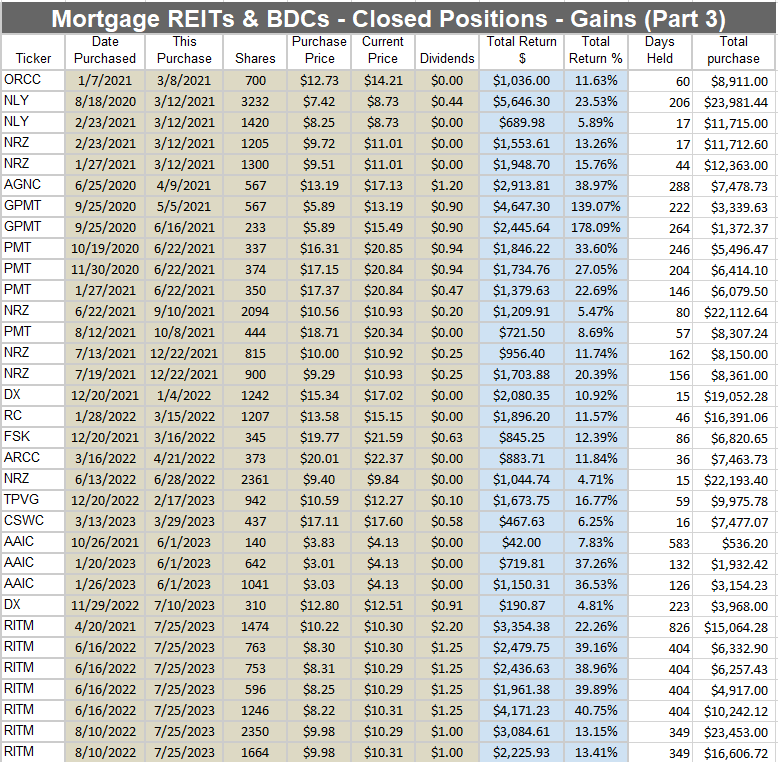
The third 33:
How did we do with those positions?
- The weighted average return was 15.01%.
- The weighted average holding period was 120.8 days.
- The total invested was $999,727.49.
- The total return was $150,087.77.
That’s a great annualized rate of return.
Our Losses on Closed Position
What is a closed position? Any position we sold is a closed position.
I’m going to start by sharing our losses on mortgage REITs and BDCs.
Sometimes, I buy shares on multiple occasions. Therefore, the weighted average price may be different than one individual purchase. To keep it simple, I’m just listing every single time I executed a trade. I may have done very well on a share across multiple trades, but if even one of the purchases lost money, you’ll see it here.
You can easily determine whether I made money or lost money on a trade. If you can’t tell whether I made money or not, one of two things happened:
- You flunked out of elementary school many years ago (or are too young for this article).
- I failed to properly convey the numbers. This would mean I was either intentionally vague or simply incompetent.
In practice, I find most analysts choose “intentionally vague”. It isn’t a problem with the reader. Analysts simply do not want to share that data.
I will share the data.
I lost money on 20 transactions. These are the transactions:
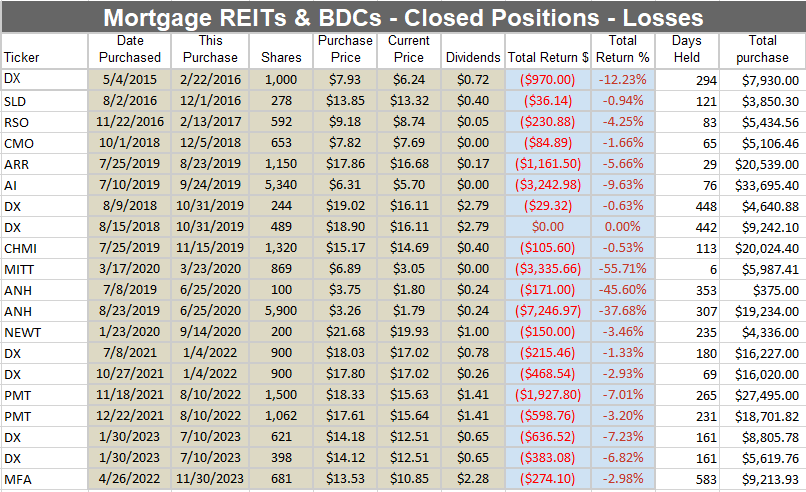
I added the two columns on the right for this article.
The total purchase price allows us to adjust for different weights.
For instance, I lost 45.6% on one trade in ANH. However, I spent $375 to buy the position. Lost $171. Oh well. Not a big deal.
The trade where I lost 37.68% in ANH mattered far more because it was a bigger position. That trade cost me $7,246.97. That was painful.
- The weighted average return on these positions was negative 8.77%.
- The weighted average duration was 188 days.
- The total invested was $242,478.80.
- The total return was a loss of $21,269.20.
Lumping Them Together
If you wanted to lump the gains and losses together:
- The weighted average return was 10.37%.
- The weighted average holding period was 133.9 days.
- The total invested was $1,242,206.29.
- The total return was $$128,818.57.
- The annualized rate of return was 29.8%.
Sector Performance
For comparison, the mortgage REIT sector was pretty weak. One of the mortgage REIT ETFs (MORT) delivered a total return of 15.06% since 12/31/2015.
That means the sector ETF delivered an annualized return of 1.77% since the end of 2015.
- In 2016, the sector ETF’s return was 21.67%.
- In 2017, the sector ETF’s return was 18.87%.
- The compounded return was 44.62% across those two years.
- Starting at the end of 2017 through late December 2023, total returns for the ETF were negative.
Negative returns since the end of 2017 reduced the return from 44.62% to only 15.06%.
But most of our investments were made after the end of 2017. That’s just because our portfolio was much bigger. When we have more money, we have bigger positions. Pretty obvious.
Since my portfolio was much smaller in 2015 and 2016 (two of the best years for the sector), the weights (in this weighted-average method) assigned to our trades in those years are much lower.
We had to earn the majority of our returns for the sector across a 6-year period where the cumulative return for the sector was between negative 20% and negative 21%.
Maybe we should have been shorting positions also? Regardless, we got here following a “long-only” strategy. I do bring out the occasional pair trade idea for members, though.
What About Open Positions
We have some open positions also.
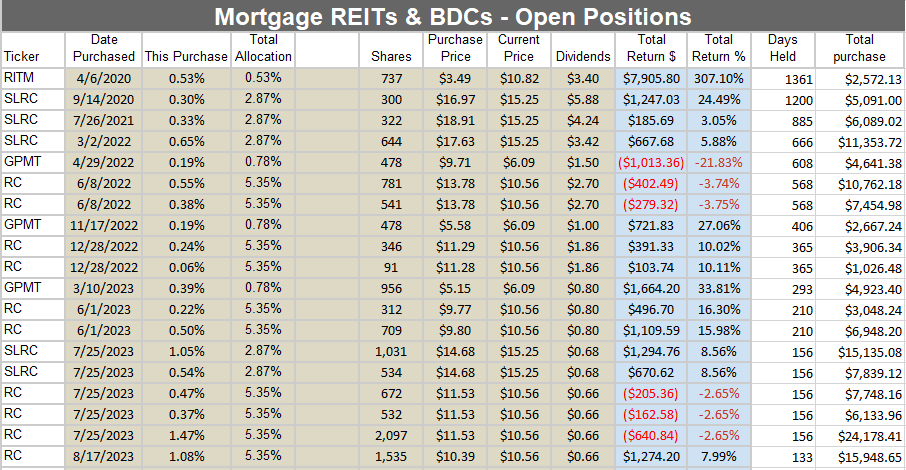
The majority of these positions are in unrealized gains, but there are also some unrealized losses. I’ve left some of these positions open for a long time. Therefore, they would pull the weighted average duration up.
Not Here to Brag
I’m just here to state the facts. Those facts happen to look good when measured objectively (using numbers).
For instance, (AGNC) is one of the biggest mortgage REITs.
I recently published some negative commentary on AGNC.
Let’s have a look at my rating history from Seeking Alpha, combined with some commentary from Scott about when he closed his positions:
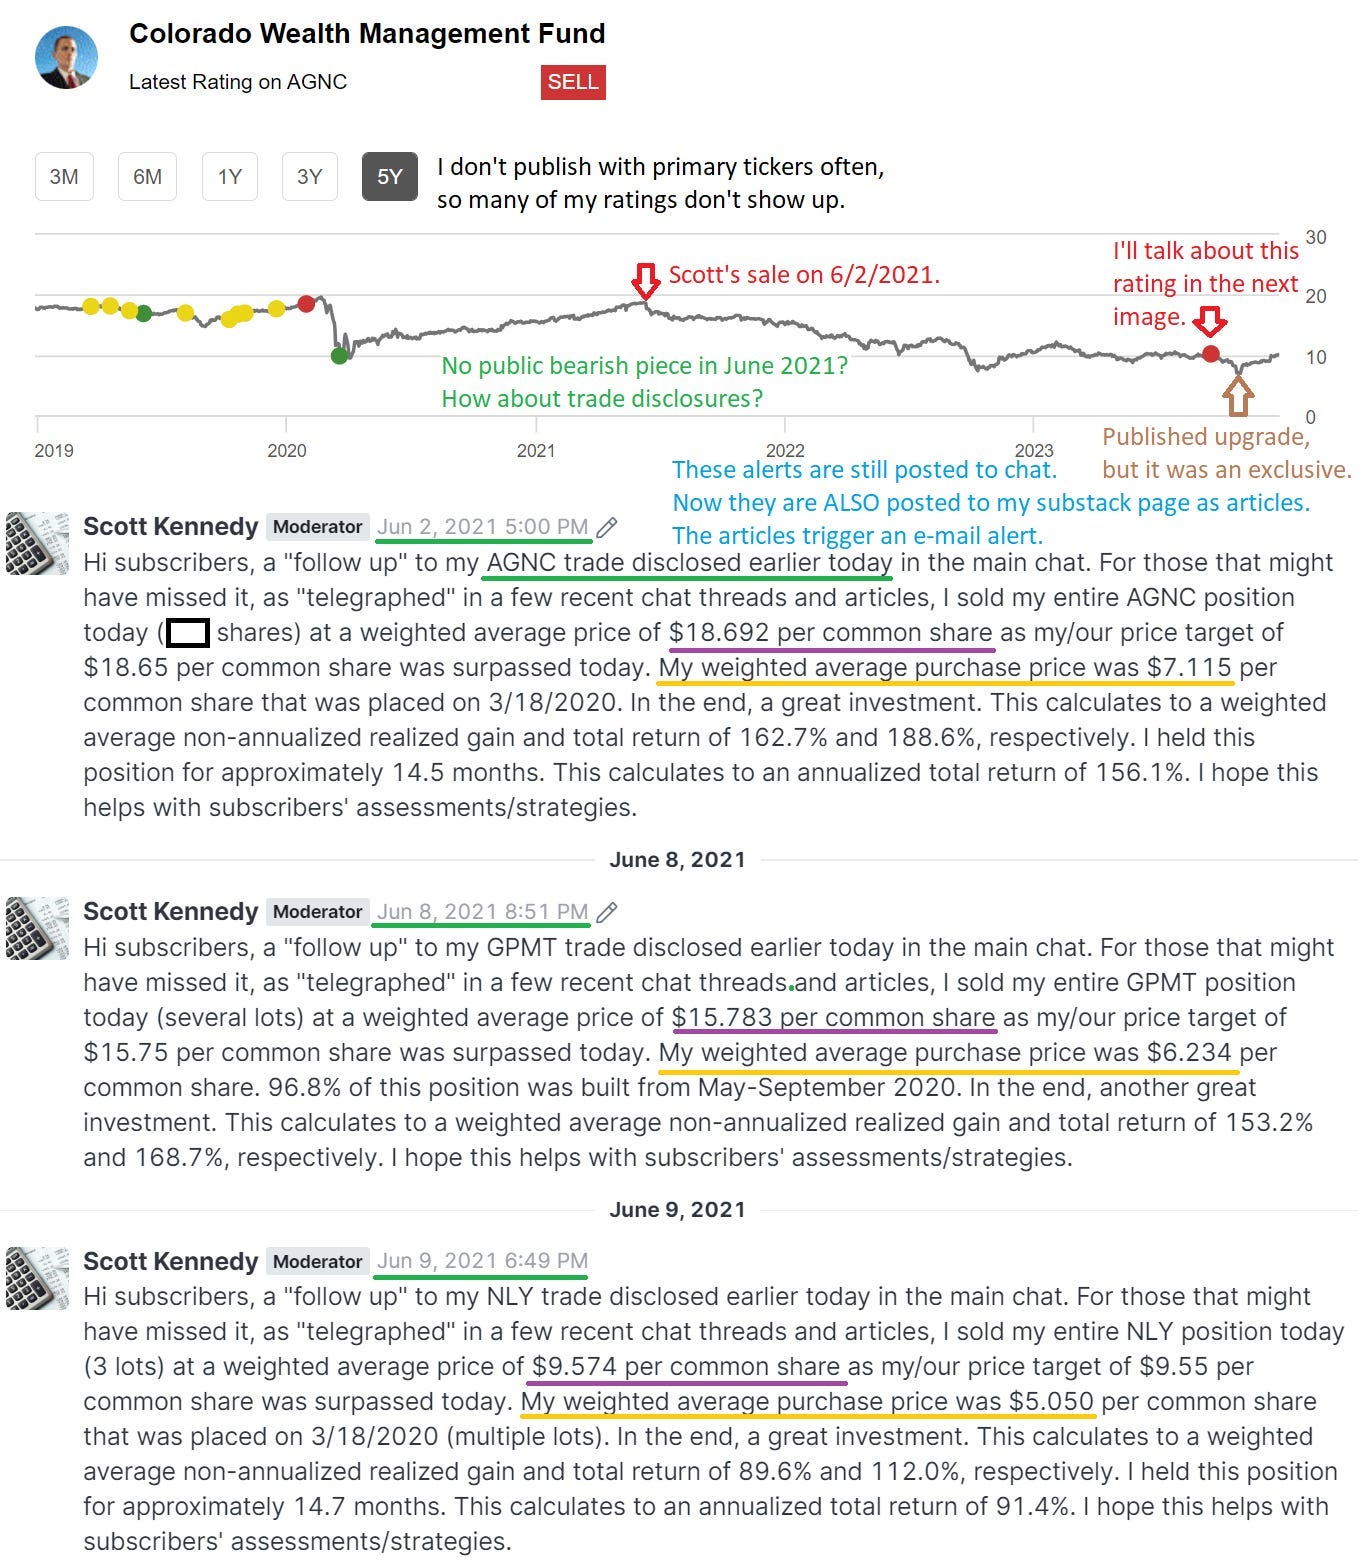
That seems pretty clear to me. June 2021 was a great month for taking profits.
Now, I want to dive into the sell rating from September 2023.
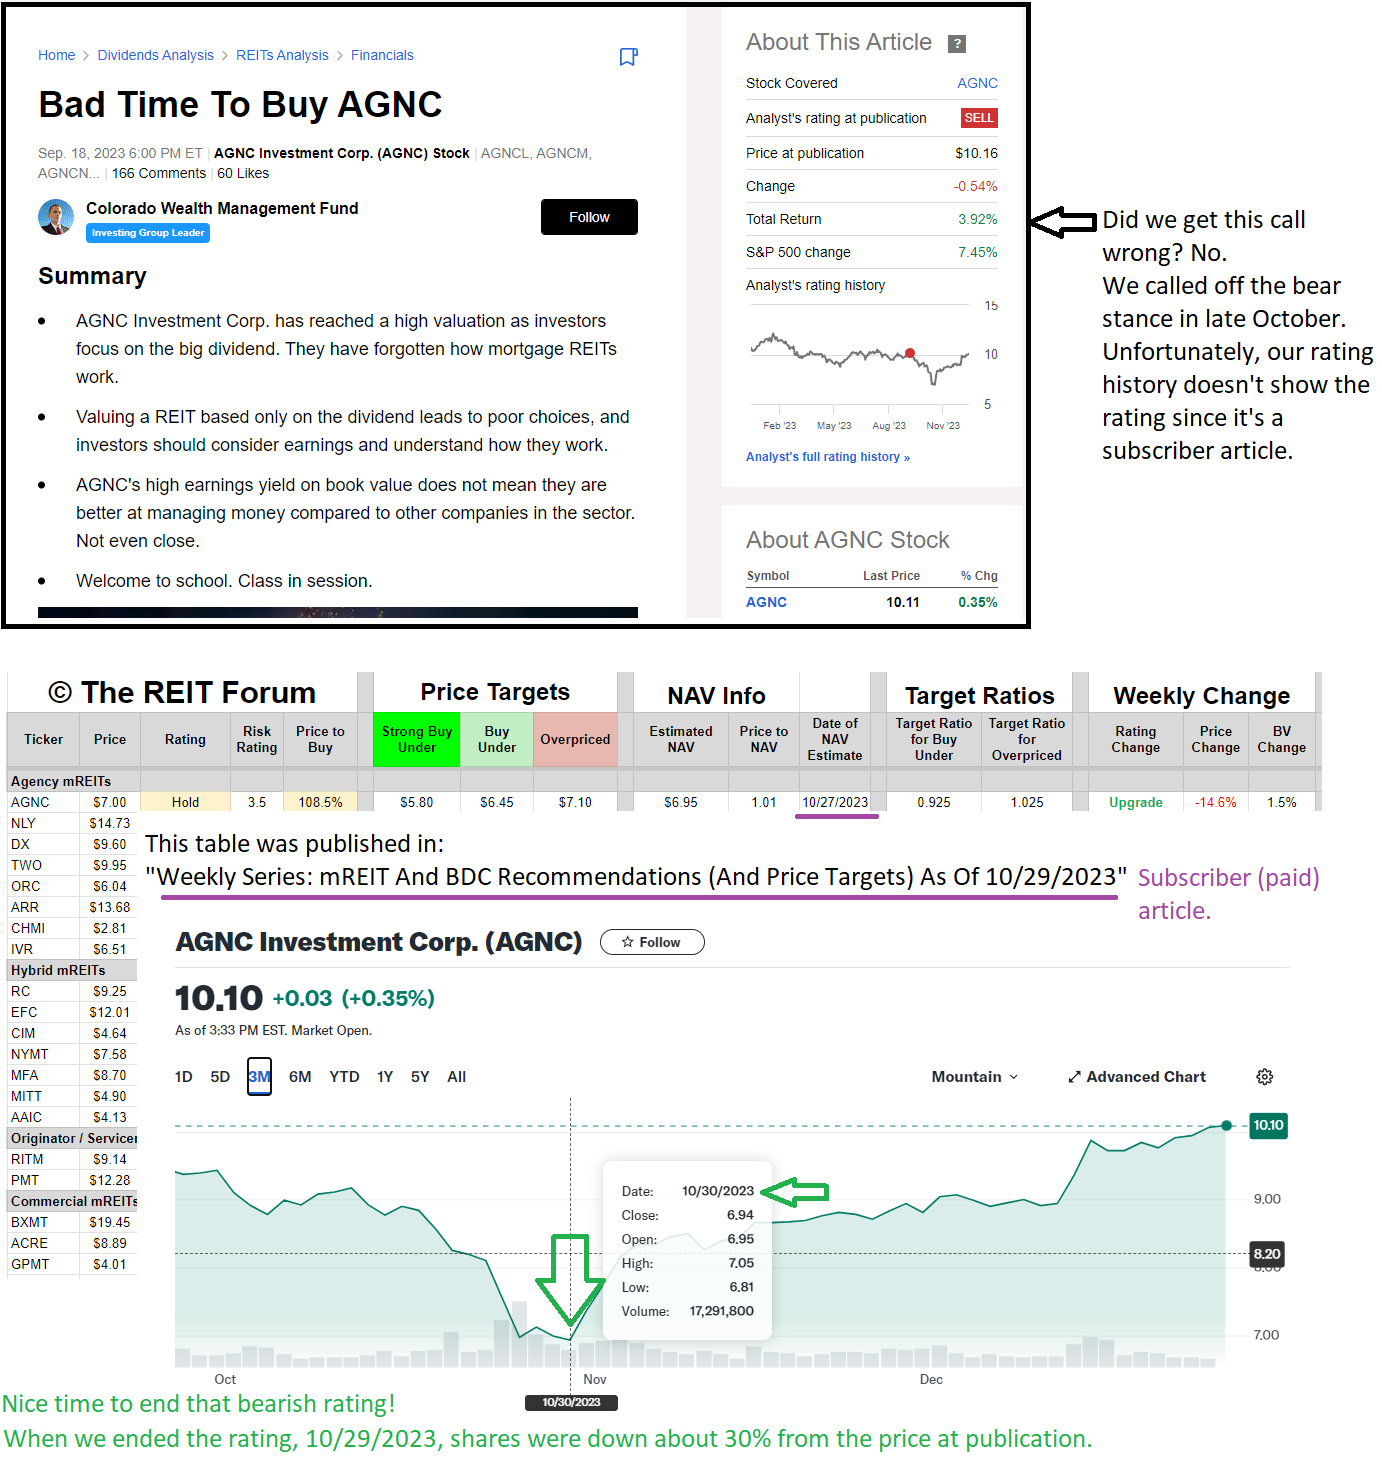
We use that weekly article to establish most of our ratings across the mREIT and BDC common shares. Each share has the data filled in like AGNC, but they got covered up by the AGNC chart.
It’s easy to review the weekly series because I can have one tab set that automatically filters for the mREIT and BDC series.

Demand This Data
Every analyst should be transparent about their portfolio. The portfolio they actually own, not some made-up portfolio.
Analysts are capable of doing it. They are humans. They place trades. Those trades have dates, entry prices, and exit prices. In many cases, they have dividends as well. There’s nothing crazy about asking for that data.
Using that data for a large sample period is a reasonable way to evaluate the accuracy of their calls. Just make sure to compare it to the sector they are covering. If you don’t consider the sector’s performance, you’ll end up following whichever analyst was in the hot sector last year.
Real-Time Data
The images for our positions were pulled directly from our subscriber spreadsheets. You can see the term “Google Sheets” in the image above. That’s where we keep the links to the sheets (for paid members). They indicate my holdings (present and past), but they also have data on several fundamental factors about each company.
Thank You
If you’re not a paid member of our service yet, you can try it out with a 30-day free trial.
Thanks for reading. If you enjoyed our work, tap that heart icon to tell Substack we deserve more love from the algorithm. It won’t post the article to your social media. It just raises the count for “likes” to prove we’re publishing something useful.
Member discussion