
Easy Preferred Share Swap: EFC-B vs EFC-C
TL;DR Version
EFC-B is a much better deal than EFC-C.
Article Starts
What if that TL;DR (Too Long; Didn’t Read) was stretched into over a thousand words, a chart, and images from prior calls? You’d get this article.
While I’ve been preparing for the Q4 2023 earnings season, I’m also checking in the preferred share prices. Sometimes we find great opportunities to swap between shares.
This time, the opportunity that popped up would involve selling a share we don’t have, so we can’t use the opportunity to swap.
The idea goes like this:
- Sell shares of EFC-C (EFC.PR.C) (EFC.PC) at $23.98.
- Buy shares of EFC-B (EFC.PR.B) (EFC.PB) at $19.97.
- Pocket that difference of $4.01 (probably slightly less with bid-ask spreads).
Disclosure: I own shares of EFC-B. I also own EFC-A, but that’s relevant to this idea.C
To enhance that disclosure, I want to mention that I trade actively in preferred shares because of these mispricing opportunities.
If EFC-B’s price got high enough, I would find another trade to move out of EFC-B and into a different share.
Pretty easy trade, right?
However, EFC-C has a much bigger dividend.
- EFC-C pays $2.1575.
- EFC-B pays $1.5625.
- You miss out on $1.785 over the next 3 years.
However, you still have $2.225 in your pocket from the lower price. That’s assuming you don’t even bother to earn any interest on the $4.01 savings.
If you can be bothered to buy a Treasury ETF, you’d have some interest income on the $4.01 savings.
Enjoy my articles? Subscribe to get some free articles and big previews of our paid articles. Most of my content never reaches Seeking Alpha Premium.
Rates Reset
The rates will eventually reset to equal the 5-year Treasury rate plus a spread.
- For EFC-C, the spread is 5.13%. It starts 4/30/2028.
- For EFC-B, the spread is 4.99%. It starts 1/30/2027.
This is a bit hard because the rate will only reset once every 5 years. If you know what the 5-year Treasury rate will be on each of those days, you must be a time traveler. I know you’re not a time traveler. If you were a time traveler, you’d be going into much more volatile investments. Therefore, you are not a time traveler. Therefore, you do not know what the 5-year Treasury rate will be on either of those days.
Since we cannot know the future 5-year Treasury rate, we’re going to assume that the rate on each of those days will be equal.
It won’t be equal, but there’s no way to know which day will have a higher rate. Therefore, equal is the best guess.
The 15 Months Between Reset Dates
We begin with a worst-case scenario. Assume the 5-year Treasury rate is 0.00% on 1/30/2027.
- In that case, the dividend rate for EFC-B would drop to $1.2475 per year.
- That’s much lower than EFC-C. EFC-C will still be paying $2.1575 per year.
- The difference would be $.91 per year.
However, it lasts for 15 months. Therefore, the difference would come out to $1.1375. The investor in EFC-C gets an extra $1.1375 during this period from 1/30/2027 to 4/30/2028 if the 5-year Treasury rate is 0%.
If the 5-year Treasury rate is greater than 0%, then EFC-B does better in this comparison. We’re creating the worst-case scenario because the market has severely mispriced the shares even in this scenario.
Recap
Today, swapping from EFC-C to EFC-B results in pocketing $4.01.
From today to 1/30/2027, EFC-B provides $1.785 less in income.
The investor is still ahead by $2.225 even if they didn’t bother to earn interest income on their cash.
From 1/30/2027 to 4/30/2028, we assume a 0% 5-year Treasury rate just to create a bear scenario. Therefore, EFC-B provides $1.1375 less in income over those 15 months.
The investor is still ahead by $1.0875.
Math: $4.01 - $1.785 - $1.1375 = $1.0875.
At this point, EFC-B is still ahead because the price was so much lower.
If the 5-year Treasury rate is higher than 0%, then EFC-B pays out a bigger dividend, and the difference is smaller. The difference might even be favorable for EFC-B.
Future Dividend Projections
- If we assume the 5-year Treasury rate will be equal for those two dates, then the difference in dividend payments after 4/30/2028 is very simple math:
5.13% * $25 = $1.2825 - 4.99% * $25 = $1.2475
- $1.2825 - $1.2475 = $.035.
The 5-year Treasury rate boosts each dividend by the same amount for our estimate. So the difference is simply $.035.
The investor in EFC-B will miss out on $.035 per year.
Years to Recover
How many years does it take for $.035 per year to cover the remaining difference of $1.0875?
Slightly over 31 years.
If the 5-year Treasury rate is higher than 0%, then EFC-B wouldn’t lose as much ground during the 15 months between the reset dates.
These 31 years are on top of the 3 years where both rates are fixed and the 1.25 years between EFC-B’s reset date and EFC-C’s reset date.
What if Treasury rates are just much higher every time EFC-C resets?
There’s one hypothetical scenario where EFC-C can win. If the 5-year Treasury rate happens to be higher for EFC-C’s reset date, then EFC-C can come out ahead.
Why not just bet on that scenario?
Because it is stupid.
While it “could” happen, there’s no reason to treat it as a high probability. There is about a 50% chance of rates being higher and a 50% chance of rates being lower. The chance of rates being exactly the same (if we go out 4 decimal places) is small enough to round it to 0%.
Either way, you’re exposed to future interest rates. As the shares get closer to resetting, we will want to review this idea again. I’ll probably end up reviewing it several times before then. Why? Because these price swings occur.
It is worth noting that the market screws up the valuation here pretty often. The valuation almost always favors EFC-B. Therefore, investors want to look at when the trade favors EFC-B by a big enough margin. I think that’s the case today.
Beware Liquidity
Liquidity is pretty light on these preferred shares. Quite a few traders read my work. If everyone piles in at once, some investors would get really bad execution. Remember that EFC-B is usually the better deal. If the price slips by $.90 (spread of $3.11 instead of $4.01) and EFC-B is only a slightly better deal, that is not what you want. That’s not maximizing the trade.
Here’s how I think about it:
- $4.00 spread: Great
- $3.80 spread: Happens quite a bit. Lately, it’s been available. Still a good deal.
- $3.30 spread: Just wait for better execution. We’ve had plenty of times where you can do better. EFC-B would still be better on a fundamental level, but it shouldn’t move this hard.
- $2.30 spread: No. You should be going in the opposite direction.
Chart
I built a chart by subtracting the price of EFC-C from the price of EFC-B.
Here’s how the math works:
$19.97 - $23.98 = -$4.01
Negative $4.01 would be really low on the chart.
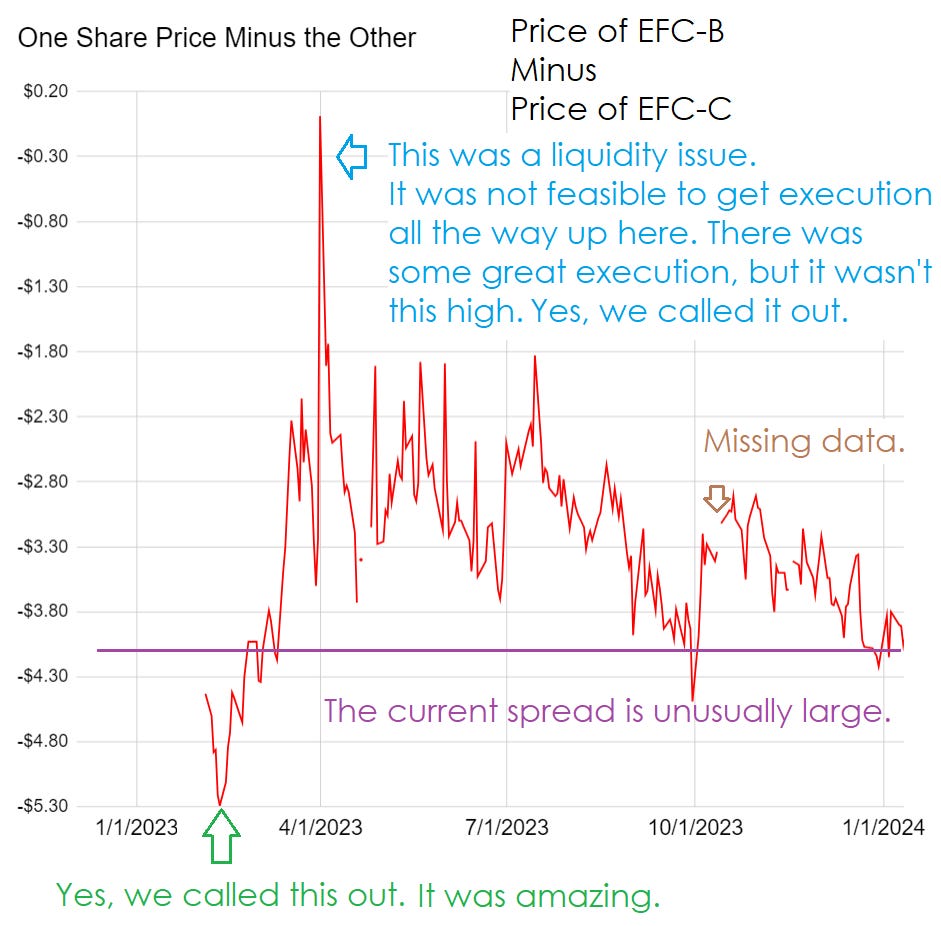
Yes, I could’ve done the chart with EFC-C minus EFC-B. Then, it would all be positive numbers. But that didn’t happen, so here we are.
One Last Note
I wrote this yesterday. This morning, the spread (at last execution prices) is $4.14 (bigger than $4.01). However, those execution prices are related to someone hitting the ask on EFC-C at $24.13. The bid is only $23.90. So technically, it was $4.14, but realistically, it is around $3.90.
Just beware of the liquidity. Anyone who enters a “market” order instead of a “limit” order is gambling pointlessly. It can take time to move between these positions. The goal is to get an attractive spread on the change.
Some investors may want to keep a similar dollar amount invested. There’s nothing wrong with that. I used an equal share count for the comparison because it made the math simpler. Simpler is better. Once investors agree with the math, they agree with the conclusion:
EFC-B is a better deal than EFC-C.
Images From the Big Callouts
Analysts lie.
Here are some screenshots from our prior calls.
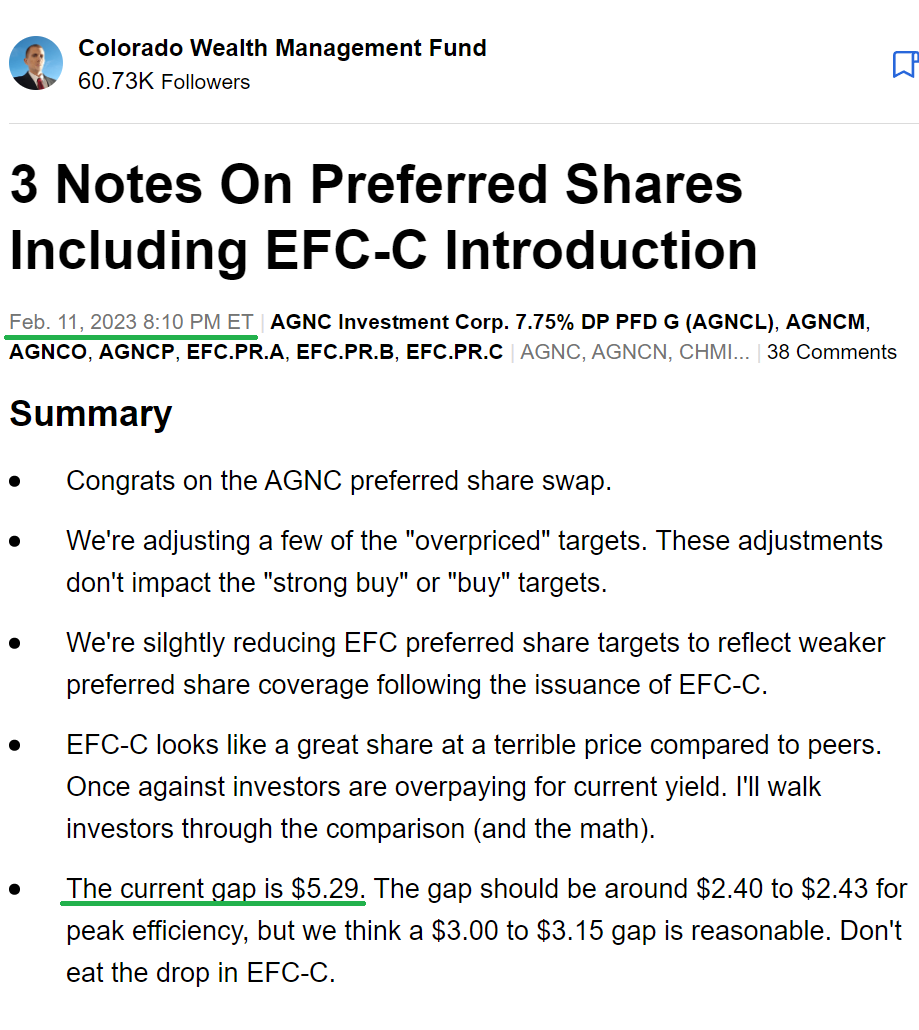
First, the article from February 11th, 2023, when EFC-B was a vastly better deal than EFC-C.
It was like today but ramped up to another level. It was the green arrow on the chart:
Then, EFC-B dramatically outperformed EFC-C.
I published another report at the peak indicated by the blue arrow:
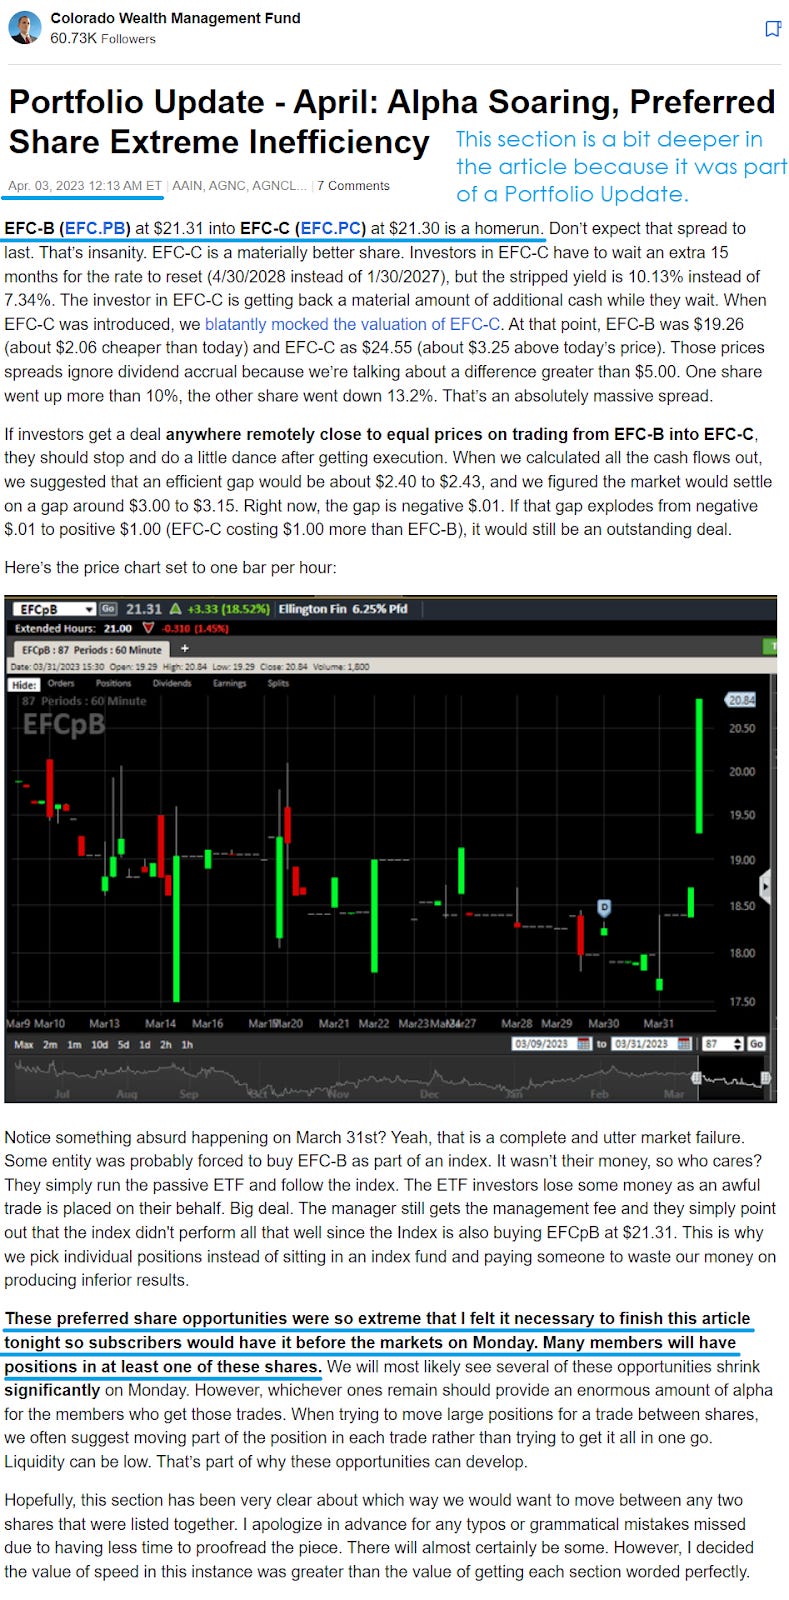
That was back before we really had the Substack page rolling, so I had to use screenshots from Seeking Alpha.
If you enjoyed this piece, tapping that heart icon is greatly appreciated.
Member discussion