
ARE: Alexandria Is On The Discount Rack
I have a Seeking Alpha article coming up on Alexandria Real Estate. I want to share part of the article that I didn’t include in that public release.
My Expectations
I think, on average, we should expect normalized FFO per share growth to run at least 3% annualized (big bear scenario) up to about 8% annualized (big bull scenario). That’s an average growth rate, and there should be years outside that range. It excludes any non-recurring items. That’s a good range for a REIT with a 4.13% dividend yield (at $117.08). I would guess that the actual forward growth rate probably runs around the 5% to 6% range over the next decade, but that’s a long time, and other factors certainly could creep up.
I expect the dividend growth rate to be comparable to FFO growth rates.
FFO and AFFO History + Valuations
ARE looks quite cheap by historical metrics:
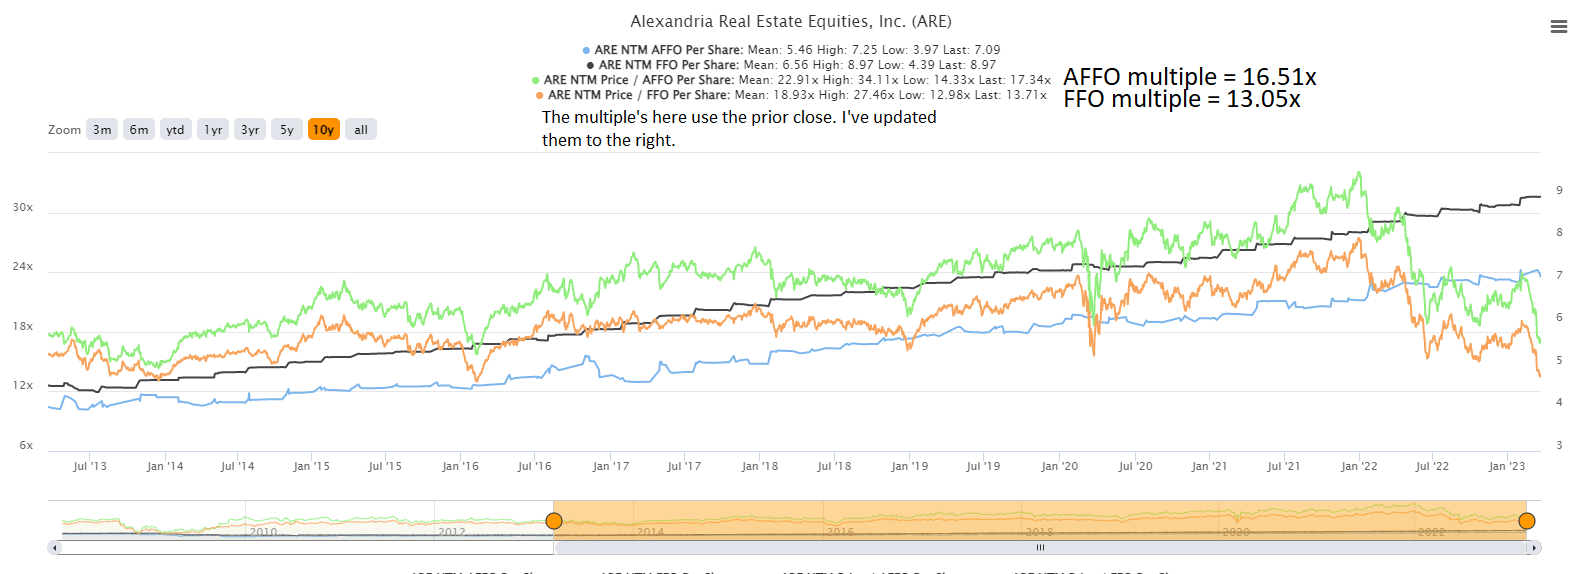
Source: TIKR.com
It is nice to confirm that FFO and AFFO per share have steady lines moving up and to the right. The AFFO numbers for ARE were a bit more volatile than just using FFO, so I used FFO for my comparison.
Using the multiple of forward FFO, shares closed on 3/22/2023 just a tiny bit higher than they were at the bottom in February 2016:
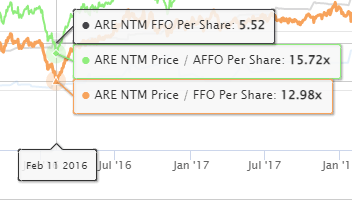
Source: TIKR.com
It was 13.05x at the close on 3/22/2023 vs. 12.98x when the sector bottomed out in early 2016. That was a recession scare in early 2016, so the market clearly has some concerns about ARE in a recession. However, that balance sheet looks good, and balance sheet strength is a major factor in recessions.
Note: AFFO is generally a better measure of cash flow than FFO. When evaluating cash flows, we want to start from AFFO. However, when we’re looking for historical multiples, we really want a smoothed figure for earnings to isolate the share price volatility. In this case, FFO provides a smoother figure for creating that historical comparison. Further, the decision to use FFO for historical multiples relies on a strong connection between FFO and AFFO over time. That would be an issue if the gap between the numbers (in percentages or ratios) changed dramatically. On average AFFO (using TIKR’s figures) represented about 83% of FFO. Currently, it represents about 79%. That’s because less than 2 weeks ago there was a slight reduction in the consensus AFFO estimate. Before that, AFFO was estimated to be 81% of FFO for the year. That’s close enough that we can use the less volatile metric for evaluating historical ratios.
Outlook: We are clearly bullish on ARE. Shares are trading within our Strong Buy range. Currently shares of ARE are trading at about $119.72.
Disclosure: I am long ARE. I bought shares on June 16th, 2022 at $132.28. I doubled my position on March 24th, 2023 at $116.14.
Thank you for reading and feel free to share.
Member discussion