
Apartment REIT Vacancy Rising
We cover 6 apartment REITs:
- AvalonBay (AVB)
- Equity Residential (EQR)
- Camden Property Trust (CPT)
- Essex Property Trust (ESS)
- Mid-America Apartment Communities (MAA)
- UDR (UDR)
We also cover 2 single manufactured home park REITs and 2 single-family housing REITs, but they aren’t the focus today.
Vacancy
Apartment vacancy continues to increase.
- Q3 2023: 5.2%
- Q4 2023: 5.4%
For reference, the pandemic peak:
- Q1 2021: 5.5%
- Q2 2021: 5.5%
This isn’t a perfect comparison. Occupancy during the pandemic was a bit inflated by deadbeats. Specifically, I’m referencing “renters” who were delinquent with no plan to pay past-due rent.
Apartment REIT vacancies should correlate with the markets they invest in.
Historical Chart
One of my favorite sources for developments in the real estate and mortgage market is Bill McBride from Calculated Risk. He posted the following chart:
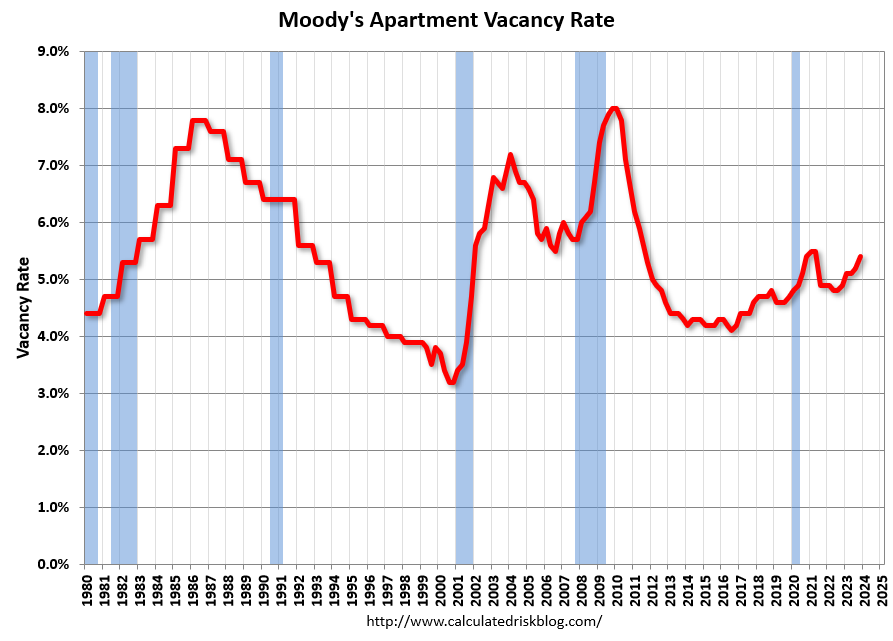
Bill’s chart goes back much further than the one from Moody’s update. In the chart from Moody’s:
- The vacancy is on the left axis.
- The rent change is on the right axis.
You’ll see how vacancies and rents have developed over the last few years:
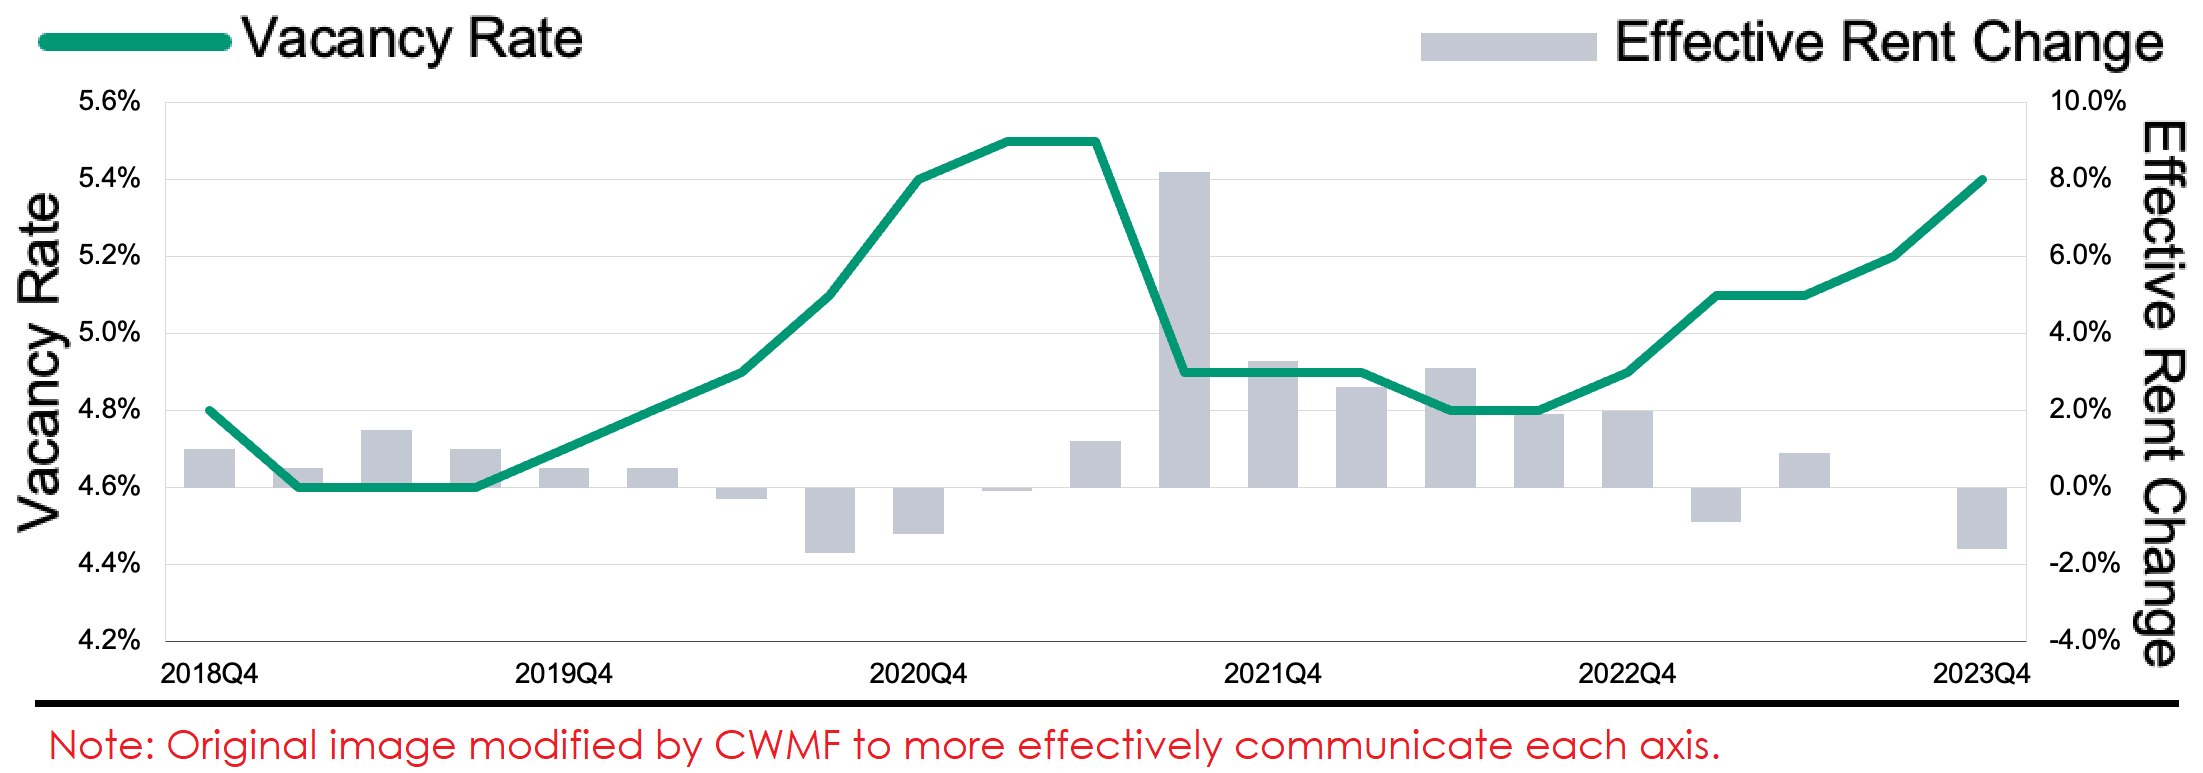
The apartment REITs achieved higher rent growth through effective management and market selection.
New Supply Timeline
The best graphics for new supply came from presentations by CPT:
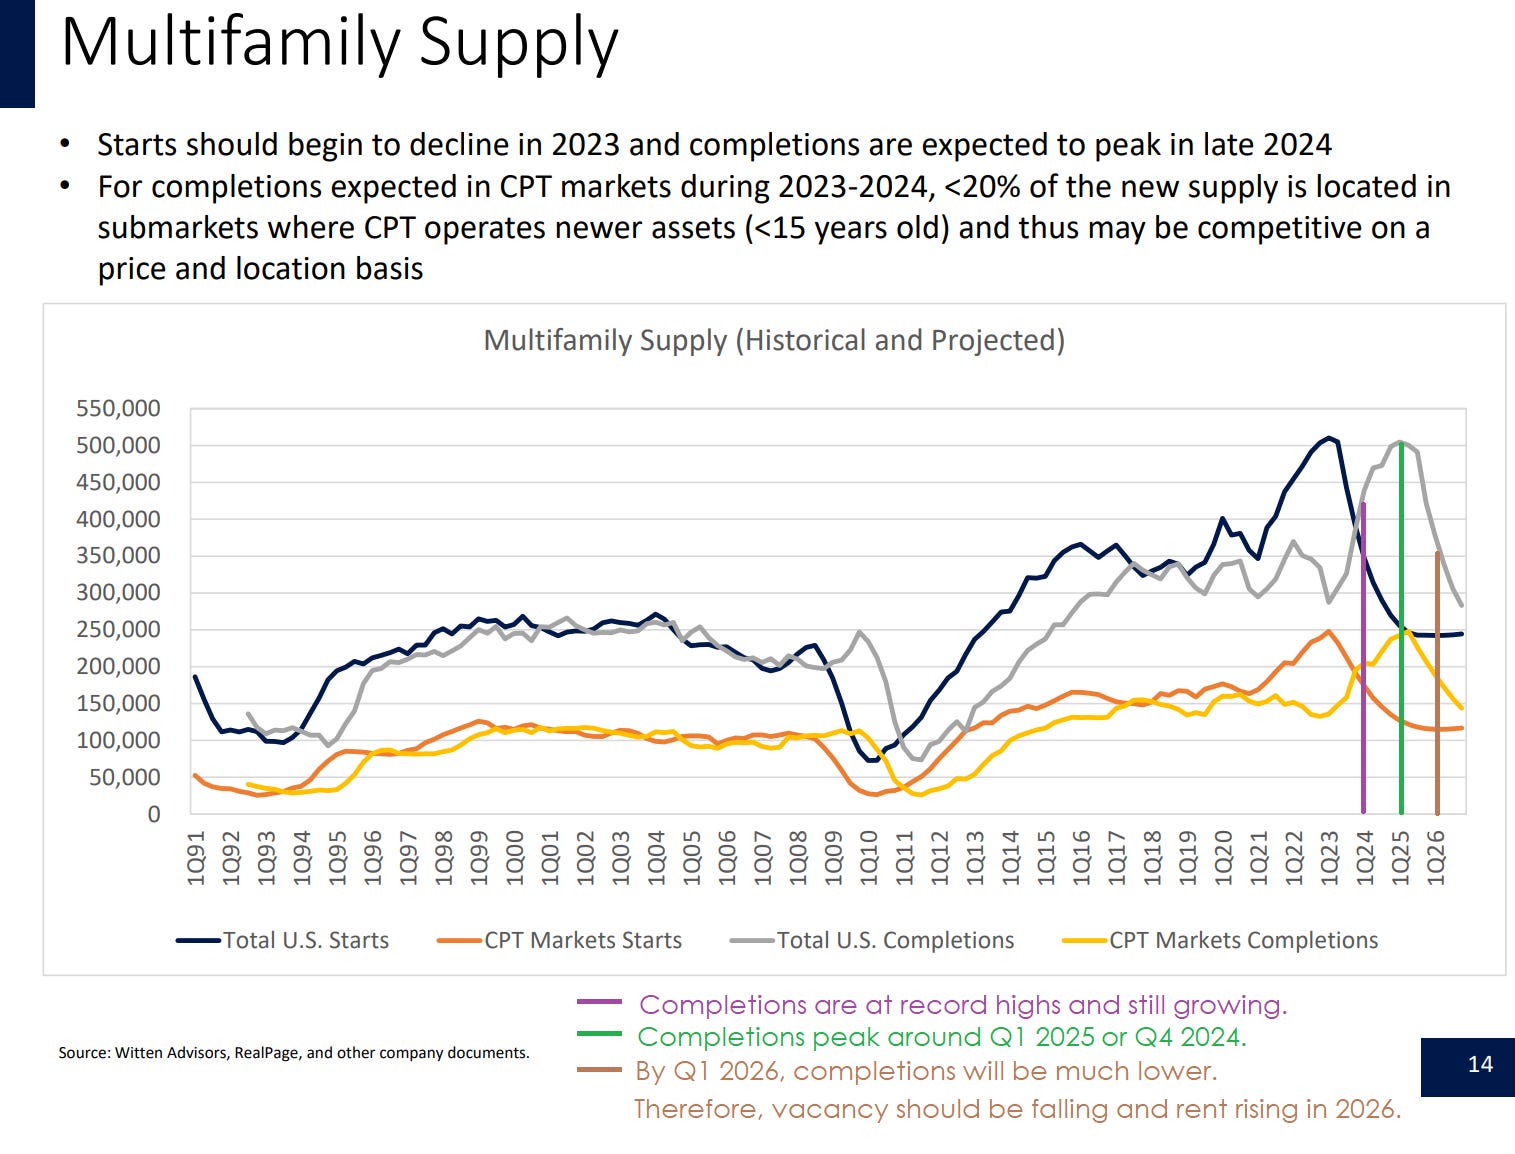
I added the purple, green, and brown lines to emphasize the first quarter of each year.
We’ve been using those charts for a few years to evaluate the upcoming level of supply.
This graphic makes it appear CPT is less exposed to new supply. I don’t believe that’s the case.
Total starts and total completions are greater than or equal to the starts and completions in CPT’s market. That’s basic math. Since CPT is not in 100% of markets, there must be fewer starts and completions.
It would be more effective to scale each line as a percentage of housing units for that market. However, I expect that would look less favorable for CPT and MAA. They experienced outstanding rent growth, NOI (Net Operating Income) growth, FFO growth, and AFFO growth. That was a function of their sunbelt exposure. However, those markets became very appealing to developers and should see more development relative to existing units. Therefore, they should see more pressure on vacancy and rent spreads.
The volume of construction is heavily impacted by interest rates. When interest rates were low and inflation was high, developers made a very reasonable choice to ramp up production.
Note: CPT last provided that chart in September 2023. In the November 2023 presentation, it was replaced by a slide that contains materially less information. This decision reinforces my belief that it’s good to be patient in building positions.
Valuation
The REITs all trade between 80% and 99% of the consensus NAV:
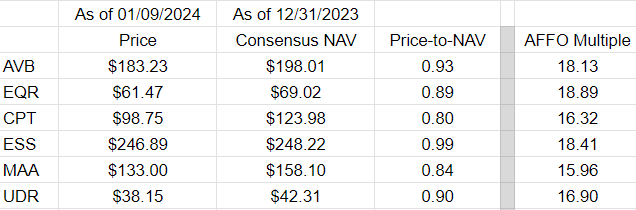
That gap in price-to-NAV is unusually large.
The AFFO multiples are far enough apart to notice, but it’s less surprising than the difference in price to NAV.
Note: Consensus NAVs are not always an excellent estimate of the actual value of the real estate. However, they are usually pretty good for REITs with market capitalizations in excess of a few billion.
I find CPT and MAA more attractive here.
It feels weird to type those words. I was extremely critical of their valuations in the past.
During the run to record highs in early 2022, CPT and MAA were outperforming. AFFO ripped higher. Share prices surged.
Since then, they underperformed. Looking at the decline relative to record highs and to 52-week highs, we can see that CPT and MAA were punished to a greater extent than peers. The market became concerned about weaker leasing spreads and rising vacancy:
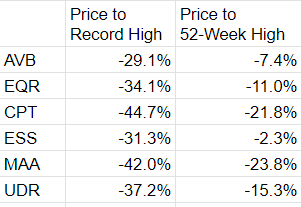
New supply is a headwind for all of the apartment REITs, but it is more significant in the sunbelt markets (CPT and MAA). I see long-term value, but we haven’t been rushing to get in.
What Changed
MAA was about $229; CPT was about $178. Those prices were too high.
Today, they are $133 and $98.75 respectively. These prices are much better.
To put that decline in perspective, CPT is down about $80. The current dividend rate is $4.00/year. It may get raised soon, but for the moment it is $4.00. The price declined by 20x the current dividend rate.
That’s a big difference.
Note: CPT’s dividend should grow. It is 20x the current rate, but it should take far less than 20 years for CPT to pay out the next $80 of dividends. If you do this math with some high-yield REITs, you should be accounting for dividends to decline.
Share prices are down over 40% since their peak. For MAA and CPT, that was on 12/31/2021.
During that same period (12/31/2021 to today), our total return was about negative 1%. That was a dip in 2022, followed by a recovery in 2023.
If we decide to pick up shares, we can afford far more of them because of the stronger performance.
Conclusion
Investors should expect a few things when it comes to the news cycle for this sector:
- More headlines about apartment vacancy increasing.
- Rents to be declining moderately (a huge contrast to surging rents).
- The story to shift around late 2025 to 2026.
If these things play out, that won’t be a surprise. The dramatic change in leasing spreads and vacancies we’ve seen since late 2021 was not a surprise (to us). However, there will probably be several people who are loudly shocked by the entirely predictable sequence of events.
Disclosure: Long AVB, CPT
Enjoy the article? Tap that heart icon to tell Substack my articles deserve some love from the algorithm.
If you want to share the post, you can use the share button below:
Member discussion