
Annaly: Not Great, But Finally Reasonable
The volume of articles published here is about to increase.
Annaly Capital Management
Annaly Capital Management closed at $23.11 on February 8th, 2023. That’s the last time they saw anything over $23.00. Last night shares dipped down to $18.35. That represents a 20% decline in the share price in materially less than two months. So, what happened?
NLY reported earnings on February 8th, 2023. It didn’t look like a bad report. At least, not until management indicated they were planning to significantly cut the dividend. That sent shares down and the chart since then shows a pretty clear trend. As time moves on, the price moves down.
However, there are a few interesting things to know. One is that management specifically referenced the idea of setting the new dividend based on the amount of book value per share. That was a clear admission that book value is the metric that actually drives returns. Book value is often a much better indicator than earnings because it tells you how much is left in the REIT for investing.
The proper time to enter a mortgage REIT is when it has an attractive discount to book value. Ideally, it is when you can combine a large discount to book value with an attractive spread between MBS and Treasury rates. In this ideal world, the discount to book value would also be unusually large relative to similar peers.
The proper time to exit is identified by the opposite signs. An unusually high price-to-book ratio is a bad sign for buyers, but it is a good time to harvest gains and walk away.
By our estimate, NLY is currently trading at about 89% of book value. That is using today’s closing price of $18.35 and a book value estimate of $20.70. The estimate uses the latest values for MBS as well as adjusting for rates throughout the bond market. LIBOR rates move up or down? That changes the value of the hedges. We’ve already got it factored in. That’s a remarkably steady book value when compared to the quarter-ending value of $20.79. It’s been pretty common to larger swings. However, moves in interest rates this quarter have largely canceled each other out when it comes to the impact for NLY’s projected book value.
Based on this valuation, we think NLY is a bit attractive. It’s not the best deal in the sector, but it’s reasonable. A discount of about 10 or 11% to book value gives investors a reasonable cushion. Further, we expected NLY to cut their dividend in Q3 2023. They came out with the cut early, taking the dividend from $.88 to $.65. That negative catalyst is out of the way now, which is an improvement. Therefore, we’re taking a view that is just a little bit bullish.
How about the preferred shares? There is less upside, but there is also far less downside.
NLY-G at $22.45 is the weakest deal in the batch. It has a little extra upside compared to NLY-F, but it has a lower yield. Both shares are already floating. If short-term rates fall within a few years (as suggested by the yield curve), the decline is most painful for NLY-G since it only has a 4.172% spread over short-term rates. Much weaker than 4.993% for NLY-F and 4.989% for NLY-I. I don’t think the extra upside is worth it.
NLY-F at $23.65 is the middle choice. It offers a big yield today but has a smaller discount.
NLY-I at $22.16 comes in slightly ahead of NLY-F. NLY-I has a lower yield today, but it begins floating on 6/30/2024 and the lower share price makes up for the gap in yield. When both shares float, they should trade at very similar prices since the spreads are so similar. Investors in NLY-F are simply paying a bit more and getting a large chunk (but not all) of the difference back through higher dividends across the next 5 payouts.
Where It Gets Strange
AGNC carries a higher price-to-book ratio than NLY. AGNCN trades at $24.60 compared to the $23.65 for NLY-F. Both shares are floating and have similar spreads. The 5.111% is a bit larger for AGNCN, but not much. AGNCN benefits from dividend accrual since shares go ex-dividend near the end of this month and NLY-F already went ex-dividend. However, that doesn’t explain a gap of $.95. AGNCN is simply a little bit more expensive.
However, when you look at AGNCM at $20.52 (floats 4/15/2024), AGNCO at $21.04 (floats 10/15/2024), and AGNCP at $19.55 (floats 4/15/2025), you see much larger discounts than you do with the NLY preferred shares. While these three shares are not floating yet, the floating dates aren’t that far. It’s interesting to see the substantial disconnect between shares. Floating earlier is clearly an advantage in this environment, but the market has been overvaluing the early floating date. We saw something similar as around the end of Q3 2022 through part of Q4 2022. It seems when the stress in the market picks up, the pricing errors become larger.
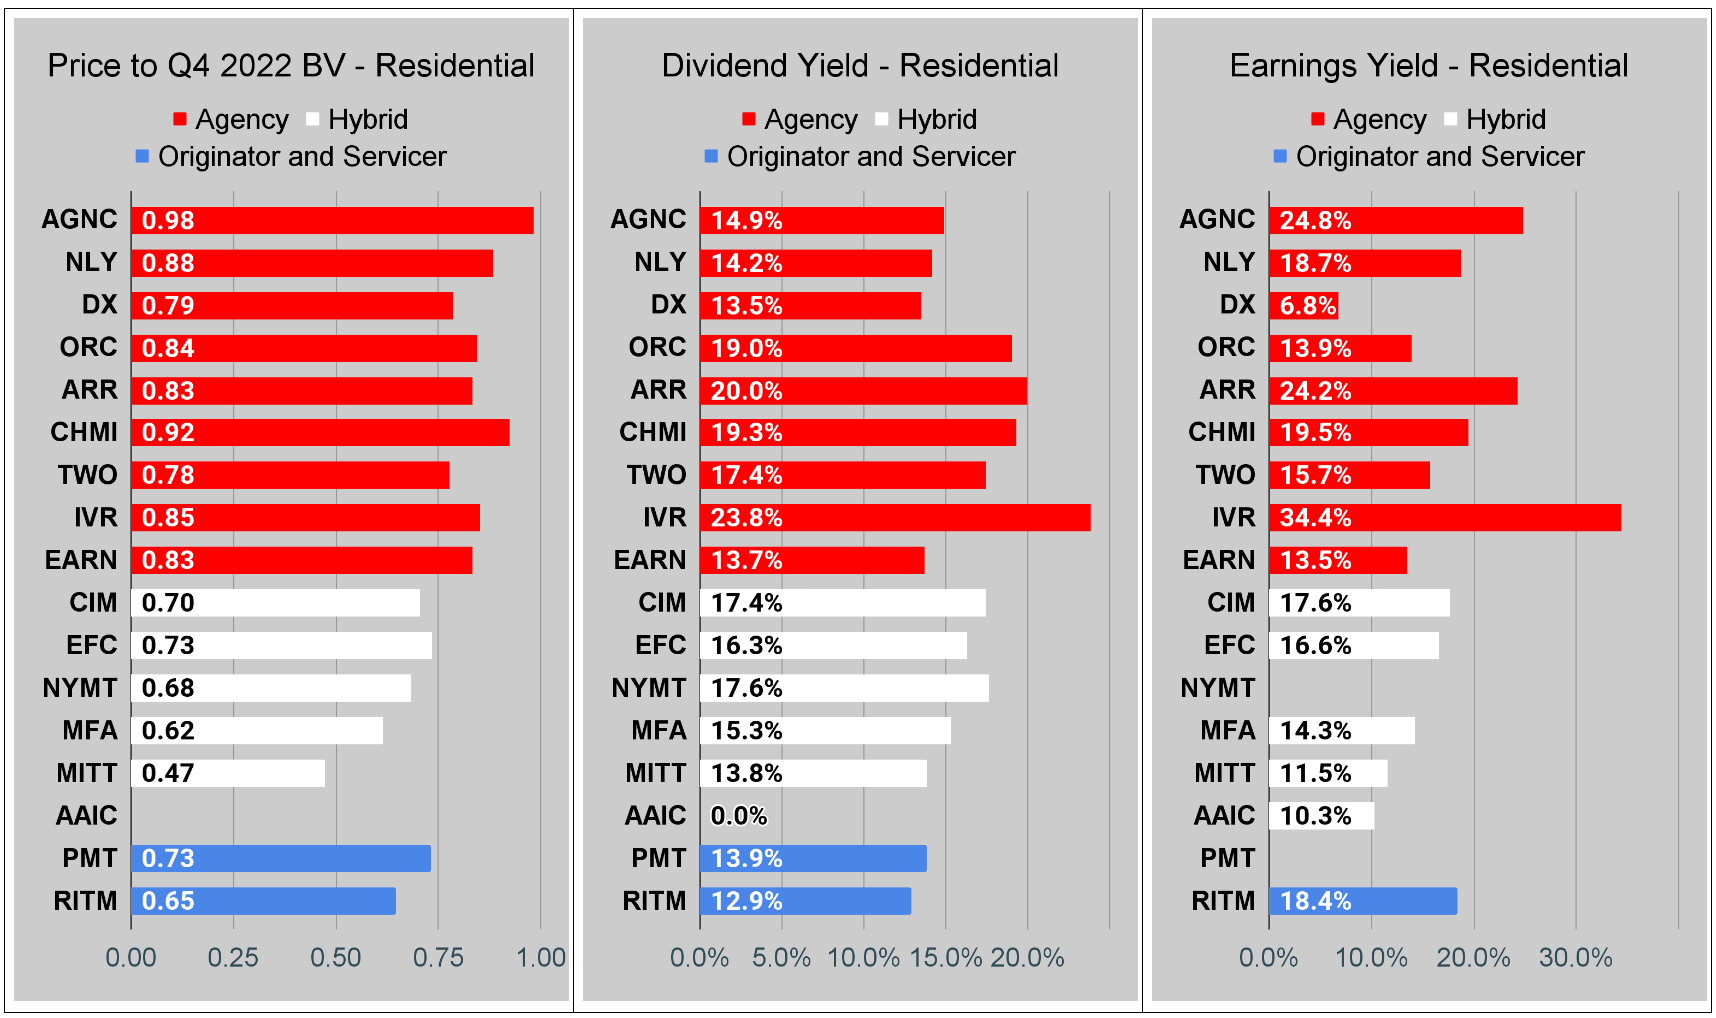
Residential Mortgage REIT Charts
Note: The chart for our public articles uses the book value per share from the latest earnings release.
The current estimated book value per share is used in reaching our targets and trading decisions. It is available in our service, but those estimates are not included in the charts below. PMT and NYMT are not showing an earnings yield metric as neither REIT provides a quarterly “Core EPS” metric.
Second Note: Due to the way historical amortized cost and hedging is factored into the earnings metrics, it is possible for two mortgage REITs with similar portfolios to post materially different metrics for earnings. I would be very cautious about putting much emphasis on the consensus analyst estimate (which is used to determine the earnings yield). In particular, throughout late 2022 the earnings metric became less comparable for many REITs. It remains far less relevant today. You can see this clearly by looking at the earnings yield for DX compared to AGNC and IVR. This is one of the weaknesses in how “Core EPS” metrics are designed.
You can click on any of these charts to zoom in. Due to some technical limitations, it has to zoom in all 3 charts for each sector at the same time.
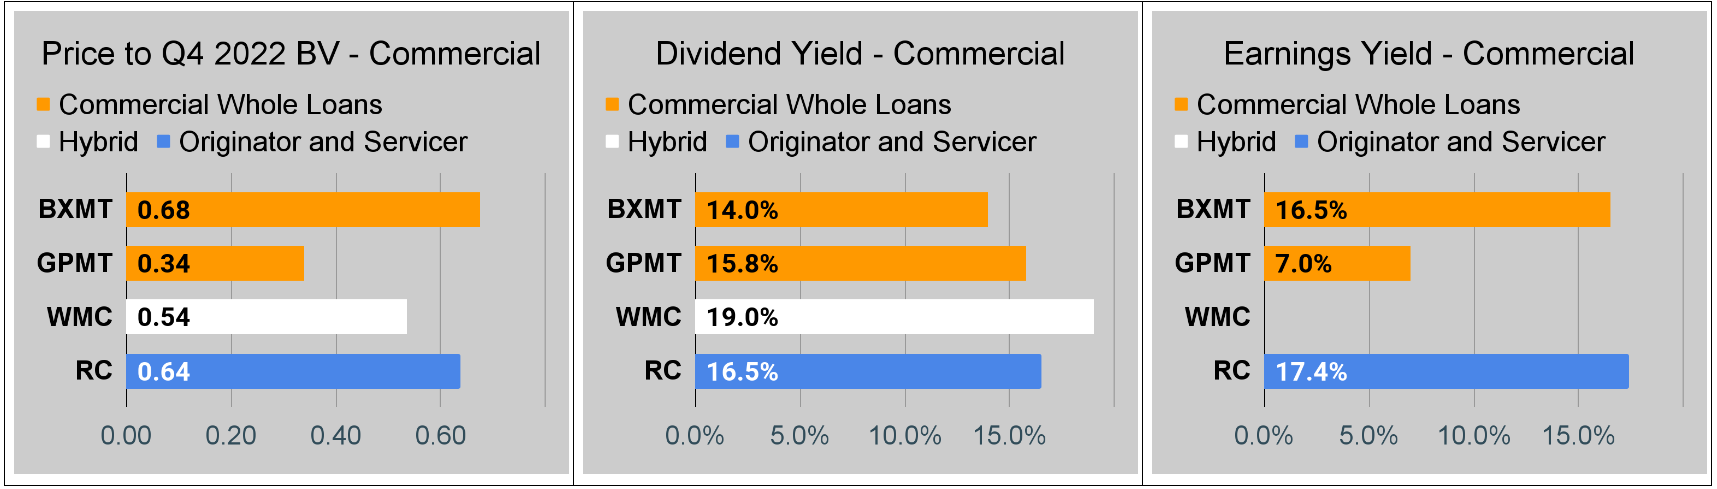
Commercial Mortgage REIT Charts
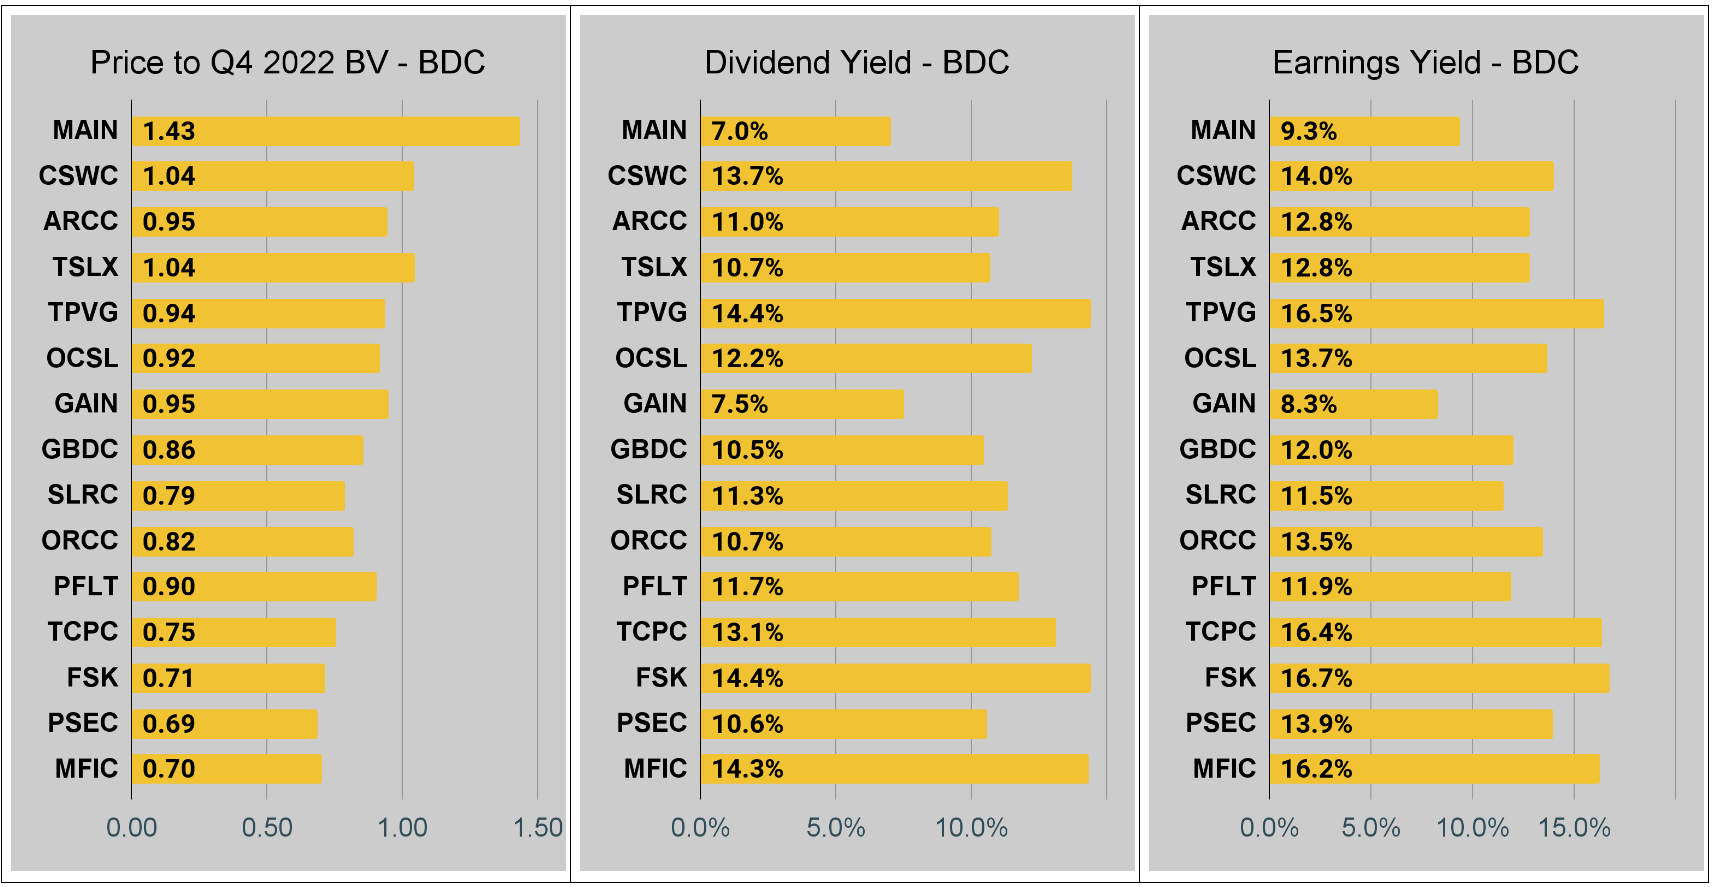
BDC Charts
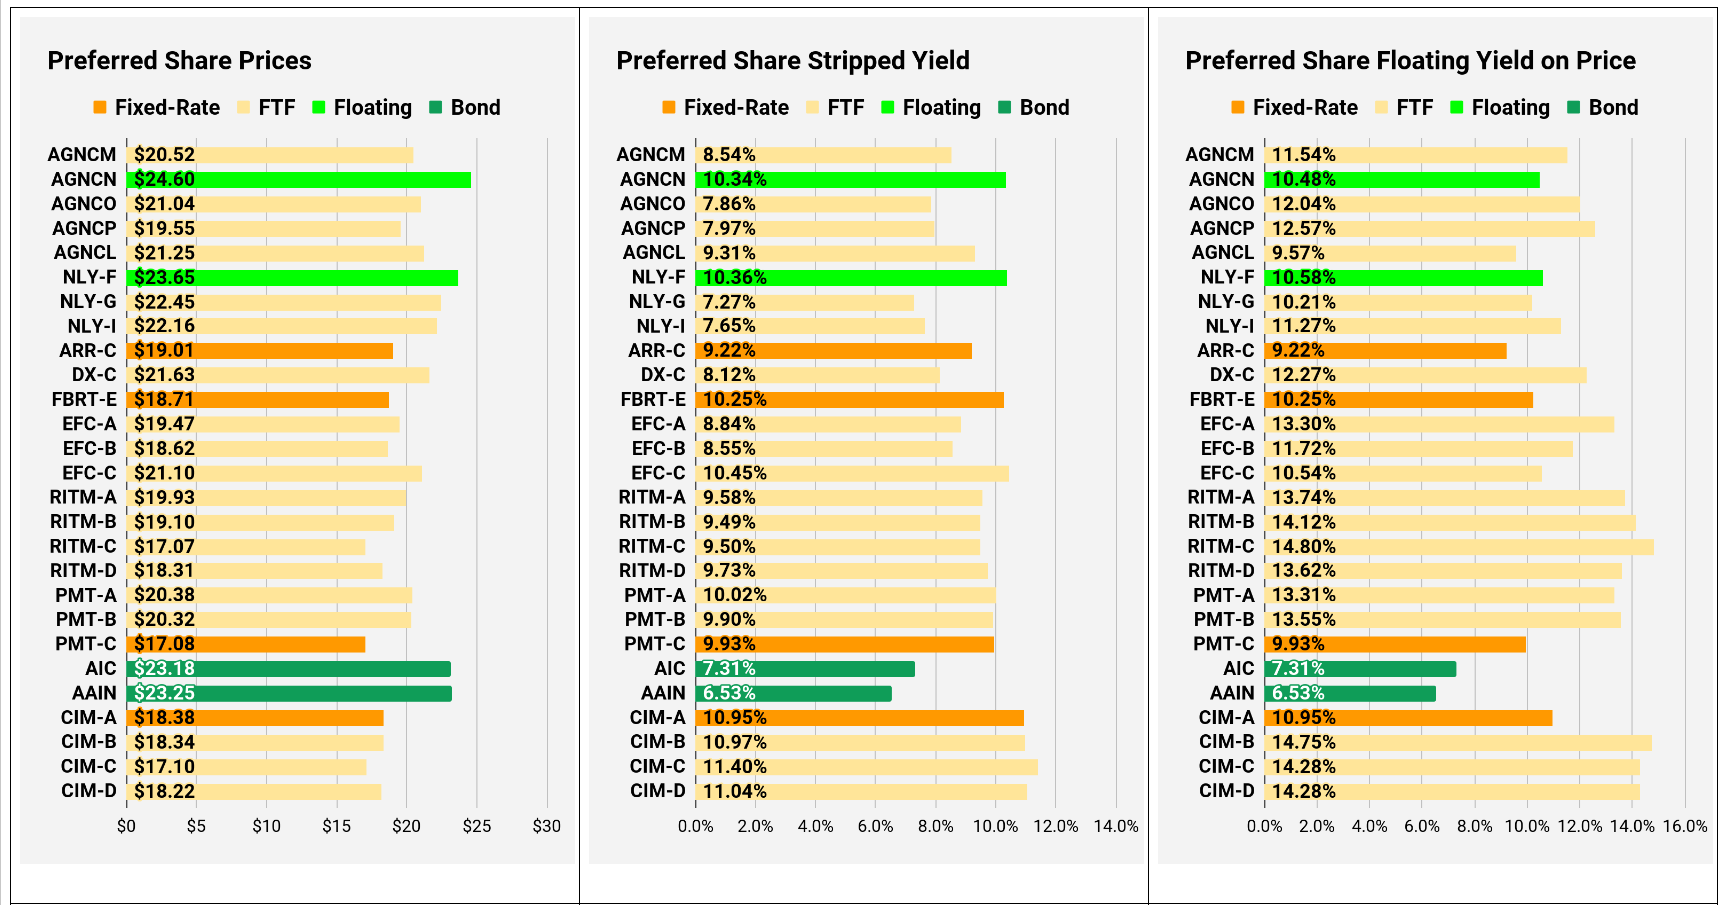
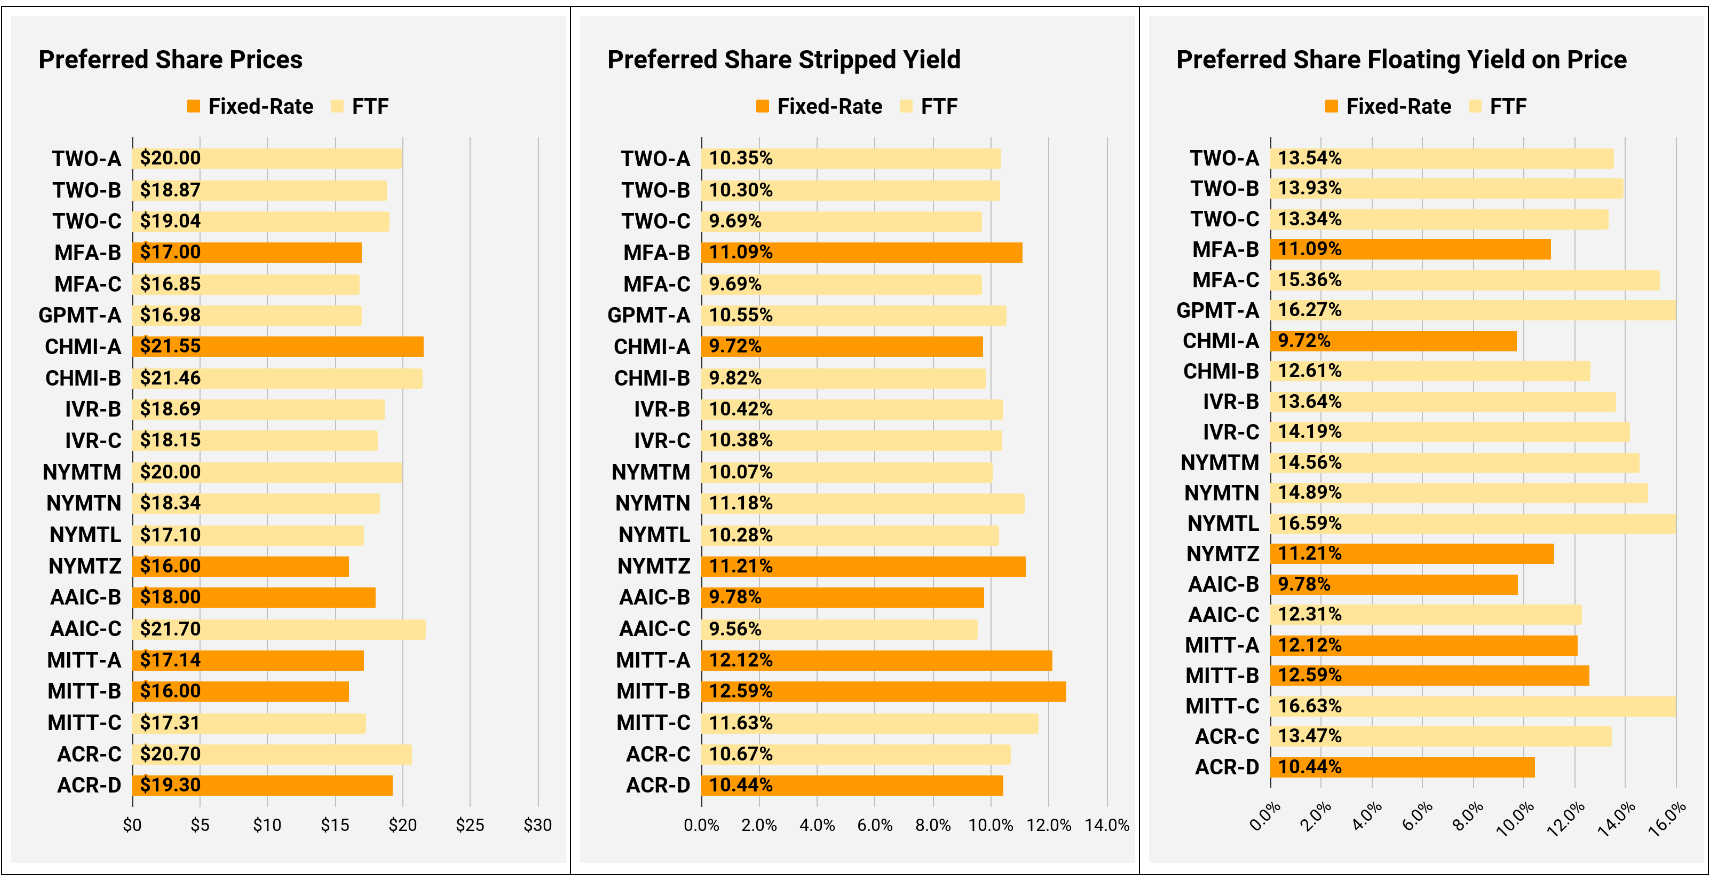
Preferred Share Charts
I changed the coloring a bit. We needed to adjust to include that the first fixed-to-floating shares have transitioned over to floating rates. When a share is already floating, the stripped yield may be different from the “Floating Yield on Price” due to changes in interest rates. For instance, NLY-F already has a floating rate. However, the rate is only reset once per 3 months. The stripped yield is calculated using the upcoming projected dividend payment and the “Floating Yield on Price” is based on where the dividend would be if the rate reset today. In my opinion, for these shares, the “Floating Yield on Price” is clearly the more important metric.
Conclusion
Thank you for reading. The volume of articles on this site should increase significantly throughout the next few months. Please excuse any strange formatting, as it may take a few articles to get familiar with the updates to how this site works.
Member discussion