
AGNC Preferred Share Absurdity, Yet Again (Hurray)
Note: I plan on offering our paid service through this website soon. When that happens, you should see a dramatic increase in articles, including an increase in free articles.
If you’re investing in any preferred shares, it makes sense to monitor alternatives that would also be appealing to you. You may find that the shares trade at materially different prices. If you’re in the less attractive share, you can quickly swap your position to improve your return profile. That’s precisely what we did recently. Before putting in our own trade, I wanted to highlight the opportunity for our paid members.
Currently, our paid service is only on Seeking Alpha. However, I plan to also offer it here so members can choose which platform works best for them. When that happens, you’ll see far more articles, including more free articles, published through our site.
Timeline
- On June 15th, 2023, we posted the article below for paid members.
- On June 16th, 2023, we followed our research. We placed the trade and issued a trade alert.
- Also, on June 16th, 2023, we shared the trade alert with our readers here.
Here is the article from June 15th, 2023:
AGNC Preferred Share Absurdity, Yet Again (Hurray)
- Got AGNCM? Consider swapping it for AGNCP and pocketing a difference of more than $2.00 per share.
- This is a very easy call. The market screws up sometimes, but it rarely screws up this badly.
- As the chart demonstrates, there have been very few days where the trade was available at such an extreme gap in valuation.
- Swapping from AGNCO to AGNCP is also a great deal. The fundamental valuation gap is slightly smaller, but still significant. Extremely rare exchange ratio!
- I have some shares of AGNCO and if the pricing disparity holds, I may swap my AGNCO for more AGNCP.
Thanks to our REIT Forum members for calling these opportunities out in chat. Those smart calls brought my attention to a pricing failure that just developed:
- AGNCP is significantly underpriced relative to AGNCM and AGNCO.
Here's the chart for the historical price spreads for (AGNCM), (AGNCO), and (AGNCP).
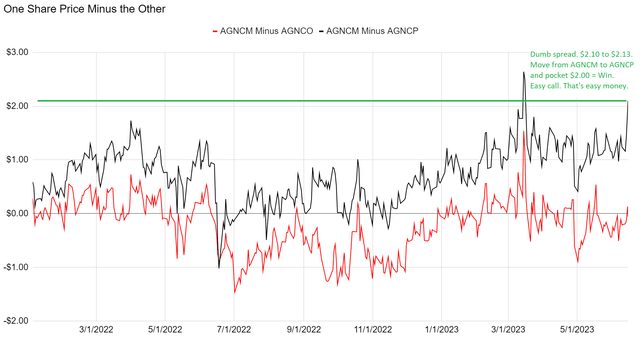
AGNCM closed about $2.10 to $2.13 higher than AGNCP. That's way too big.
We should consider future cash flows. Here's a projection using some rates I picked:
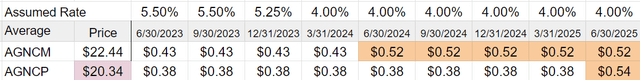
The floating rate on the top (called Assumed Rate) doesn't matter until the boxes below turn orange to indicate floating-rate dividends.
Based on the yields across the Treasury curve, I think using 4% for 2024 is an acceptable choice. In this scenario, over the next two years:
- AGNCM shareholders get $3.80 (using 4%).
- AGNCP shareholders get $3.06.
- That is a spread of $.74.
- The price spread is above $2.00.
That's absurd.
We're going to ignore the fact that you could take the $2.00 of savings and buy Treasuries to get some extra interest. We will just assume you stick it in a bank so the bank can earn extra interest instead of paying you.
Without investing your $2.00, you can match the $.74 in dividends the AGNCM shareholder gets (just withdraw the money) and still have $1.36 left in the account. It doesn't matter much for 1 share. But for 1,000 shares, you'd be talking about an extra $1,360. That's not life-changing money, but it sure beats a poke in the eye!
As you'll notice on the right-hand side, AGNCP gets an extra $.02 per quarter when both shares are floating. If we adjust for the rounding error, AGNCP actually gets an extra $.091 per share per year when they both float.
What Rate Does AGNCM Need to Win?
If short-term rates are above 9.0% for each of AGNCM's floating dividends, then AGNCM almost wins ($1.99 difference in dividends). But if you were going to invest the $2.00 savings in Treasuries, then AGNCM actually needs an even higher floating rate.
If anyone is absolutely convinced short-term rates are going to 9.0%, their portfolio should be 1-month Treasury bills and put options.
I don't believe that will happen. Therefore, I think AGNCM is laughably overvalued relative to AGNCP.
Another Trade
You may have noticed that AGNCO is not completely out of step with AGNCM. The spread between those shares did not break the bell curve. Therefore, as you might imagine, AGNCP is also cheap relative to AGNCO.
When we measure using cash flows, the gap between AGNCO and AGNCP is less extreme than the gap between AGNCM and AGNCP. However, it is still present. Consequently, investors in AGNCO may want to swap for shares of AGNCP.
Current prices:
- AGNCM: $22.44
- AGNCO: $22.50
- AGNCP: $20.34
Note: I currently have no shares of AGNCM. However, I do have some shares of AGNCO. I could use my shares of AGNCO to make this swap. If I see similar prices available for execution in the future, I will probably take the opportunity. Publishing this article might prevent those prices from being available, given the liquidity constraints. However, this is my extremely explicit foreshadowing.
I foreshadowed once in the bullet points, once in the text, and I'll do it again in the disclosure.
If we build the price comparison chart from the perspective of AGNCP, we can see that it is suddenly more than $2.00 below AGNCO and AGNCM:
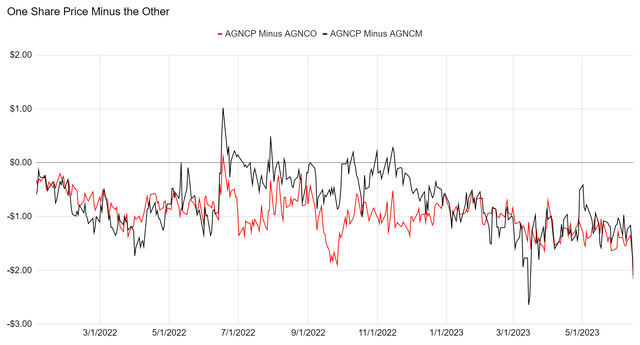
That is an unusually large spread! This is the first time the red line broke below negative $2.00! This is absolutely a market failure. Investors who didn't run all the cash flows are trading on incomplete information. That's great for us. That's usually how we find trading opportunities.
Beware the bid-ask spreads. Usually, they are not too big for the AGNC preferred shares. However, they certainly could spike up. Investors looking to make the trade should check the ask for the shares they want to buy and the bid for the shares they want to sell.
If moving a large number of shares, I find it wise to split the transaction up. That way, I am not entirely out of one share before I start moving into the other.
Again, thank you to our great members for noticing this in real-time and calling it out in chat (after making their trades).
That's the end of our subscriber article, so we'll move on to the charts.
Note: As foreshadowed in the article, on 6/16/2023, I closed out my position in AGNCO at $22.19 and used the proceeds to buy more shares of AGNCP at $20.30. The spread of $1.89 was good enough for me to be quite happy.
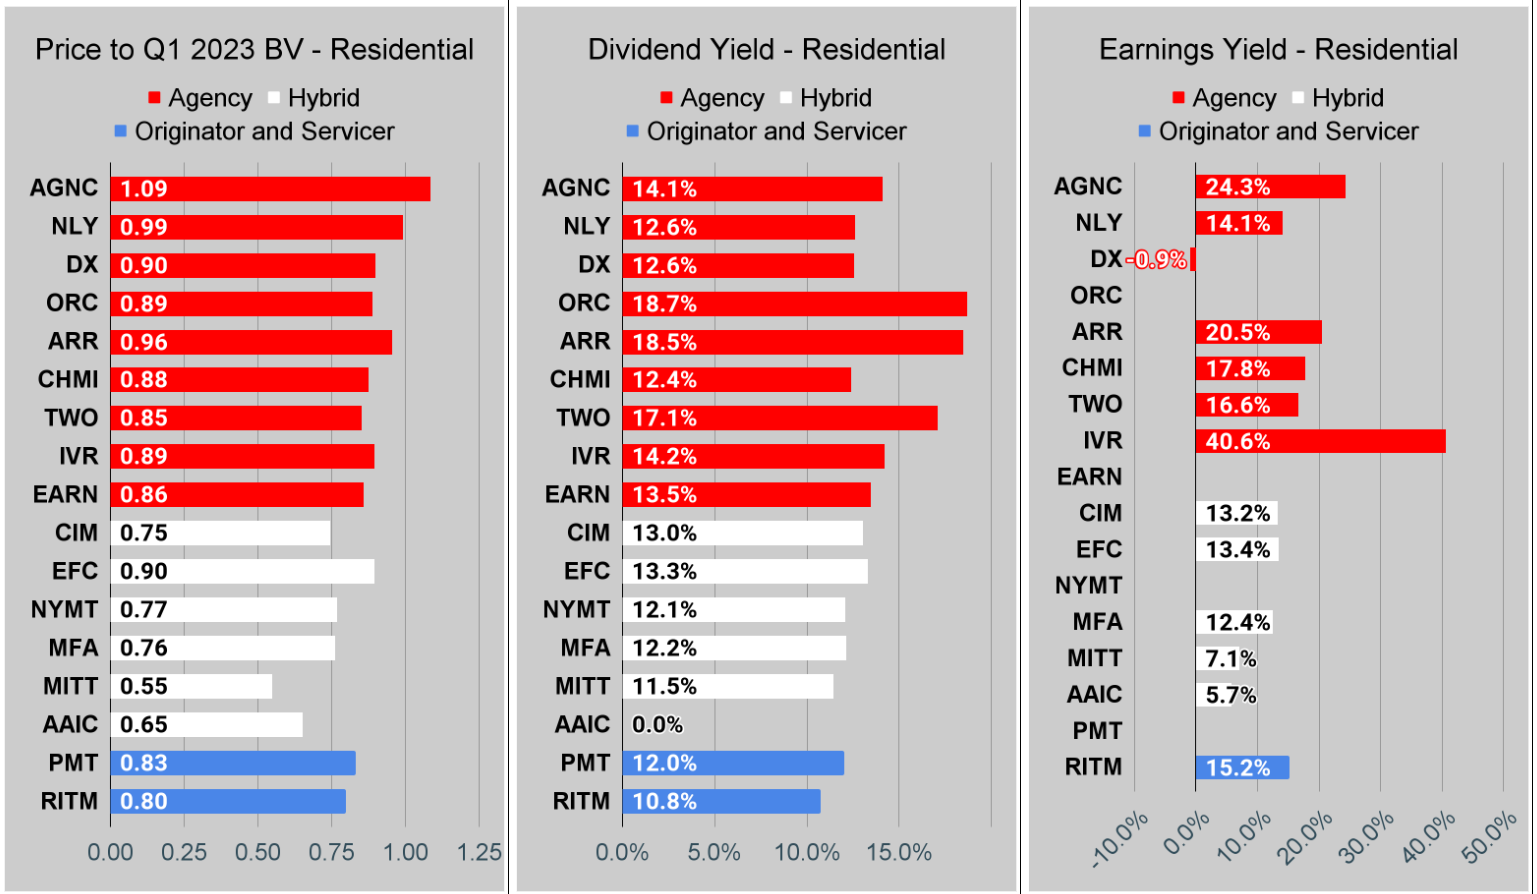
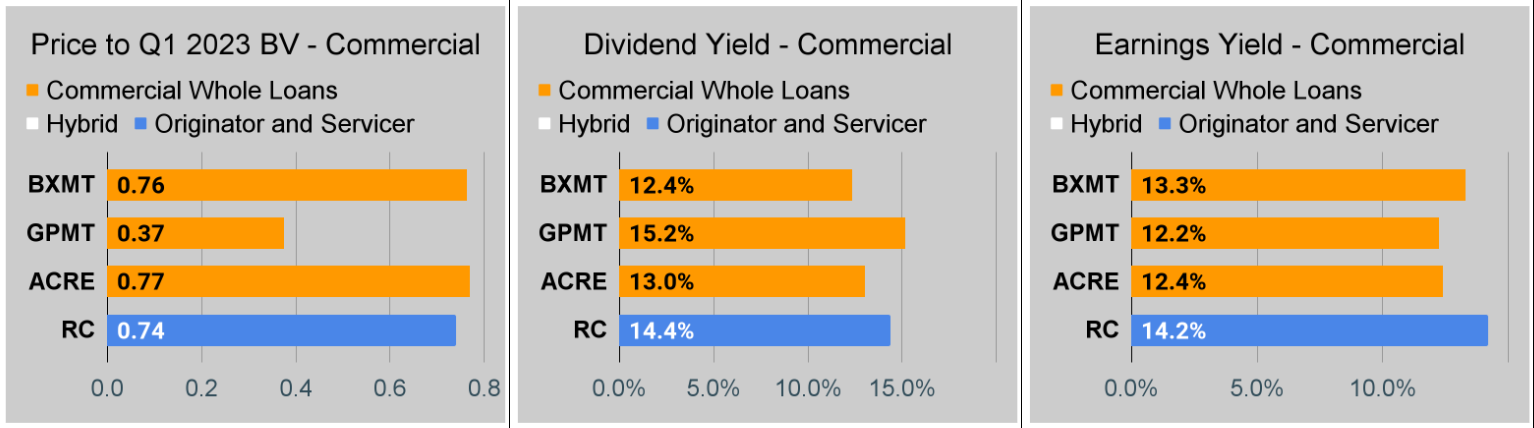
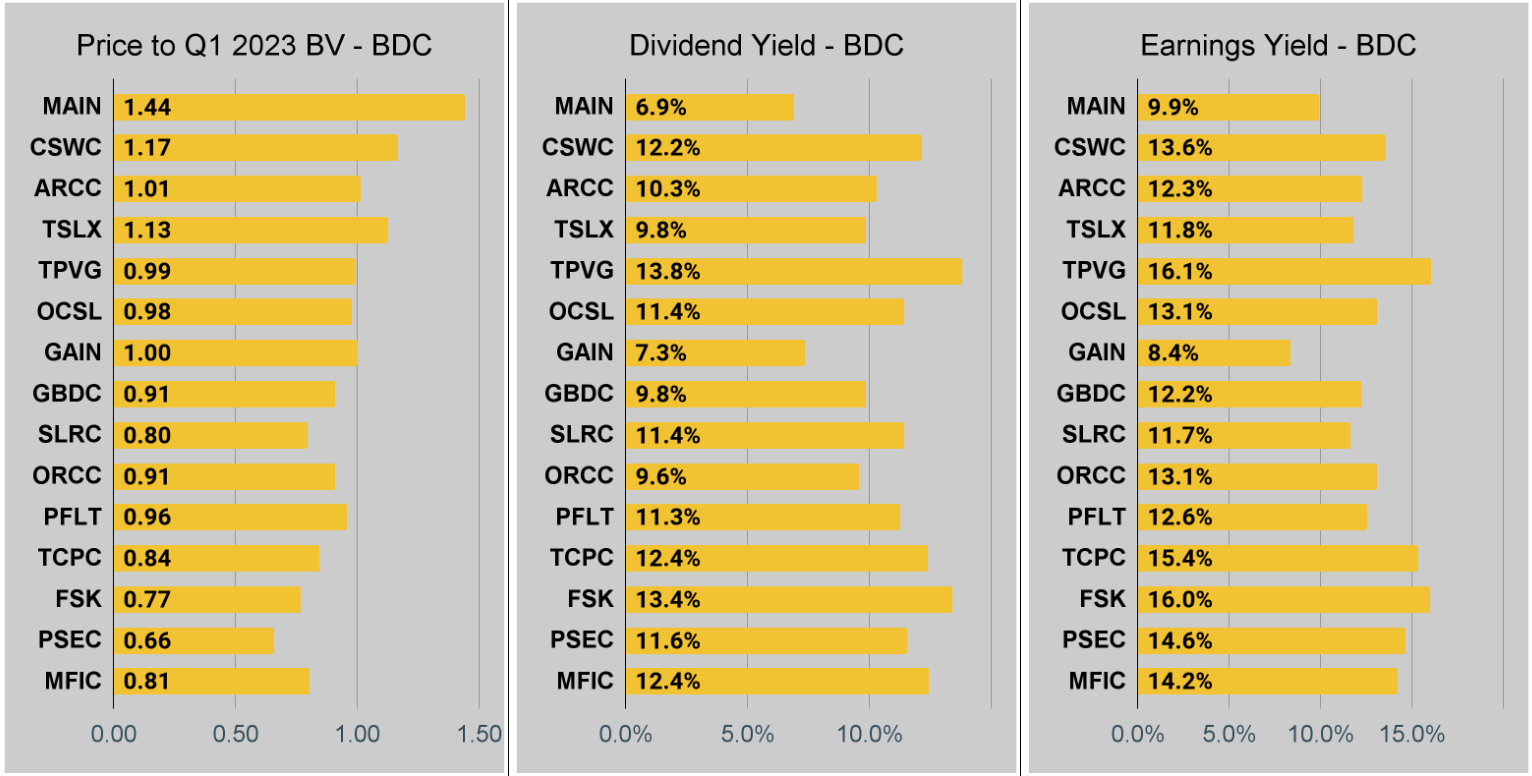
Residential Mortgage REIT Charts
Note: The chart for our public articles uses the book value per share from the latest earnings release.
The current estimated book value per share is used in reaching our targets and trading decisions. It is available in our service, but those estimates are not included in the charts below. PMT and NYMT are not showing an earnings yield metric as neither REIT provides a quarterly “Core EPS” metric. Currently, ORC and EARN do not have a consensus estimate.
Second Note: Due to the way historical amortized cost and hedging is factored into the earnings metrics, it is possible for two mortgage REITs with similar portfolios to post materially different metrics for earnings. I would be very cautious about putting too much emphasis on the consensus analyst estimate (which is used to determine the earnings yield). In particular, throughout late 2022 the earnings metric became less comparable for many REITs. It remains far less relevant today. You can see this clearly by looking at the earnings yield for DX compared to AGNC and IVR. This is one of the weaknesses in how “Core EPS” metrics are designed.
You can click on any of these charts to zoom in. Due to some technical limitations, it has to zoom in all 3 charts for each sector at the same time.
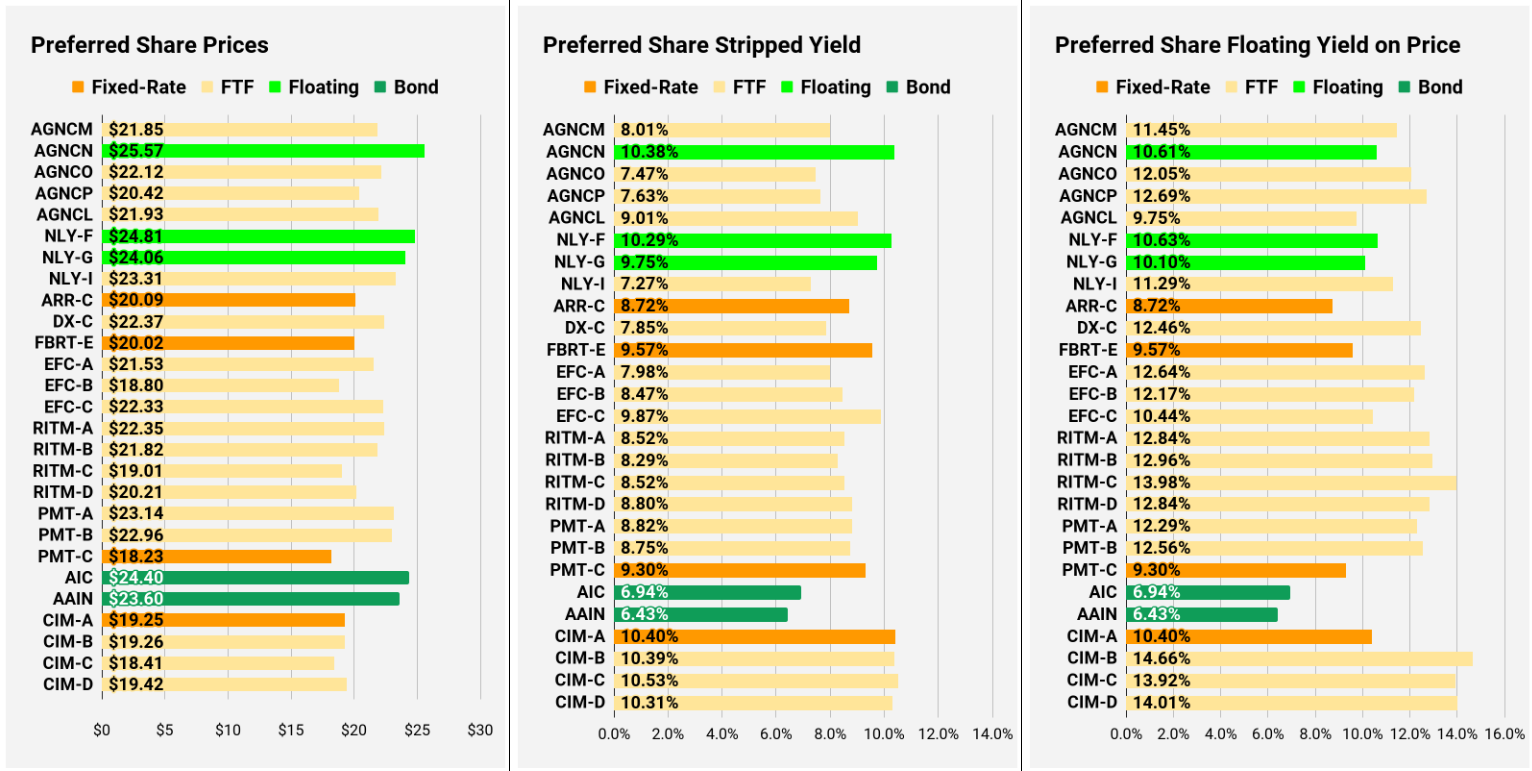
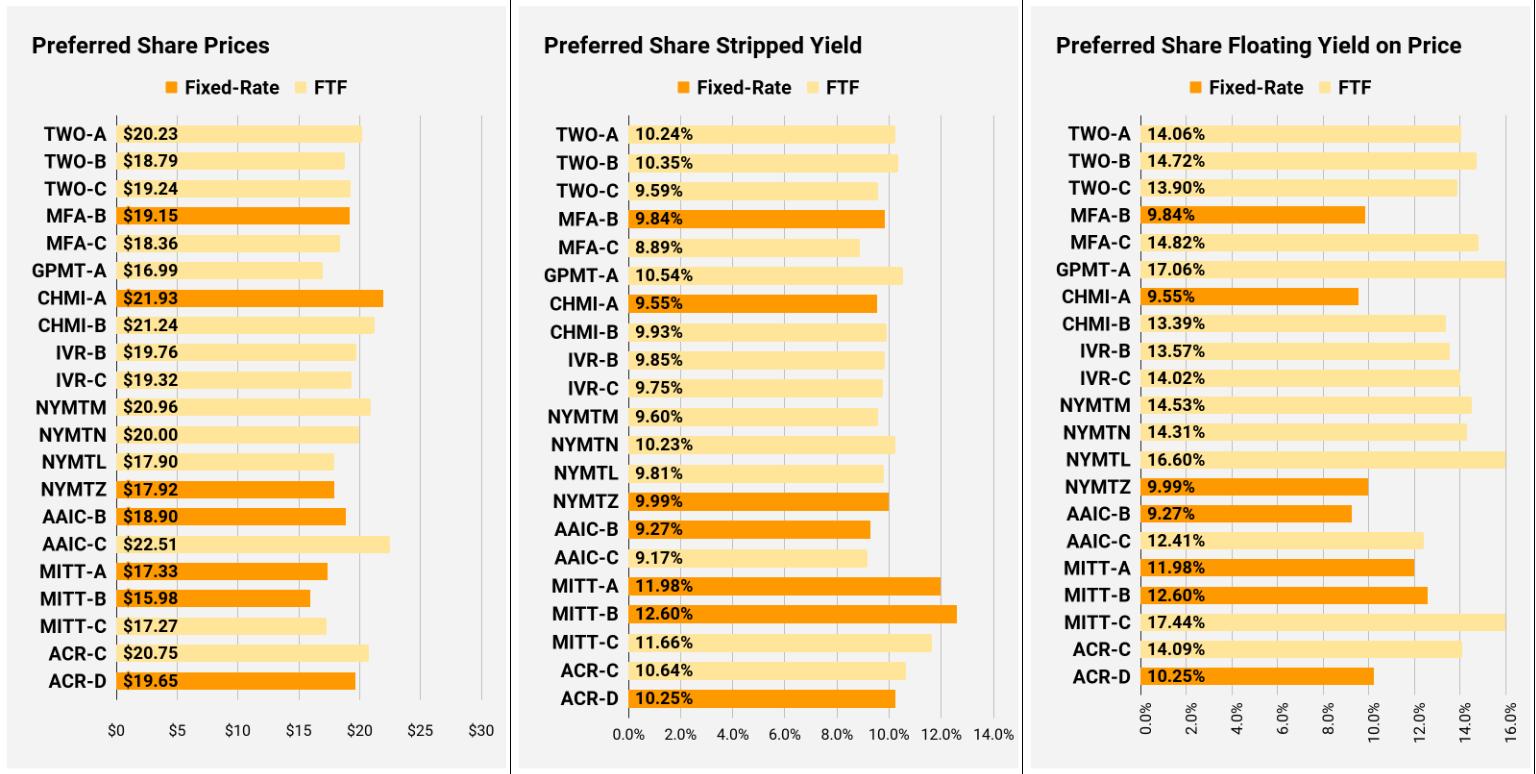
Preferred Share Charts
I changed the coloring a bit. We needed to adjust to include that the first fixed-to-floating shares have transitioned over to floating rates. When a share is already floating, the stripped yield may be different from the “Floating Yield on Price” due to changes in interest rates. For instance, NLY-F already has a floating rate. However, the rate is only reset once per 3 months. The stripped yield is calculated using the upcoming projected dividend payment and the “Floating Yield on Price” is based on where the dividend would be if the rate reset today. In my opinion, for these shares, the “Floating Yield on Price” is clearly the more important metric.
Conclusion
The market doesn’t always do a great job of valuing future cash flows. When you know which metrics to watch and how to model them, you can find a few good opportunities for trading. Even if an investor doesn’t have a position, they will know which share is a better deal if they plan on initiating any positions.
As I’m still learning this platform, there might be features that don’t work optimally. If you notice something that could be improved, please reply to this e-mail or post a comment on the article. Many of the improvements in our article design over the years are the direct result of great ideas from our readers.
Thank you for reading.
Member discussion