
A Guide To WPC’s Change In AFFO Per Share
- Want to learn about comparing AFFO per share figures year-over-year? You’re in the right place.
- Despite being a triple net lease REIT, WPC has some complications in calculating AFFO.
- Looking at the headline metrics such as “lease revenue” investors would expect AFFO per share to have grown.
- The recurring portion of AFFO per share was growing slightly, but several transitory factors came into play.
- Using 2019 as the base year creates an artificially high hurdle since some non-recurring items were favorable in 2019.
We’re taking a deeper dive into W.P. Carey (WPC). We will start with a brief overview, then dive into accounting. Yes, the main topic in this article will be accounting. Why would I write an article about accounting? Readers have indicated they appreciate educational articles. This article won’t teach investors everything they may want to know, but it serves as an example of the way I dig into year-over-year comparisons to evaluate the underlying trend.
Brief Overview
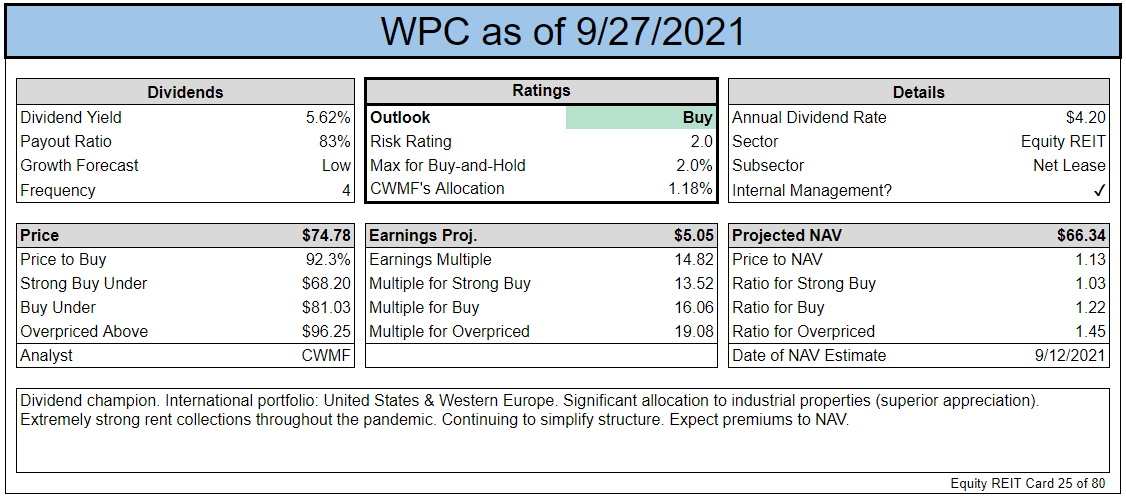
We’ve highlighted WPC as one of the high-quality net lease REITs. They have a long history of growing their dividend on a per-share basis and deserve to be mentioned on any list of the “best of breed” REITs in the triple net lease REIT space. Net lease REITs generally have some of the easier financial statements to interpret. That’s because the nature of a “net lease” passes more of the operating expenses through to the tenant. Consequently, there can be less volatility in the operating margins (revenues minus expenses).
However, investors often become confused about WPC’s AFFO per share. A few months ago, we wrote WPC: A Quick Rebuttal to demonstrate the substantial flaws in work produced by another analyst. That article may be an easier starting point for many readers as it is much broader. We need to stress that WPC has two segments. One is called “Real Estate” and the other is called “Investment Management”. The segment for “Investment Management” is disappearing. This was covered more in the prior article.
In this article, we’re diving into AFFO per share. Specifically, we’re answering: “Why did WPC’s AFFO per share dip in 2020 compared to 2019 when revenues were up and rent collections were extremely strong?”
Isolating Real Estate Values
WPC provides 3 sets of statements. They provide figures for the “consolidated” REIT, which includes both segments. Then they also provide a batch of statements for “Real Estate” and one for “Investment Management”.
Unless otherwise noted, this article will be dealing exclusively with the values for “Real Estate”. All references to “AFFO” with no further description will mean “Real Estate AFFO”.
Links
For anyone who really wants to test themselves on running through the statements, I think compiling the links in one place makes more sense:
- WPC’s 2020 10-K
- WPC’s 2020 Q4 Earnings Release
- WPC’s 2020 Q4 Supplemental
- WPC’s 2019 Q4 Supplemental
- WPC’s 2018 Q4 Supplemental
The Simplified Model
One quick way to get a rough approximation for FFO is to take revenue, subtract operating expenses, general and admin expenses (shortened to G&A), and interest expenses. This will usually get investors pretty close and is nice for creating a quick comparison over time. Investors can evaluate which metrics changed and how much they changed to understand what is impacting the business. However, this simplified model simply doesn’t get close enough for WPC. Even when we strip out the “Investment Management” segment, the estimates would still be off. Had they been close, this would’ve been a much simpler article. However, using the simplified model we could start by saying:
- Lease revenue was up materially
- Other types of revenue were down materially
- G&A was up materially (but far less than lease revenue)
- Property expenses, excluding reimbursable tenant costs was up moderately
- Operating property expenses (which is a separate category to be explained soon) was down
- Interest expense was down materially
At a glance, we would expect the results to be pretty comparable from year-to-year. They were. Using WPC’s metric for “AFFO” (which doesn’t match our definition), the AFFO from their real estate segment was down about 1%. Meanwhile, their diluted shares were up by about 2%. We can understand the diluted shares expanding slightly. That’s pretty normal. The modest decrease in their real estate AFFO for the year deserves deeper inspection.
How Much AFFO?
Since shares expanded by 2%, to have Real Estate AFFO per share remain flat year-over-year, we would need the total for Real Estate AFFO to increase by 2% rather than decrease by 1%. That means the REIT would’ve needed about $24,335 more in Real Estate AFFO than they reported. We need to assess why that didn’t happen.
Reporting in Thousands
For simplicity, all values in the tables will be represented in thousands of dollars except for “per share” amounts.
Deeper Dive on Revenue
We regularly start with the top line for equity REITs. We want to understand what changed in revenue. There are three different types of revenue feeding into “Total Revenue”:
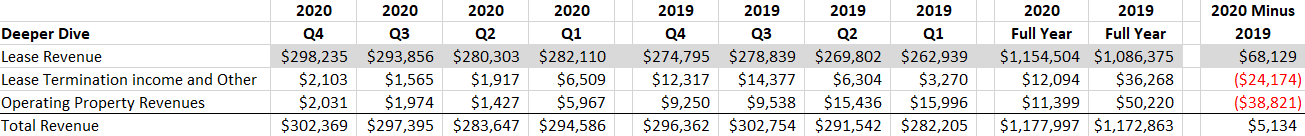
Source: Author’s spreadsheet, WPC supplemental for 2020 and 2019
Note: Clicking the image provides a zoomed-in view in a new tab.
We built the sheet with the quarterly figures and then added them up to reach the full year figures. In hindsight, this would’ve been much faster if we just started with the full-year figures. We’ve highlighted “Lease Revenue” since it should be the main factor. However, we can see that the other two metrics declined materially. Consequently, total revenue was only slightly higher. So what happened? The first metric that changed is “Lease Termination Income and Other”. Rather than asking why the value is so low in 2020, we should be asking why the value was so high in 2019. That category only totaled $6,555 in 2018, which is a little more than half of the $11,399 reported for 2020. It was 2019 when the exceptionally high $36,268 was reported. So what went into that? Was it all lease termination income ? No, it wasn’t. However, that doesn’t mean it was a recurring source of revenue either.
WPC’s 2020 10-K explains (page 83):

Note: Clicking the image provides a zoomed-in view in a new tab.
To put those items into a table (listing in millions, though our tables are in thousands):$9.1 million from a bankruptcy claim
$8.8 million from a lease restructuring where $6.6 million had previously been considered uncollectible (excluded from revenue)
$2.2 million from a tax refund
$6.2 million from lease termination and restructuring
$3.5 million from a parking garage (sounds recurring)
That doesn’t cover the entire $36 million, unless the $8.8 million and the $6.6 million are actually separate amounts. However, it does get us pretty close. This brings us to the concept of recurring. It’s normal for a landlord as large as WPC to have some amount of these non-recurring cash flows coming in each year, but they will be quite volatile. Since these forms of revenue are not removed in WPC’s calculation of AFFO per share, they make the value a bit more “lumpy”. This one category alone saw a difference accounting for nearly $24,174, which would nearly cover the entire $24,335 needed to keep Real Estate AFFO per share flat year-over-year. By itself, this suggests that we shouldn’t be too concerned about the apparent “drop” in WPC’s Real Estate AFFO year-over-year. However, we already put in the work to run the comparison further.
It’s important for investors to recognize that this category is not exclusively lease termination revenue. Exceptionally high values for lease termination revenue would be a red flag. Winning a claim against a tenant that was already bankrupt is positive. Winning a tax refund is positive. Those metrics aren’t regularly recurring, but they are still a nice little benefit for shareholders. Revenue from owning a parking garage is recurring and certainly positive for shareholders. Yet, we don’t want to treat the entire category as if it is recurring cash flows.
Operating Property Revenues and Operating Property Expenses
We saw a huge decline in “Operating Property Revenues” to the tune of $38,821. Likewise, we saw “Operating Property Expenses” (shown in the expenses sections, below) decrease by $28,114. What happened there?
WPC converted some self-storage operating properties into net lease properties (revenue moved to “Lease Revenue”) starting June 1st, 2019. That means it counted as “Operating Property Revenues” during 5 months of 2019.
WPC disposed of one of their two hotel properties during Q1 2020 (the best quarter of 2020 for a sale). That removes 3 quarters of hotel results.
WPC’s one remaining hotel property saw reduced activity due to the pandemic.
We can be glad WPC dropped one of their hotels before the pandemic and we shouldn’t be surprised that the remaining hotel contributed substantially less during 2020 than during 2019. Further, the hotel that was open saw revenues fall more than expenses (no surprise, it was a hotel during a pandemic) so the contribution to AFFO was reduced in a leveraged manner. There would be a viable case for separating the “Operating Property” category (revenues and expenses) into their own segment and having “Net Lease AFFO” and “Operating Property AFFO”. However, with only one hotel left, it doesn’t really make sense to give it an entire segment. However, the amount contributed by this segment (revenues net of expenses) decreased by about $10,707. This is another candidate for explaining why “Real Estate AFFO” did not increase.
Operating Expenses
We’re moving on to the operating expenses:
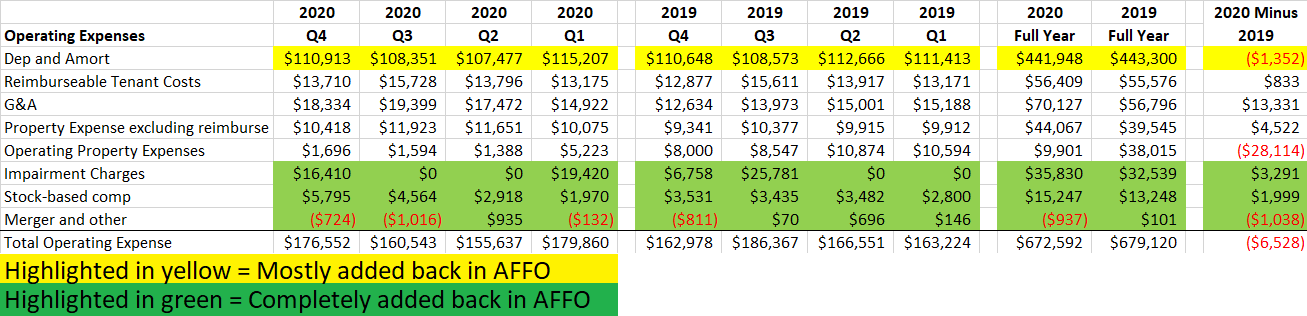
Source: Author’s spreadsheet, WPC supplemental for 2020 and 2019
Note: Clicking the image provides a zoomed-in view in a new tab.
We can see that “Operating Property Expenses” decreased by $28,114. However, we already talked about that.
Reimbursable Tenant Costs increased by $833, but that’s pretty much a rounding error.
The “Property Expense Excluding Reimbursable Tenant Costs” (which had a shortened title) increased by $4,522. That’s slightly material, but only slightly and it looks standard for the pandemic.
The category that actually matters is G&A. How did G&A expenses increase by $13,331 in a year? Well, breaking it down by quarters we can see that it was roughly in line with prior values for Q1 2020. So the increase is really the next 3 quarters. What changed? One of WPC’s disclosures answers that question:
Beginning with the second quarter of 2020, general and administrative expenses attributed to our Investment Management segment are comprised of the incremental costs of providing services to the Managed Programs, which are fully reimbursed by those funds (resulting in no net expense for us). All other general and administrative expenses are attributed to our Real Estate segment. In addition, beginning with the second quarter of 2020, stock-based compensation expense and depreciation and amortization expense are fully recognized within our Real Estate segment.
WPC modified their accounting for some expenses to record the expense as part of their “Real Estate” segment rather than the “Investment Management” segment. This is particularly relevant because shifting these expenses results in a materially higher G&A expense attributed to the “Real Estate” segment. This is a negative factor as it was reasonable before to believe more of these G&A expenses would fall off with the “Investment Management” segment, rather than being shifted into the “Real Estate” segment.
Other Income and Expenses
Most of this section is irrelevant because the values are mostly or entirely added back in AFFO calculations:
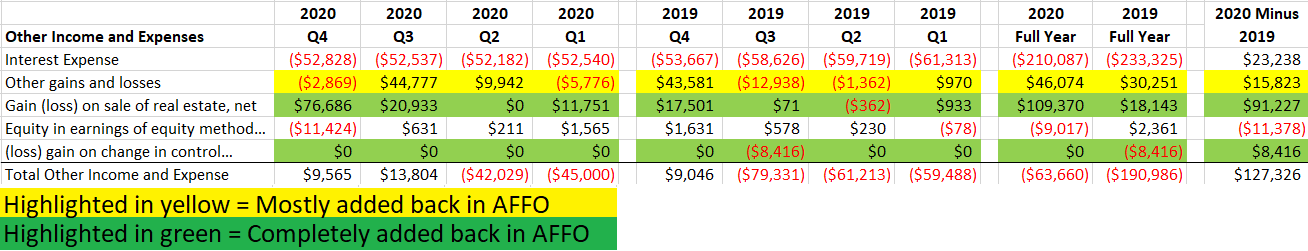
Source: Author’s spreadsheet, WPC supplemental for 2020 and 2019
Note: Clicking the image provides a zoomed-in view in a new tab.
The relevant category to highlight here is the interest expense. This decreased by $23,238 year-over-year, which is excellent. That’s a recurring savings for shareholders of WPC. could also be seen as mostly offsetting the reduction in “Operating Property” contribution and increased G&A. However, the “Operating Property” contribution should be better for future periods and are already showing improvements. G&A is not showing improvements and has trended slightly higher, though their Q1 expense is usually elevated by timing of payroll taxes.
Review
Total revenues were only slightly higher, even though leasing revenues were up substantially.
If we had normalized for “Lease Termination and Other Income” the increase in revenue year-over-year would’ve been enough to roughly cover the additional Real Estate AFFO needed to keep the value steady for Real Estate AFFO per share. Results were further weighed down by the “Operating Property” category which was weaker because of the pandemic impacting their one remaining hotel, the sale of another hotel, and converting storage properties into a net lease. Further, G&A has been elevated as costs were shifted over from the “Investment Management” segment. These two areas of weakness were roughly offset by lower interest expense.
However, we really want AFFO per share to grow, not merely remain flat. We know WPC includes escalators in their leases which was driving increased leasing revenue. So what other factors were weighing against the REIT?
Above / Below Market Rent and Straight Line Adjustments
These adjustments exist to mitigate the difference between reported revenues and cash collected. The revenue line item is impacted by these categories and one of the factors which allowed “Leasing Revenues” to increase so dramatically year-over-year was a shift in the amount recorded relating to straight-line rents and the amortization for above/below market leases. Put simply, part of the extreme growth in revenue was driven by these accounting requirements. If we strip them out, the growth in leasing revenue would’ve been smaller and the net result would’ve been a reduction in total revenue. However, demonstrating these adjustments simply feels weird. This is a problem with the way the income statement is laid out. It would make so much more sense if we could see the adjustments as part of revenue. So how about an alternative model to break them out?
An Alternative Model
To further simplify the income statement, we can change which metrics are grouped together. In this next image, I reorganized the income statement to emphasize the values that are not stripped out in AFFO. Further, I’ve reduced the columns to only show the change in the value from year to year. If a change is favorable to AFFO, it is shown in black (positive). If a change reduces AFFO, it is shown as a negative number. I believe this is a more intuitive way to display year-over-year comparisons, but it is a bit of a slow process since it requires rebuilding the entire income statements and reconciliation tables for both years to create the table:
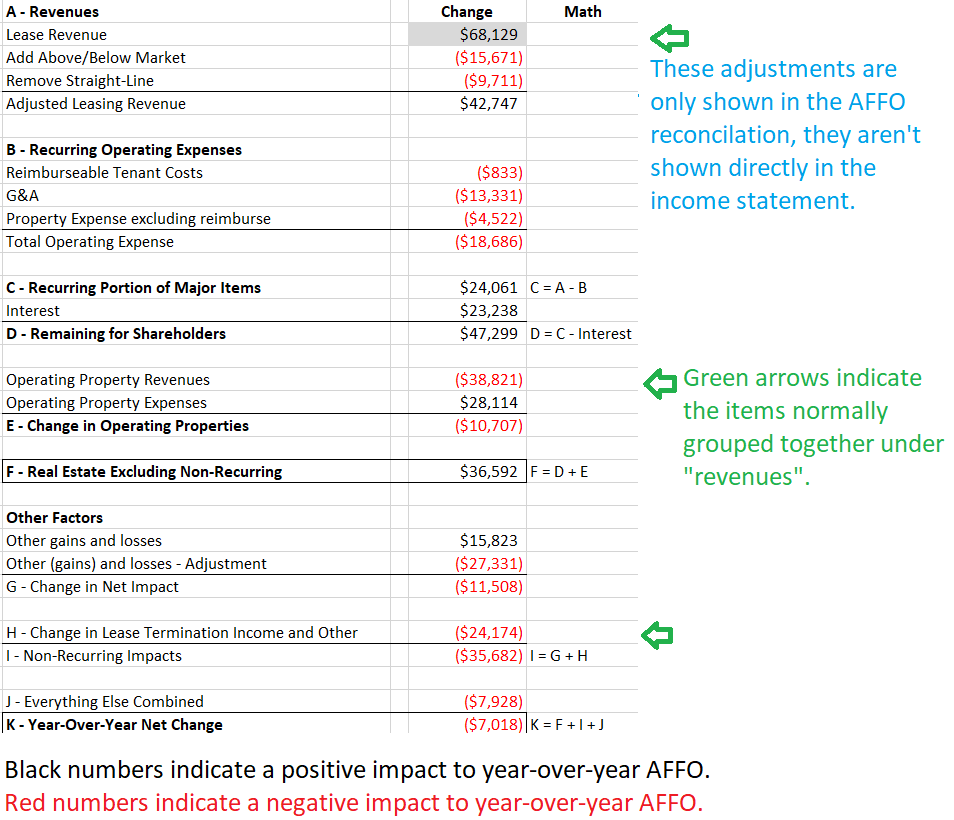
Source: Author’s spreadsheet, WPC supplemental for 2020 and 2019
Note: Clicking the image provides a zoomed-in view in a new tab.
When we break it down this way, we can see that there was actually solid growth in the major recurring values. We separated out the impact for “Change in Operating Properties” because part of that is recurring (they own fewer operating properties) and part is the impact of the pandemic. The value I find most important in this category is “F - Real Estate Excluding Non-Recurring”. We wanted to see that value grow by more than $24,335. It did, as it was up $36,592 year-over-year despite the reclassification of some G&A expenses into the segment.
Putting it Together
To see WPC keep Real Estate AFFO per share flat during the pandemic, they needed to have an increase of $24,335. If we simply stripped out “Lease Termination Income and Other” from the values for both years, it would roughly cover that amount (about 99%). Several other categories also provided modest negative impacts including the timing of changes to accounting policies, the pandemic, and even volatility in the difference between “Other gains and losses” and the value added back for that category in calculating AFFO. How do we handle those things? Expect some volatility in those categories from year to year. While we like to see growth in cash flows available to shareholders, we put far greater emphasis on the recurring cash flows. When we strip out those transitory factors, we see a REIT which maintained slight growth (in recurring values) during the most difficult year in over a decade.
If you enjoyed this article and aren’t already getting our work by e-mail, please subscribe to get these articles delivered to your e-mail.
Member discussion