
A Clear Pricing Failure: NYMTL vs. NYMTN
I want to share something from our recent Portfolio Update. Over the weekend, I wrote:
NYMTN (NYMTN) at $19.41 is $2.00 more than NYMTL (NYMTL) at $17.41. That’s crazy. No way there should be a gap that large. Not even close. Investors should sell NYMTN to buy NYMTL if they can get a spread near $2.00.
Since writing that, shares of NYMTN climbed 2.11% to $19.82, and shares of NYMTL climbed 3.39% to $18.00.
That leaves a gap of $1.82. It is smaller than $2.00, but only modestly smaller.
Given these prices, let’s go over why NYMTL is a materially better deal than NYMTN.
We can do that with a table comparing the four preferred shares for New York Mortgage Trust (NYMT):
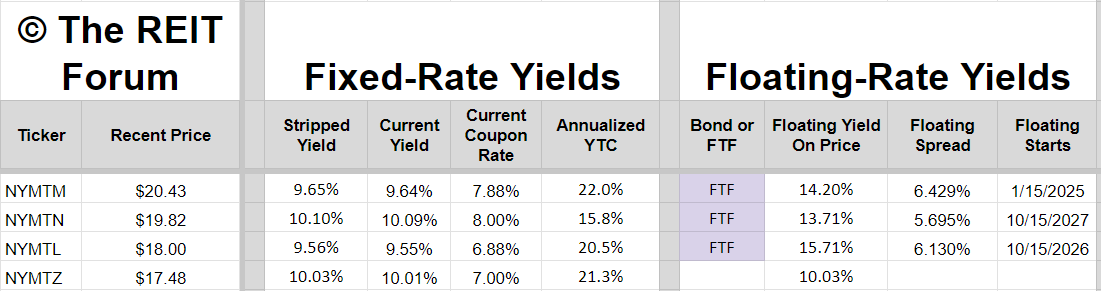
NYMTN has a bigger yield today. The investor in NYMTN gets an extra $.28 per share per year, while both shares have a fixed dividend rate.
That comes out to $.07 per quarter. There are 14 quarters left before NYMTL begins floating. Therefore, that spread is only relevant for 14 quarters. That is a gap of about $.98.
However, the investor in NYMTL saves $1.82 per share. That value can still be invested as they see fit. They could buy some Treasuries for the next few years if nothing else.
NYMTL will miss out on $.98 in dividend income over 14 quarters. We’ll just ignore that NYMTL actually recovers part of the difference from investing the savings of $1.82. If the investor refuses to buy a short-term Treasury ETF or use a savings account to generate any yield on their $1.82 of savings, NYMTL would still be ahead by $.84 (from the lower share price) when NYMTL begins floating on 10/15/2026.
The dividend rate will increase if short-term rates are above 0.755% when floating begins. If short-term rates are below 0.755%, the dividend rate will decrease. However, since the United States does not go to negative rates, the downside in yield is pretty small. That’s a pretty good chance for a dividend increase, which could enable NYMTL to produce more dividends than NYMTN from 10/15/2026 to 10/15/2027.
Either way, starting on 10/15/2027, NYMTN will also float.
When both shares float, NYMTL should pay out more than NYMTN by a margin of $.10875 per share per year.
Math: $25 * (6.13% - 5.695%) = $.10875.
NYMTL uses SOFR. NYMTN will need to convert from using LIBOR. If there is an adjustment for the difference between LIBOR and SOFR, it would most likely be pretty small. Therefore, NYMTL would still have the bigger dividend rate when both float.
Therefore, the investor in NYMTL would save $1.82 per share today. If that is put in a short-term treasury ETF, the investor has removed 9.18% of their risk. However, they have a superior position. NYMTN’s higher fixed-rate dividend will never come close to making up for the difference in the share price.
Whether you feel comfortable investing in the NYMT preferred shares is an entirely different topic. I don’t expect them to go under, but they are one of the higher-risk shares we cover.
The point here is that investors in NYMTL are simply getting a much better deal than investors in NYMTN because of the difference in the share price.
Since NYMTL is still ahead by $.84 on 10/15/2026 and there is only one year where NYMTL floats and NYMTN does not, NYMTL would need to lose by $.84 in one year (from 10/15/2026 to 10/15/2027).
For NYMTL to lose, it would require a dividend rate of $1.16 for the first year of floating.
$1.16 would be a 4.64% dividend rate on the $25 face value. Since the spread is 6.13%, it would require short-term rates to be negative 1.49%. That isn’t a realistic scenario.
Therefore, we have a market failure.
Below you will find the charts we would often publish on Seeking Alpha.
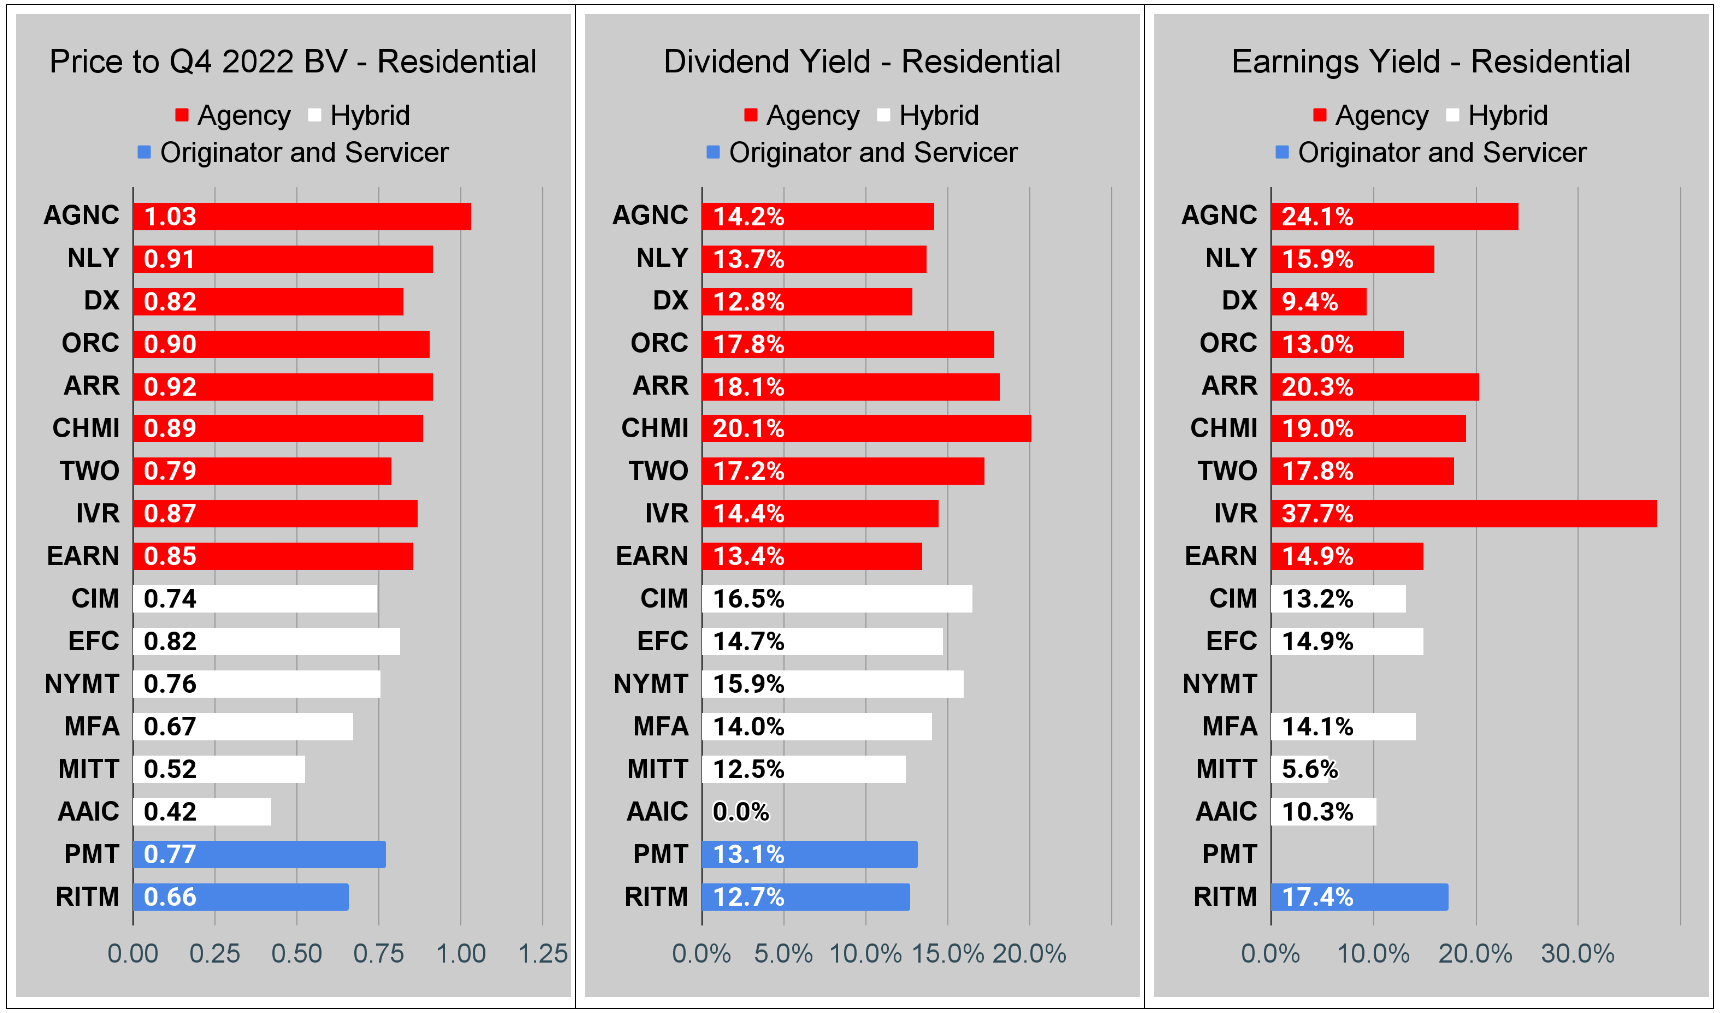
Residential Mortgage REIT Charts
Note: The chart for our public articles uses the book value per share from the latest earnings release.
The current estimated book value per share is used in reaching our targets and trading decisions. It is available in our service, but those estimates are not included in the charts below. PMT and NYMT are not showing an earnings yield metric as neither REIT provides a quarterly “Core EPS” metric.
Second Note: Due to the way historical amortized cost and hedging is factored into the earnings metrics, it is possible for two mortgage REITs with similar portfolios to post materially different metrics for earnings. I would be very cautious about putting too much emphasis on the consensus analyst estimate (which is used to determine the earnings yield). In particular, throughout late 2022 the earnings metric became less comparable for many REITs. It remains far less relevant today. You can see this clearly by looking at the earnings yield for DX compared to AGNC and IVR. This is one of the weaknesses in how “Core EPS” metrics are designed.
You can click on any of these charts to zoom in. Due to some technical limitations, it has to zoom in all 3 charts for each sector at the same time.
Finally, I want to remind investors that there have been some material swings in book value per share during Q1 2023. The discounts shown here use the trailing book value from 12/31/2022 and use the share price as of 04/04/2023.
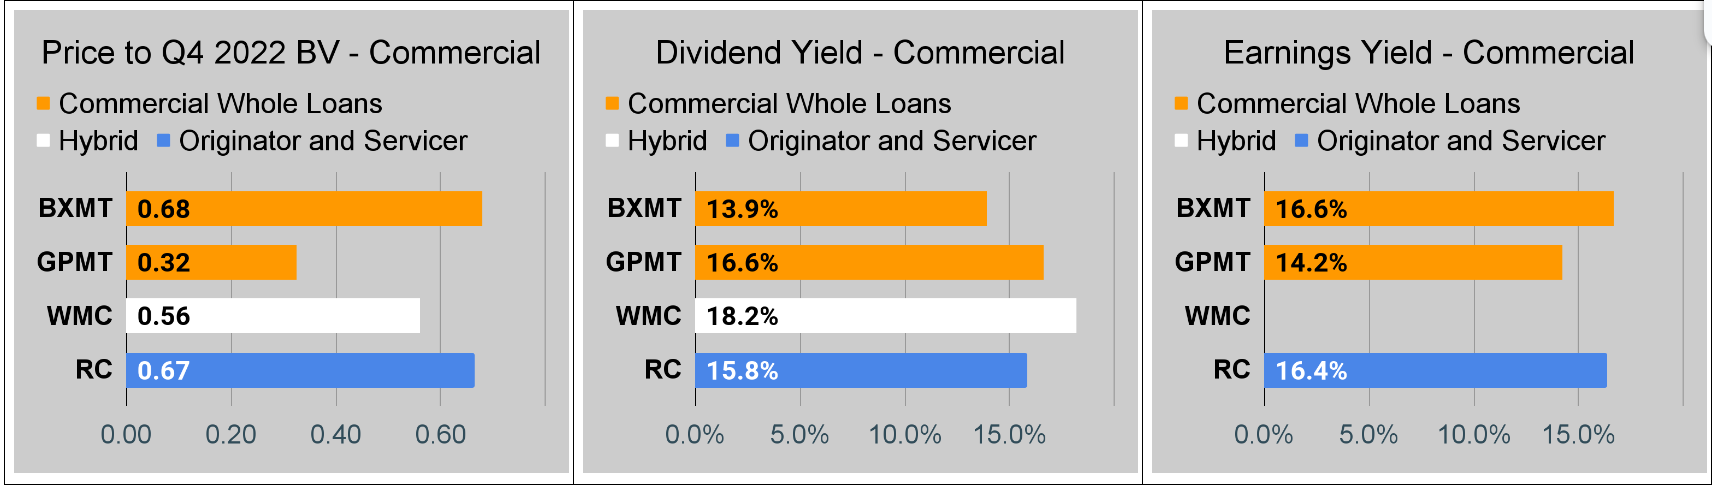
Commercial Mortgage REIT Charts
BDC Charts

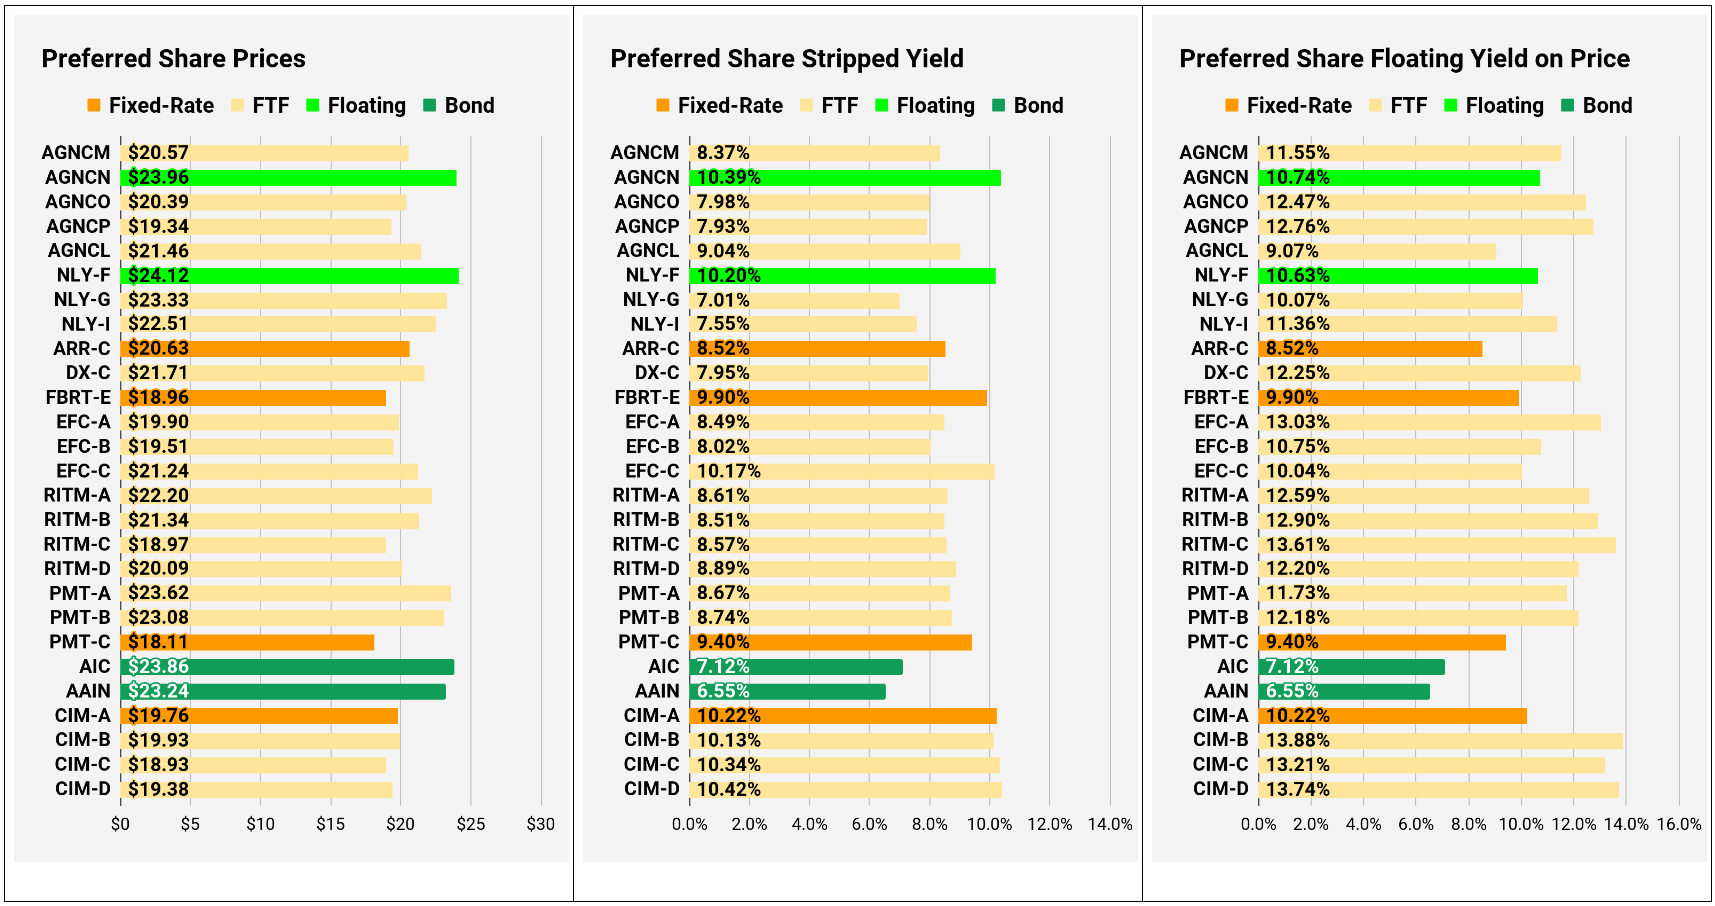
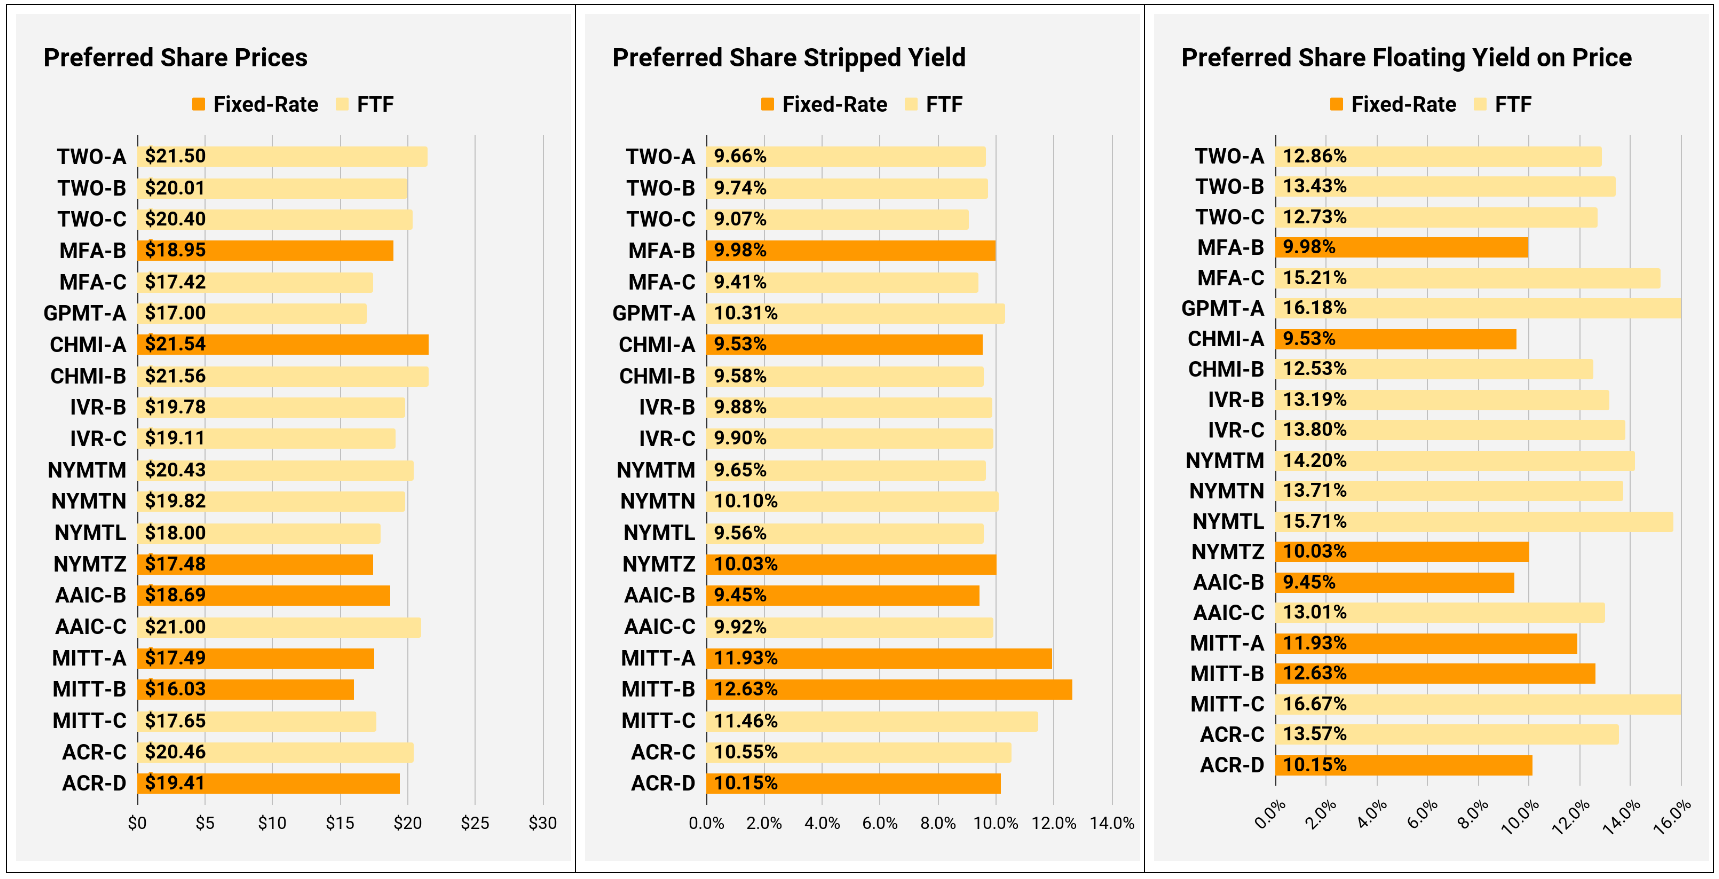
Preferred Share Charts
Conclusion
Thank you for reading. The volume of articles on this site should increase significantly throughout the next few months. Please excuse any strange formatting, as it may take a few articles to get familiar with the updates to how this site works.
If you enjoy our articles, please subscribe and share a link with your investing friends. Your email address is never sold and never shared. The only e-mails you will get are the ones I send out on this platform.
Member discussion