ADC Q2 2024 Update & NAV Model

Summary
- ADC reported solid quarterly results with no negative surprises.
- Raised guidance on AFFO per share, acquisitions, and dispositions, indicating confidence in growth.
- Wall Street estimates for NAV may be significantly off, potentially enhancing ADC's ability to achieve a large premium which has been used to fuel AFFO per share growth.
- I'm demonstrating the model for using NAV figures to calculate cap rates. We can use any NAV figure and find the implied cap rate.
- No change to targets currently. May adjust with sector peers soon.
Article Starts
Agree Realty (ADC) reported Q2 2024 earnings yesterday.
ADC’s results were good. Solid quarter. Nothing bad.
ADC is a net lease REIT. Their results tend to be quite predictable because they are extremely consistent. That’s common for most net lease REITs. The business model requires tenants to reimburse for most operating expenses. Even if the REIT records property expenses, they are reimbursed for them. Consequently, it doesn’t have any material impact on NOI (Net Operating Income). That means we usually get to have easy updates.
ADC raised guidance on three metrics.
AFFO per share:
- Old guidance: $4.10 to $4.13. Midpoint $4.115.
- New guidance: $4.11 to $4.14. Midpoint: $4.125
Acquisitions:
- Old guidance: Approximately $600 million
- New guidance: Approximately $700 million
Dispositions:
- Old guidance: $50 to $100 million
- New guidance: $60 to $100 million
The first two (AFFO per share and acquisitions) are at least moderately connected. The disposition adjustment is too small to matter.
This brings up two things I want readers to know:
- Acquisitions are significantly accretive for ADC.
- Wall Street’s figures understate the accretive impact because Wall St. is overstating NAV (Net Asset Value).
Funding Acquisitions
To fund acquisitions, ADC issued $450 million of debt at 5.625% due in 2034 and $194.5 million of equity.
Don’t expect that ratio to last. ADC generally uses more equity than debt in their capital structure. If they used more debt, they would have a higher risk rating.
We’re not going to focus on the exact breakdown of debt and equity at the moment.
While the debt had a 5.625% coupon rate, that isn’t the effective cost to the REIT. The effective cost is usually a bit higher because of various discounts.
We’re keeping values in millions, so beware the strange decimal place.
$450 million times 5.625% = $25.3125 million per year.
Net proceeds to ADC were $441.7965 million.
Therefore, the cost to ADC comes to 5.73%. Yeah, it’s similar to 5.625%, but being imprecise is annoying.
Note: The difference between 5.73% and 5.625% will flow through accretion. It is a real cost, but some investors ignore it because math is hard for them.
Acquisitions
Management appears to concur with our evaluation of acquisitions as significantly accretive.
In the CEO’s comments, he said:
“Our growing pipelines across all three external growth platforms give us confidence to increase our full-year acquisition guidance to approximately $700 million. Given accelerating investment activity and the strong performance of our portfolio year-to-date, we are raising our 2024 AFFO per share guidance to a range of $4.11 to $4.14, reflecting 4.4% growth at the midpoint."
Notice that these elements are linked. The accelerating investment activity is one of the two factors driving the increase in guidance.
During Q2:
- ADC spent $185.8 million on acquisitions with an average cap rate of 7.7%.
- Weighted-average lease-term for acquisitions was 9.3 years. Better (longer) than in Q1.
- About 59.1% of annualized base rent was from investment grade tenants. Lower (worse) than in Q1.
The difference in lease term and percentage from investment grade tenants basically offset. I’ll consider the acquisition quality to be similar.
During Q1 (for comparison):
- ADC spent $123.5 million on acquisitions with an average cap rate of 7.7%.
- Weighted-average lease-term was 8.2 years.
- About 64% of annualized base rent was from investment grade tenants.
Those acquisitions should be materially accretive.
Whether they were funded with debt or equity, they would still show up as accretive.
Note: The cap rates here are actually a bit messed up. ADC quotes an average cap rate of 7.7% in each quarter. However, their 10-Q disclosure on page 32 indicates that “weighted-average capitalization rates” for acquisitions and dispositions are calculated using a straight-line basis. However, in the real world, cap rates are supposed to be calculated on cash NOI rather than straight-line NOI. GAAP should mandate that companies provide both, but mandating transparency isn’t popular.
Using the earnings call, management referenced a “mid-7s cash” rate. Based on typical net lease escalators being around 1%, that sounds right to me. The cash cap rates were probably closer to 7.4% than than 7.7%.
Issuing Shares
Shares were issued through ADC’s forward sale agreements. The company is essentially locking in the future price for issuing shares. They can go to buy properties and already know the amount they will get when they issue the shares. They could just issue the shares in advance, but using the forward sale agreement can line up the increase in shares with the increase in real estate. If they waited until they had the real estate under contract to issue shares, they could be forced to issue at a bad price. Consequently, waiting to issue shares would not be great.
There were 3,235,964 shares issued and the net proceeds are $194,493,951. Don’t bother using the rounded numbers from the top of the press release. The rounding on those numbers create less accurate calculations.
The resulting weighted average net price was about $60.10 per share.
How much does it cost ADC to increase their outstanding share base?
If we consider the cost in terms of AFFO per share (one viable system), we would say it costs about 6.85%.
I am using $4.12 for AFFO. That is very close to the middle of full year guidance and it matches the consensus AFFO per share forward estimates from prior to this earnings release.
Dividing $4.12 for AFFO per share by a net price of $60.10 gives us an AFFO yield of 6.85%.
Dividend Yields
If I start talking about yields while skipping over dividend yields, some investors might get pretty annoyed. Therefore, I’ll cover the dividend yields first.
The shares are $67.85 today.
The dividend is $.25 per share per month.
That comes out to $3.00 per share annually.
Therefore, shares have about a 4.4% dividend yield today.
When ADC was issuing shares at a net price of $60.10, the effective dividend yield was 4.99%.
Accretive Impact of Acquisitions on AFFO per share
Using an AFFO yield of 6.85% based on the issuance price ($4.12 / $60.10).
ADC also issued debt with an effective cost of 5.73%.
Each of those figures is less than the 7.7% cap rate on acquisitions. Notice that 7.7% is higher than either of the other numbers.
Assuming overhead doesn’t balloon (which it shouldn’t), we can easily say that these acquisitions would be accretive to AFFO per share regardless of how they were funded.
I could calculate out the exact accretive impact based on some arbitrary split between debt and equity funding.
Perhaps another time. I have quite a few models set up, but that isn’t one of them. I don’t want to prepare a new model in the middle of the earnings season.
NAV Per Share
This is where I’m spending the time instead of using it to find the impact on AFFO per share.
Consensus NAV per share for ADC appears to be wrong.
Does it really matter? Well, who cares? This is the interesting part.
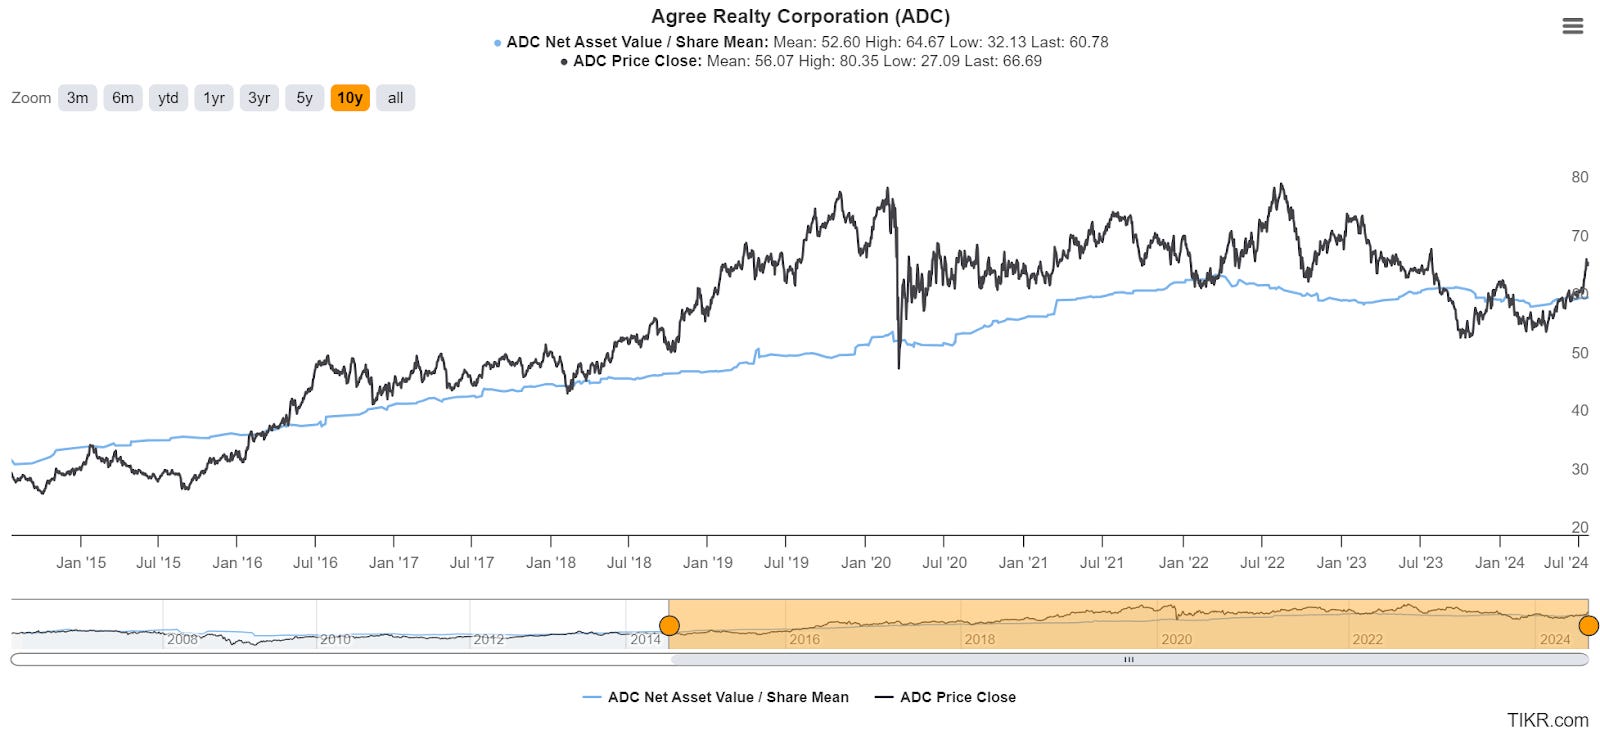
The chart for consensus NAV and share price have a similar trend line if you zoom out far enough, but the correlation in shorter periods is horribly low.

Source: TIKR.com
Even though the NAV and share price are not heavily correlated in this case, it’s useful to understand how Wall Street could be messing up.
There’s one particularly challenging thing about calculating NAV for ADC: There are constantly acquisitions!
Because there are new acquisitions, we can’t just use the trailing net operating income and adjust it for growth. We also have to adjust it for acquisitions.
Because ADC acquires so many small properties, I think it is reasonable to assume (unless informed otherwise) that the transactions were about evenly spaced during the quarter.
Therefore, we will assume that ADC collected about 45 days of rent across all acquisitions for the quarter.
It won’t be precisely accurate, but it will probably be quite close.
Wall Street Estimates for NAV
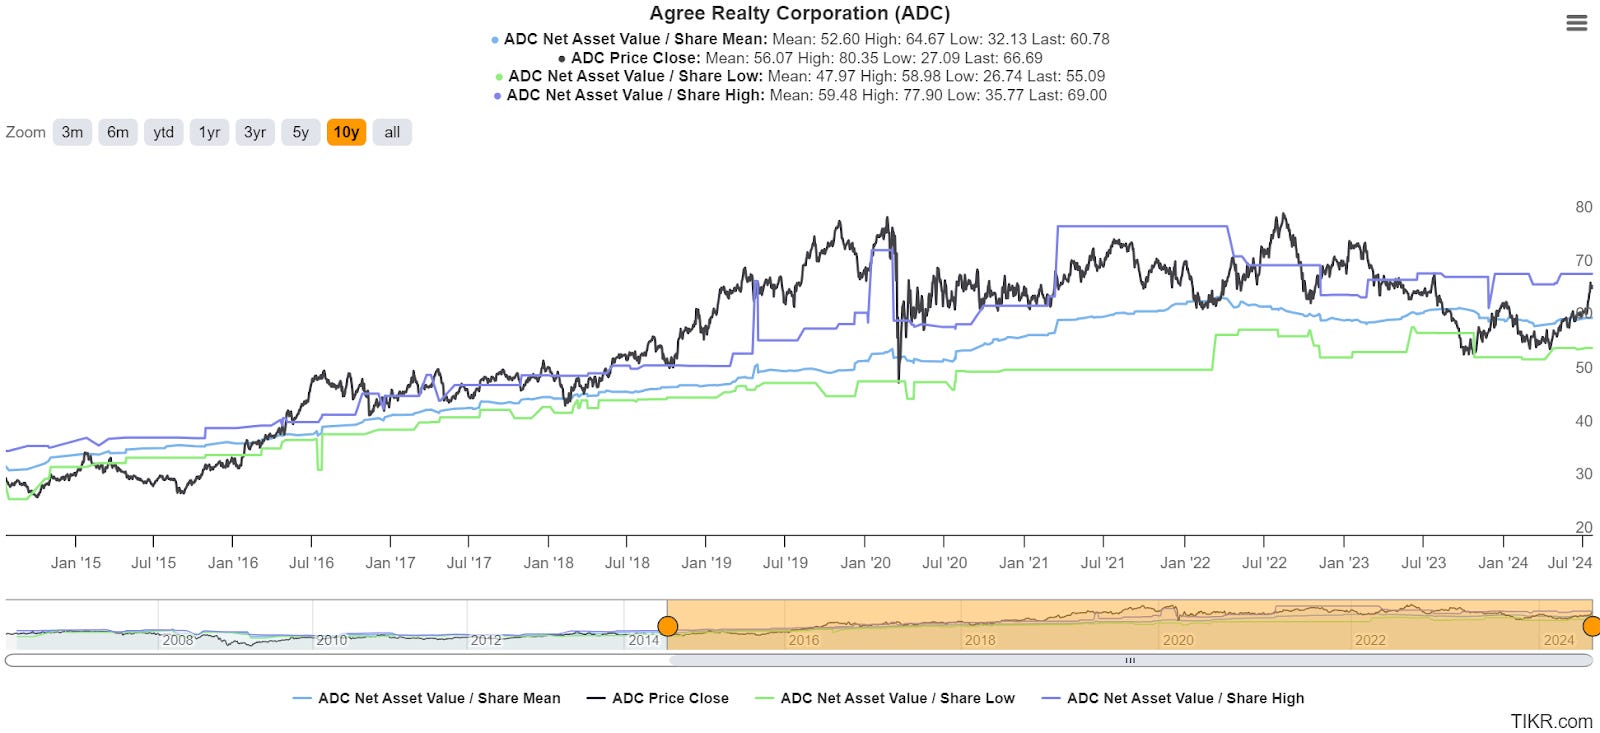
I enhanced the chart above by adding in the highest and lowest estimate for NAV reported on Wall Street:

Source: TIKR.com
You may notice that the gap between the highest and lowest values is material and it changes over time. Sometimes it changes for just a little while.
The really special part here (to me) is the brief jumps higher or lower.
In those cases, we see an analyst (but can’t tell), move their estimated value briefly. Then they bring it back.
Why does that happen? I don’t have the slightest clue.
If you said it’s because they are brilliant, it was either sarcastic or we have very different definitions of brilliant.
Building The Table for NAV or Implied Cap Rates
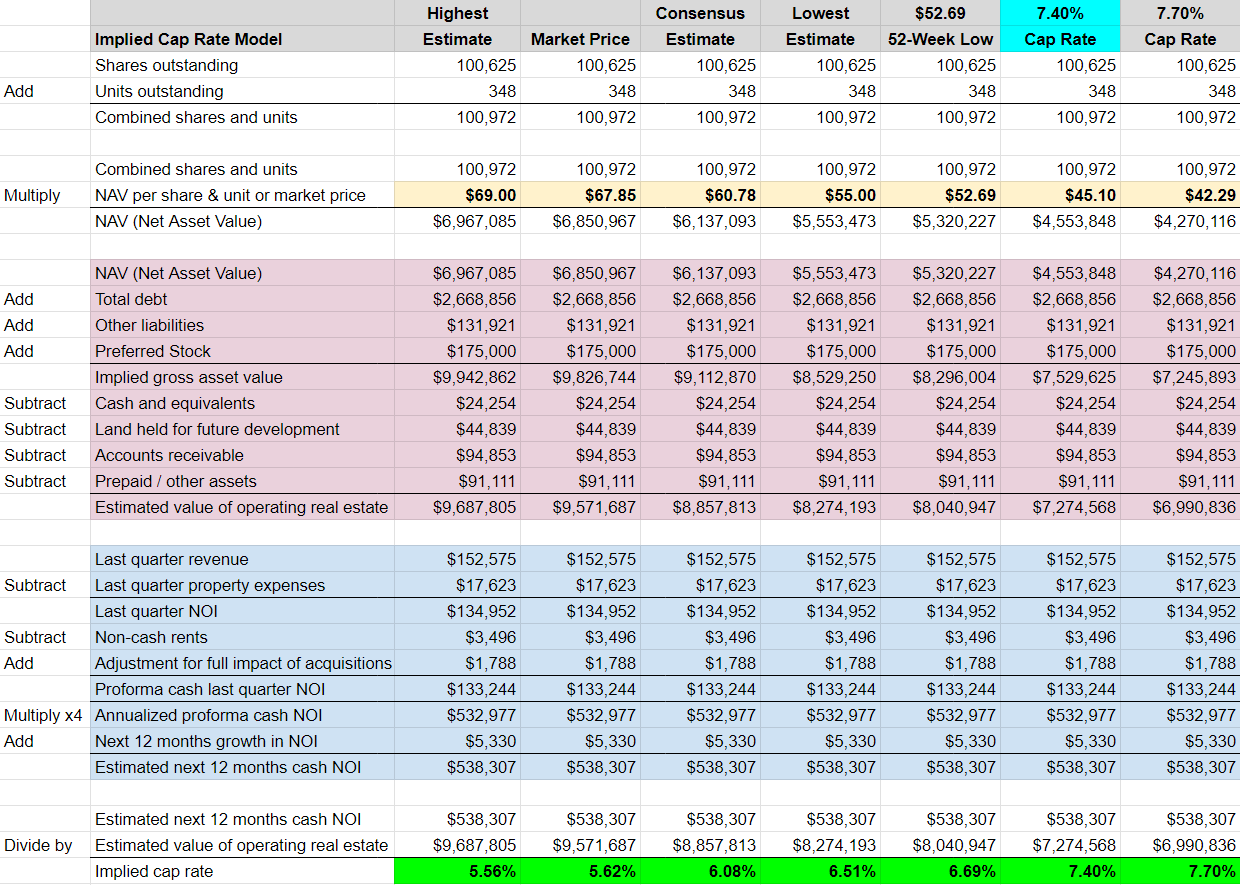
We need to start with either a figure for NAV or a cap rate.
Once we have either one, we can fill in the rest of the numbers from the financial statements to build a model.
We already had the model prepared, so we just updated the numbers.
We could solve for either NAV or the implied cap rate.
The lessons I want to demonstrate here are better demonstrated by starting with the NAV.
We’re going to use several different potential figures for NAV.
The values shown from left to right (and highest NAV to lowest NAV) will represent:
- The highest estimate from Wall Street ($69)
- The market price for shares today ($67.85)
- The consensus estimate from Wall Street ($60.78)
- The lowest estimate from Wall Street $55)
- The 52-week low of $52.69
- The NAV that would align with a 7.4% cash cap rate (based on earnings call).
- The NAV that would align with a 7.7% cap rate (based on average stated cap rate over the last two quarters).
In my opinion, the most reasonable estimate for actual NAV within this batch would be the 7.4% cash cap rate.
That lines up with both:
- Management’s commentary from the earnings call
- My rough estimates for where the cash cap rate should be based on using GAAP rates and adjusting for typical escalators.
Because I believe it is the most reasonable estimate, I set the header for the column to bright blue.
Please enjoy the table:

Note: Directions are on the left to help readers follow the calculations.
By my calculations, actual NAV is probably around $45.10. That is materially lower than any of the estimates from Wall Street.
Could it be a minor difference in which accounts are included? No. That wouldn’t be nearly large enough.
The difference between the consensus estimate at $60.78 and the $45.10 calculated using a 7.4% cash cap rate comes to $1.58 billion.
Tweaking values for assets and liabilities will not create such a large adjustment. No, not even a big tweak.
Note: We could give ADC a benefit for having locked in lower rates on debt. We could essentially mark debts to market. That would mean recording an unrealized gain based on the cheaper debt they locked in. GAAP doesn’t allow it, but a few analysts do it and I respect the adjustment. ADC’s debt is at materially lower rates than the market would offer right now. Therefore, ADC’s value should be enhanced by saving money on interest. However, the value of that adjustment would still be tiny compared to the $1.58 billion gap. The difference would still be around an order of magnitude.
Using Logic
The logical answer at first might be to assume Wall Street must be correct.
However, management reported the GAAP cap rates and stated the cash cap rates as “mid-7s cash” on the earnings call.
Therefore, we must have the right cap rate.
What if I got the calculations wrong?
I went back and verified them.
I verified the individual line items and the sums along the way.
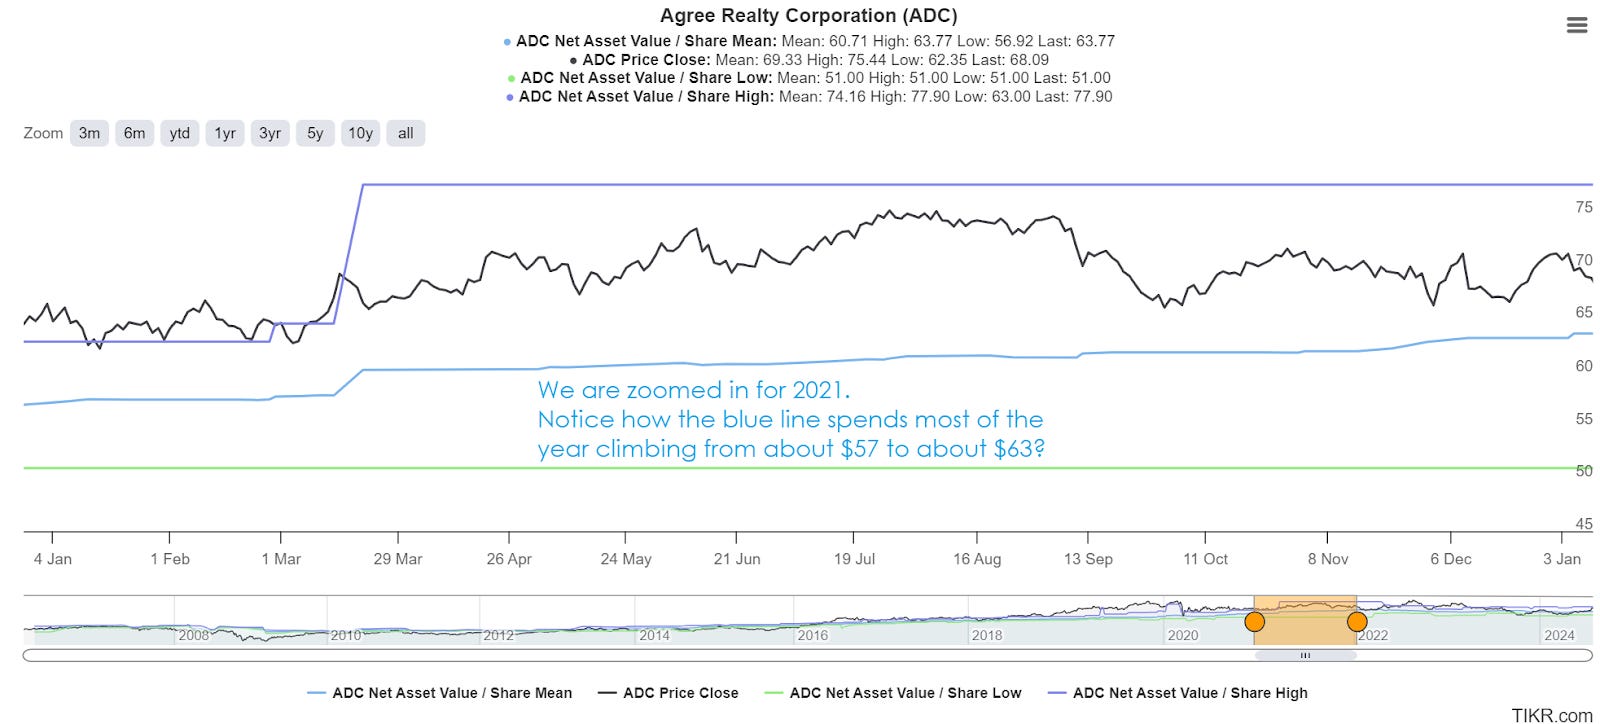
A better explanation comes from the chart showing consensus analyst estimates for NAV over time.
If we focus on 2021, consensus NAV was generally between $57.00 and $63.00 throughout that year:

Source: TIKR.com
You may have noticed that the current consensus estimate of $60.78 happens to fall between $57 and $63. That’s pretty nice for us!
Now we can look at the stated capitalization rates for quarters in 2021 to get a feel for the market at that time:
- Q1 2021: 6.3%, 12.9 years
- Q2 2021: 6.2%, 11.8 years
- Q3 2021: 6.2%, 10.7 years
- Q4 2021: 6.1%, 10.1 years
Longer leases have more periods for escalators. Consequently, the “straight-line” factor inflates cap rates more.
We should expect that the cash cap rates on these deals were 30 to 40 basis points lower.
Therefore, they would’ve started no higher than 6% and ended around 5.8% or even 5.7%.
In 2024, ADC is acquiring properties at a stated cap rate of 7.7% and cash cap rate around 7.4%.
However, it appears the consensus estimate is still using a model calling for cash cap rates around 6.1%.
The simplest explanation is that analysts barely adjusted the cap rates in their models, even though the market is clearly using different cap rates.
That also explains how ADC’s consensus NAV at $60.78 is only down about 6% from an all-time record high of $64.67.
We know cap rates moved because management from several net lease REITs, including ADC, have told us about the difference in cap rates. It wasn’t a secret. It was announced clearly. Yet, somehow, analysts only saw a tiny decrease in consensus NAV.
That’s just a flaw in their model.
It’s an input error that originates somewhere between the monitor and the chair.
Obvious
When net lease REITs have contractual escalators that are often in the 1% to 2% range but end up with AFFO per share growth in the mid single-digit range, you know there has to be something else going on. The most common answer is issuing shares at a premium. In prior periods, growth-focused REITs would also benefit from issuing new debt at lower rates. Since interest rates increased substantially, that became a large headwind instead. Regardless, the premium to NAV was large enough for acquisitions to have a large positive impact.
Outlook
Neutral on ADC. Shares are about the middle of our target range currently.
No adjustment to targets today. May adjust ADC soon along with other net lease REITs, but I haven’t decided on the adjustment.
The strong quarter would favor upgrading targets.
Yet the magnitude of the Wall Street error leaves me conflicted.
On one hand, it demonstrates that shares are actually trading at a much larger premium to real NAV than previously expected. I didn’t expect Wall Street to be that bad at these calculations, though I have seen major investment banks publish reports where a single report contradicts itself on calculations. Do I really want the Strong Buy target to represent such a large premium to our calculated NAV?
On the other hand, this mistake has already persisted for a long time. If it persists indefinitely, ADC maintains a perpetual cost of capital advantage that enables them to constantly grow NAV per share and enhance AFFO per share growth.
That’s an extremely nice competitive advantage to have. It has a significant positive impact on long-term shareholder returns.
On the third hand, because we’re not limited by your notions of human anatomy, drawing too much attention to the errors could cause some Wall Street analysts to correct their models. That would be bad because it could reduce the premium ADC can achieve. Since ADC is using that premium to fuel growth in AFFO per share, correcting analysts could hurt future fundamentals.
Disclosure: No position in ADC. No plans to start a position in the near future.

Member discussion