
AVB Seeks the Sunbelt, ESS Anchors the West
We’re covering two REITs:
- AvalonBay Communities (AVB) $AVB
- Essex Property Trust (ESS) $ESS
We will also have brief comparisons to:
The REIT Forum is a reader-supported publication. To receive new posts and support my work, consider becoming a free or paid subscriber.
- Camden Property Trust (CPT) $CPT
- Mid-America Apartment Communities (MAA) $MAA
- UDR (UDR) $UDR
- Equity Residential (EQR) $EQR
AvalonBay Communities
Projected growth in FFO per share was 1.4%. That may be revised up slightly based on more recent commentary. Revenue growth is coming in slightly higher than projected due to better occupancy and smaller losses on uncollectible lease revenue (deadbeats). Better occupancy encouraged AVB to seek higher leasing spreads. AVB indicated they plan to push out renewal offers at an average 5% increase for March and April 2024. Keep in mind that there is quite a bit of turnover and new leases come in at lower spreads. So actual rental rates would increase materially less than 5%. Expect it to be low single digits after factoring in new leases.
Changing Regions
AVB has been a “gateway apartment REIT” for a long time. That means they were primarily in the “Gateway” markets. These are markets characterized by high rent and barriers to new supply. They are cities almost every American knows about, even if half of them can’t locate them on a map. Six examples: Los Angeles, San Francisco, Seattle, New York, Boston, and Washington, D.C.
As you might recall, those big cities performed vastly worse during the pandemic. Many REITs realized they wanted to also invest in other markets and development within the “Sunbelt” regions boomed.
AVB had two goals for modifying their portfolio:
- More suburban areas (further out from the city)
- More sunbelt
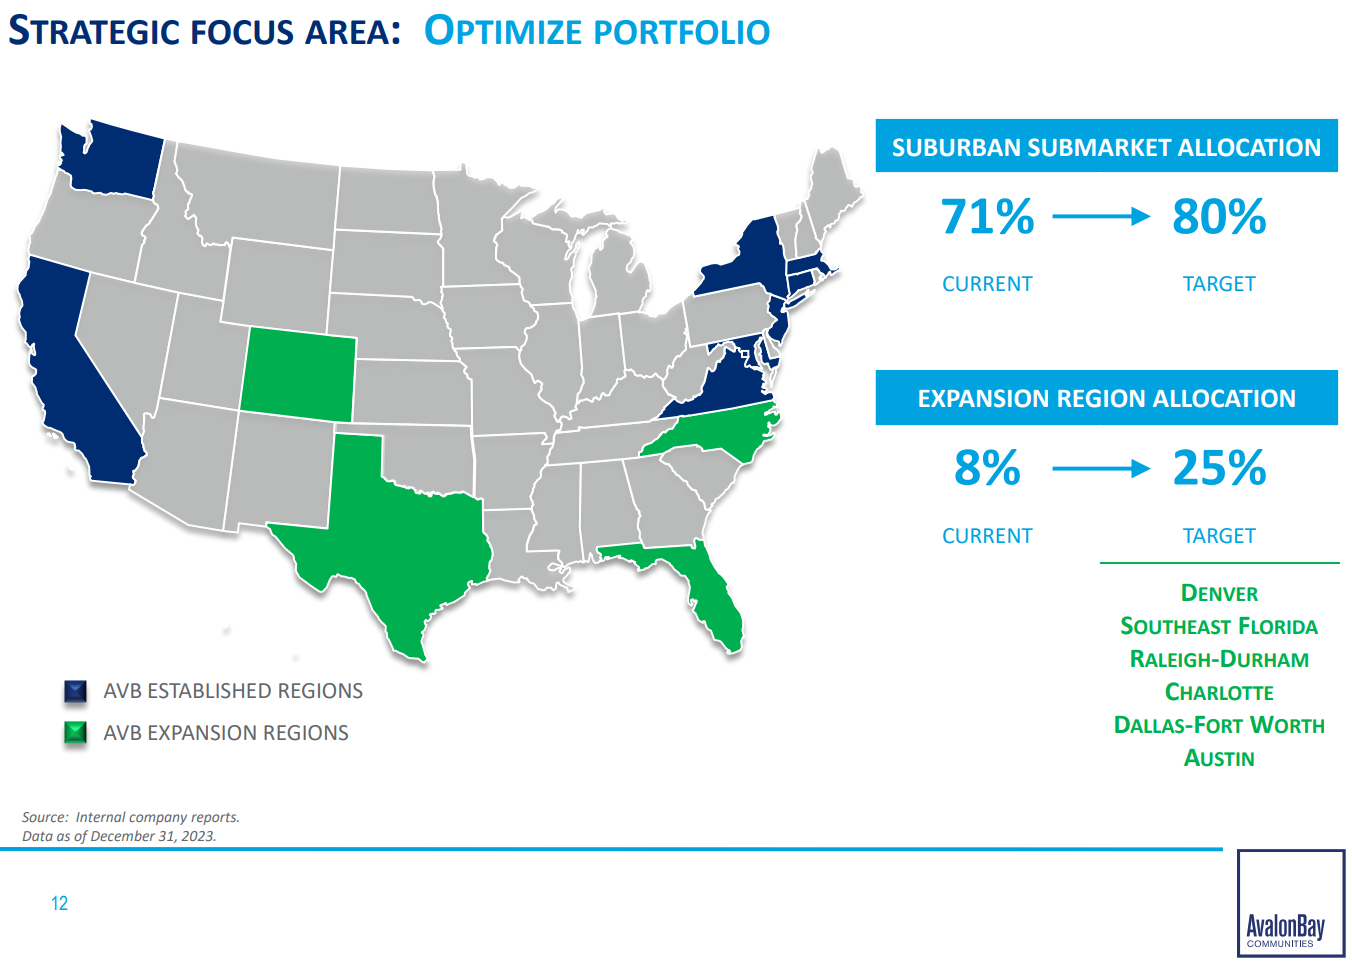
Those shifts are pretty big. To move from 71% to 80% suburban, they will need to sell some locations. Building more suburban locations will help, but getting the percentage that high will need to involve some sales.
The increased focus on the expansion regions could be handled with development.
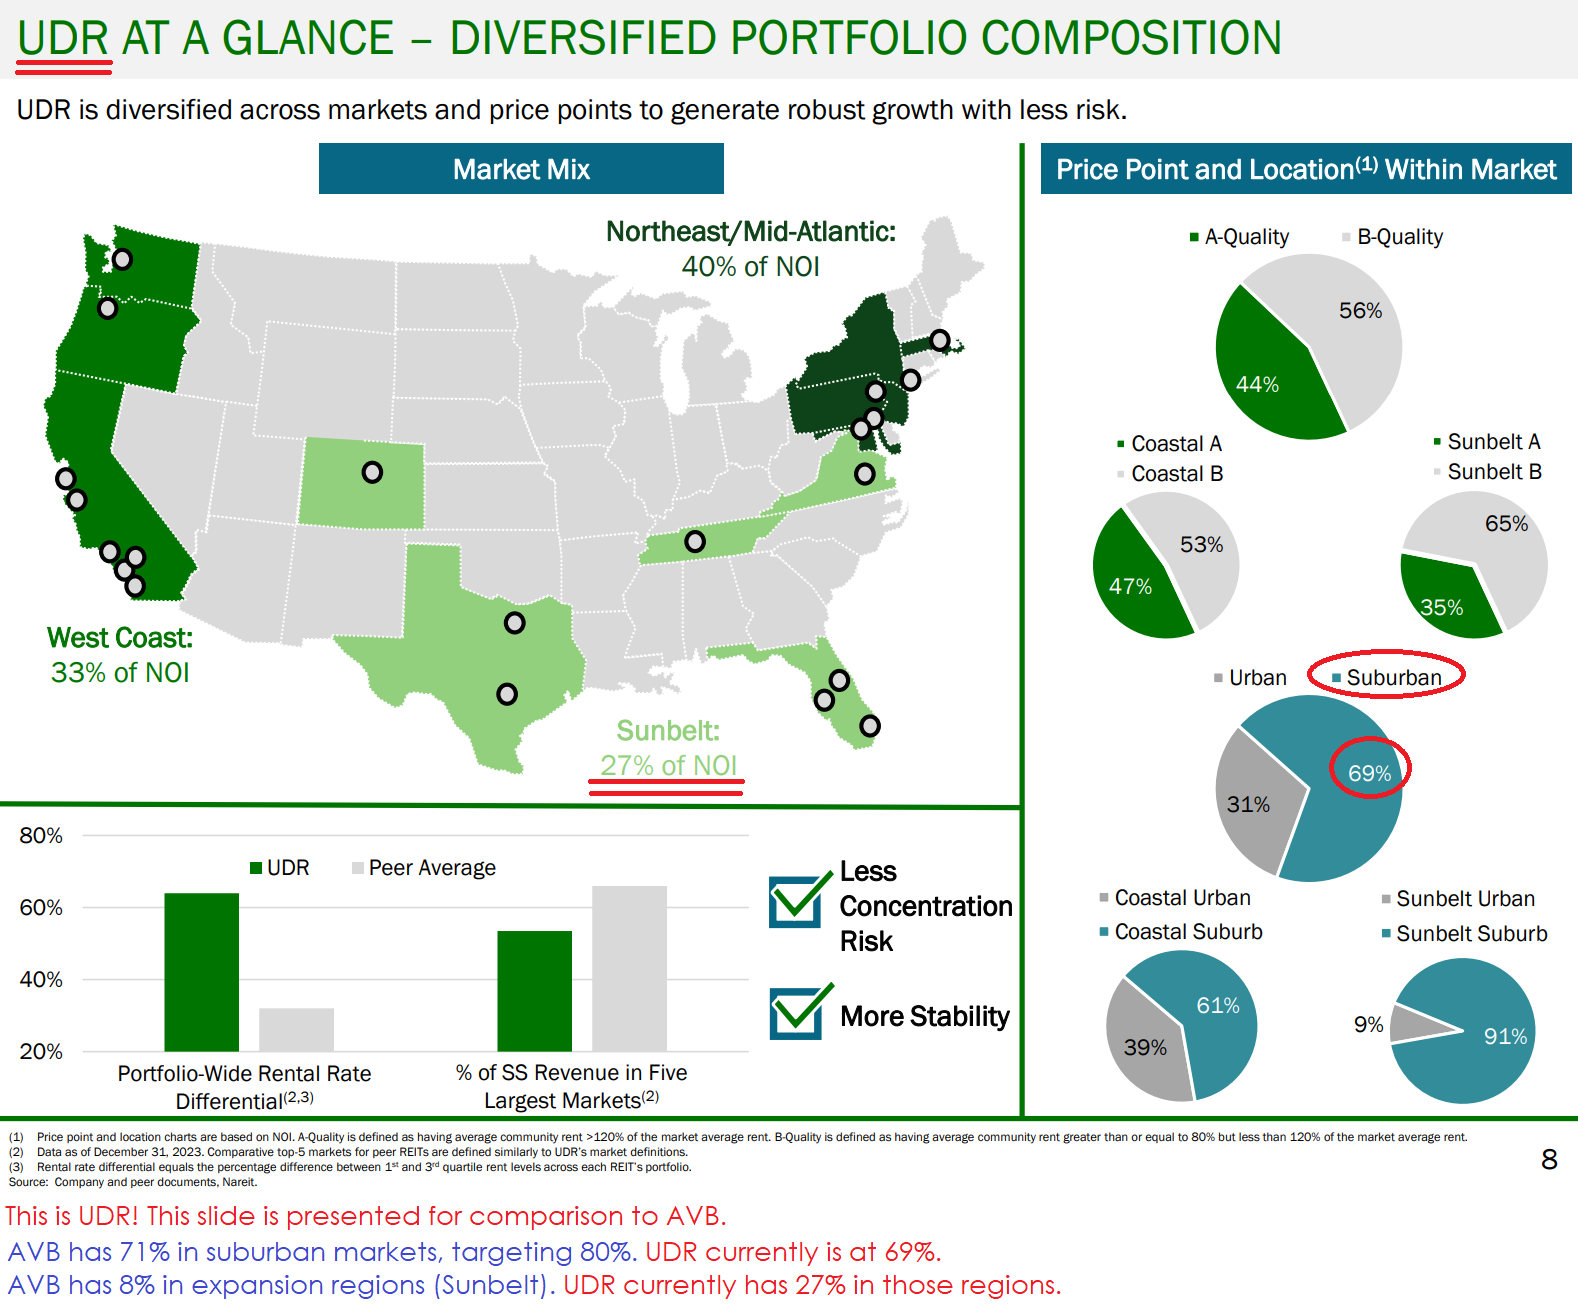
I wanted to toss in a quick comparison to UDR because I think the shift towards sunbelt markets is interesting.
Which Regions Are Performing Better Today?
After the Sunbelt dominated for the last few years, the volume of new supply is creating a major headwind. That’s why Camden Property Trust and Mid-America Apartments have been weaker.
We predicted this boom years ago, though the impact on share prices took longer to play out than expected.
This chart really emphasizes the differences in the amount of development activity by area:
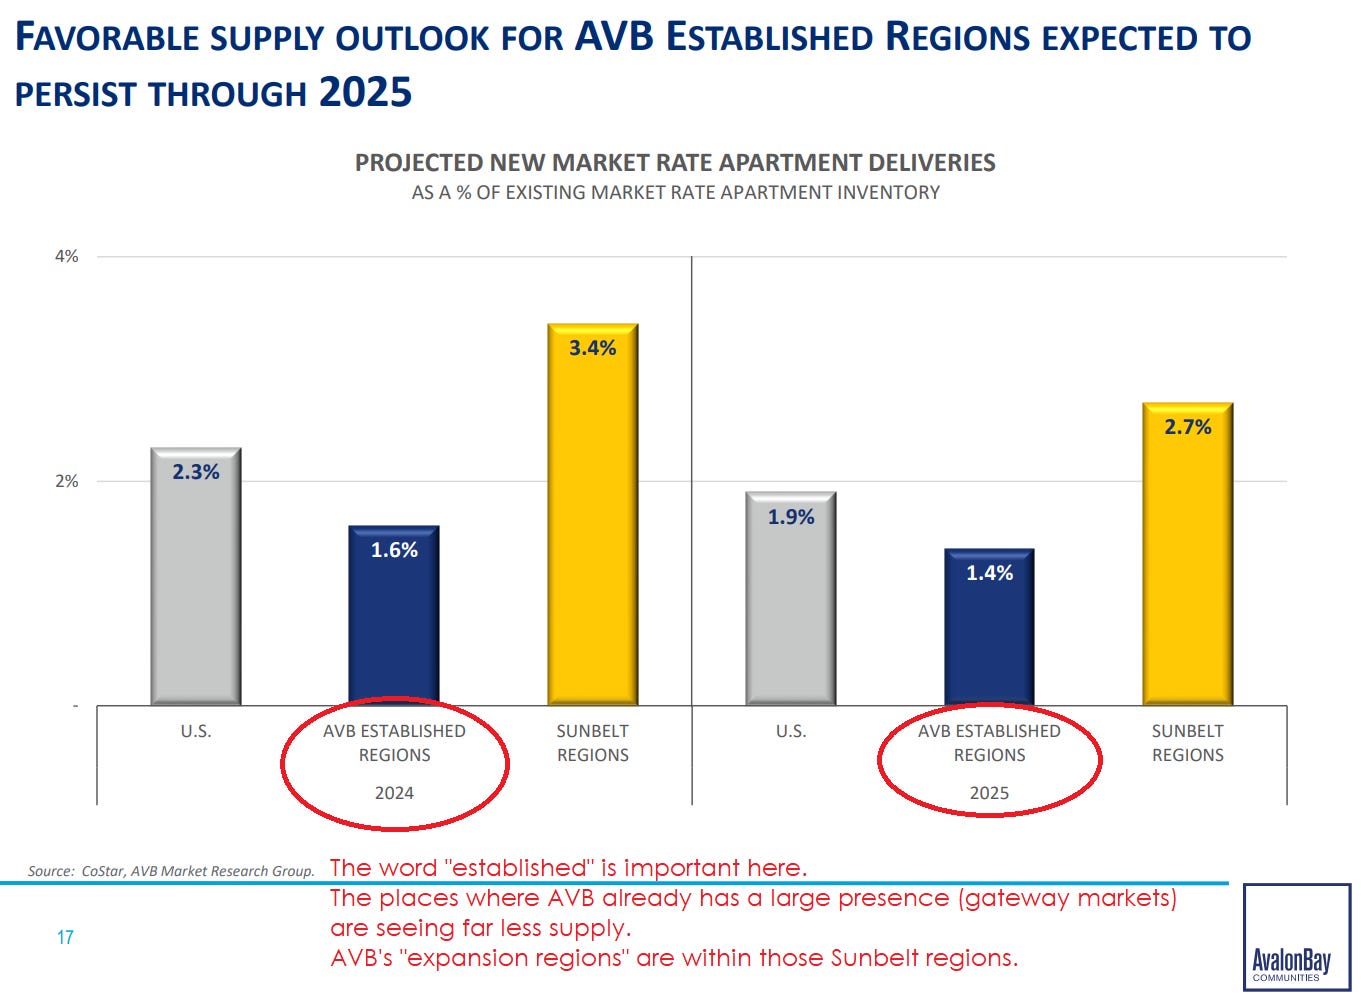
Because major players like AVB decided to go develop assets in the Sunbelt region, we’re seeing a boom in supply for those regions. Meanwhile, developers were not focused on the gateway markets, which are AVB’s established regions.
Management’s Guidance
- Guidance for Core FFO per share growth: 1.4%
- Guidance for SS NOI (Same Store Net Operating Income) growth: 1.25%
Overall Impression
I’m inclined to say my view on earnings and guidance was positive. AVB’s guidance is better than average for the sector. They also performed quite well on FFO per share over the last two years. However, there was nothing really shocking here. No big surprises to drive shares higher.
Essex Property Trust
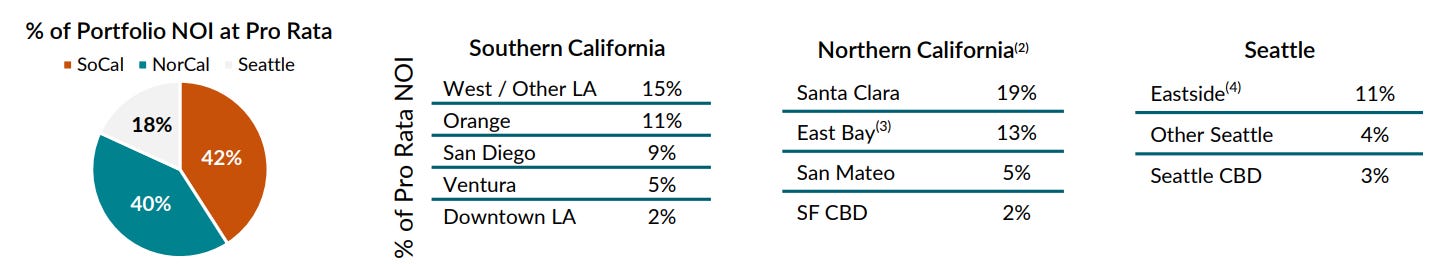
Essex Property Trust is the West Coast apartment REIT.
They enjoyed outstanding growth over the last 30 years.
They created higher returns, higher FFO per share growth, higher net operating income growth, and higher dividend growth. However, that requires looking at a pretty long period.
Going back to 2007 (just before the Great Financial Crisis), ESS was the king.
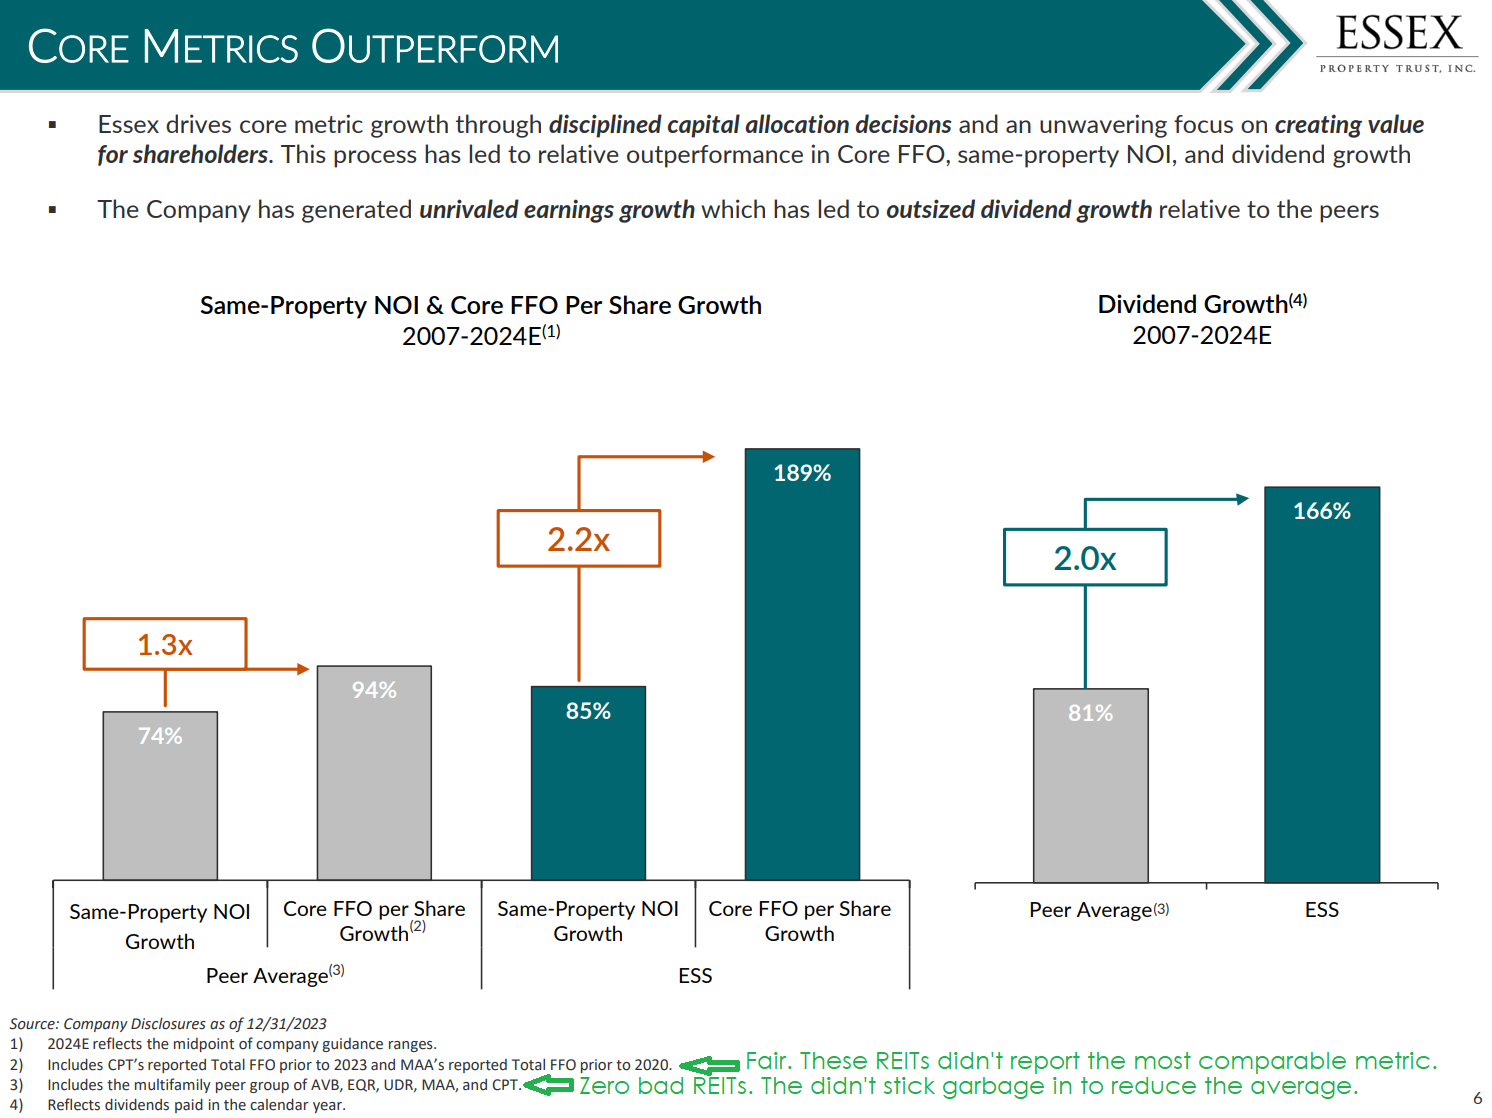
While ESS still has superior performance since 2007, they don’t have superior performance over the last few years.
Following the pandemic, the “work from home” initiative involved more people moving further from the office. Some of those people were moving out of California.
Contrary to some claims, there are still people who live in California! However, there’s still been a decline relative to other parts of the country.
That isn’t just work-from-home. It also includes retirees moving to states with zero income tax before pulling money out of their traditional (taxed at withdrawal) retirement accounts.
The total impact is actually pretty small (compared to the stories you may see). However, it is big enough to have an impact on rent and property values relative to the rest of the country.
Management’s Guidance
- Guidance for Core FFO per share growth: 0.0% (not a typo)
- Guidance for SS NOI (Same Store Net Operating Income) growth: 0.6%
Completed Topics and Upcoming Topics for Apartment REITs
Completed:
- CPT Update
- MAA Update
- ESS and AVB Update (you’re reading it).
Upcoming:
- EQR and UDR Update
- Sector Target Updates
I’ll have some comparison charts in the sector update I find really interesting.
Relative Performance Chart Preview
I built some new charts a few months ago for demonstrating the change in key metrics over time.
After building those charts, I decided (as usual) that they were not quite meeting my goals.
Therefore, I designed a new layout that I think does a better job of capturing relative performance.
Rather than a chart, this time it is presented as a spreadsheet.
We’re showing the Core FFO per share growth for each year.
Each year has 5 values:
- The first 4 values represent the annual guidance at the start of each quarter:
- The final value represents the annual result.
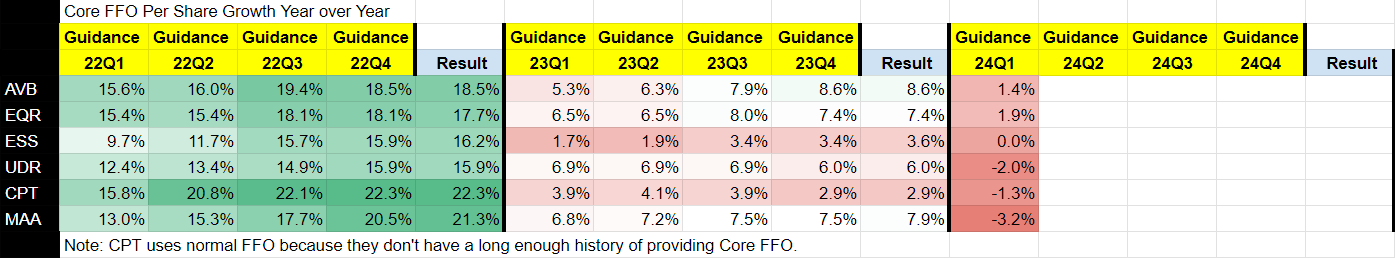
The sheet is color-coded on a relative basis. Green is strong. Red is weak.
I’ve included multiple periods because it creates a much better feeling for the year-over-year trends throughout the sector.
You can see how Core FFO per share growth:
- was extremely strong in 2022
- fell substantially in 2023 and
- declined further in 2024 (projected).
The decline is due to a combination of weaker same property NOI growth and higher interest rates.
Let me know if there are any questions about it. I think we’ve got a nice layout, but there may be some confusing elements that I’m just looking past.
Once we are confident that the layout works for us, we may increase the amount of data.
Next Article
I am already reviewing the short thesis Hindenburg published on Equinix (EQIX) $EQIX.
The report is extremely long (nearly 11,000 words including disclaimers) and there are several claims to check into.
Thankfully, it appears they did a good job of documenting sources. If the sources are documented as well as it appears, I’ll be quite happy.
Often when checking into a short thesis, the sources are poorly defined and not linked. Consequently, the simple act of extensively linking sources adds credibility.
It won’t be feasible to check every word in the report, but we’ll send an article out to our paid members with our findings.
The REIT Forum is a reader-supported publication. To receive new posts and support my work, consider becoming a free or paid subscriber.
Member discussion