
12% Dividend Yields Are Not Enough
We’re diving into a batch of stocks offering eye-popping yields—12% or higher. If you’re familiar with mortgage REITs or BDCs, you know juicy yields are the norm, but today we’re zeroing in on the highest-yielding mortgage REIT sector: agency mortgage REITs. Not only are we running a quick comparison, but we’re also taking a step back to check the pulse of the sector.
52-Week Highs
A bunch of agency mortgage REITs are strutting near their 52-week highs. That’s quite the comeback, considering one of them set a new low in December 2024 and another was paving the way lower in January 2025.
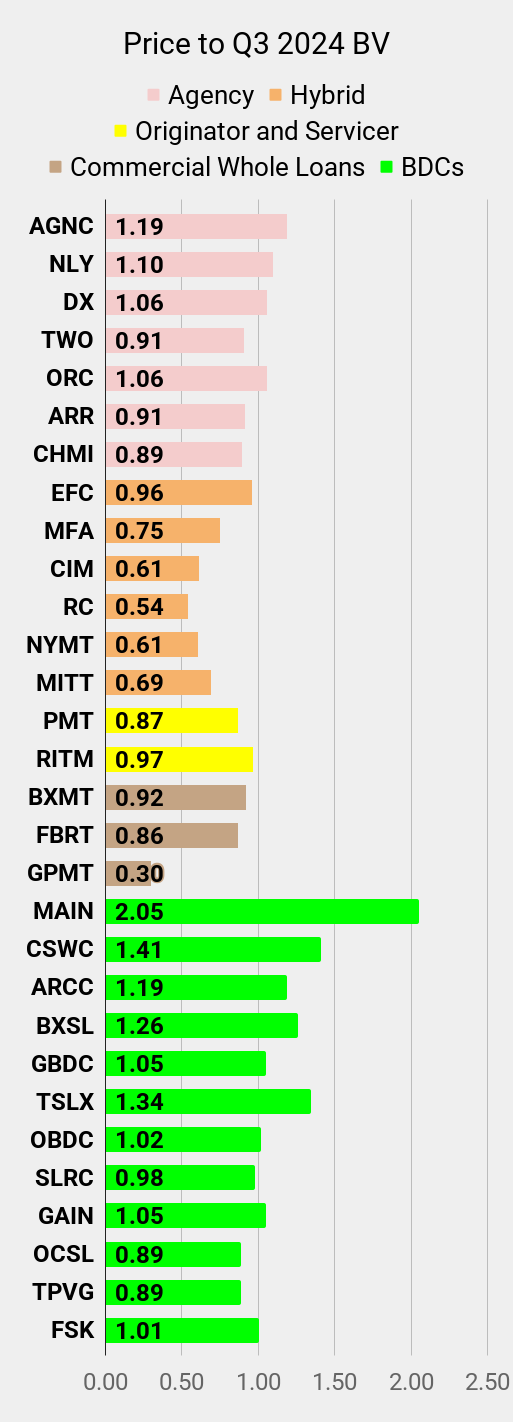
As usual, our charts use price-to-trailing book value. Some REITs haven’t gotten around to reporting Q4 2024 book values, so we’re sticking with Q3 2024 for consistency.
Now, here’s the deal: our charts (for this series) use price-to-trailing book value, and since some REITs are still keeping their Q4 2024 numbers under wraps, we’re rolling with Q3 2024 figures for consistency. Could we Frankenstein together Q3 and Q4 book values? Technically, sure—but that would be a hot mess. Some of these REITs move in sync, but mashing up different reporting periods would be like comparing apples to slightly newer apples. No, that’s a stupid analogy. Just trust me? You don’t want to go mixing the numbers.
For our own trade modeling, we don’t sit around twiddling our thumbs, waiting for official numbers—we update our book value estimates weekly. Well, most weeks. It’s vastly more often than the guys on Wall Street. But for quick analysis? Or should I say articles that will also go out to the public? Then trailing values do the job.
What do agency mortgage REITs do? They buy agency MBS and then they hedge part of their interest rate risk. They hope to generate net interest income to pay shareholders. That's the short version.
AGNC: Big, Expensive, and Still Too Popular
AGNC Investment Corp. is the second-largest mortgage REIT out there. Among agency mortgage REITs, only two have a market cap north of $2 billion.
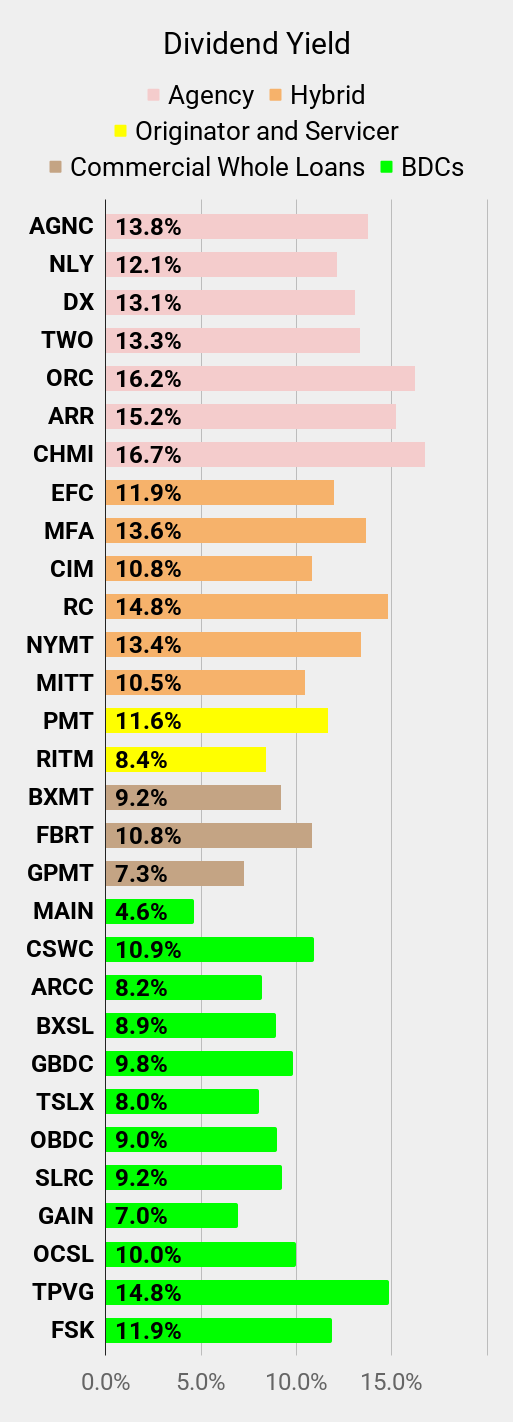
But AGNC isn’t just big—it’s pricey. Investors are paying a premium to book value so high it could cover a year’s worth of dividends. Who wants to do that? That’s like buying a $10 burger for $15 just because the sign says “gourmet.” The 13.7% dividend yield looks nice, and the earnings seem even higher, but mortgage REIT earnings can be sneaky. Thanks to historical amortized costs and hedge accounting quirks, they can lead investors down a misleading path.
NLY: Overpriced, but Less Absurd
Annaly Capital Management is the king of the mortgage REITs—the biggest name in the game. Like AGNC, it trades at a noticeable premium to our estimated book value. As of 2/19/2025, we pegged it around 1.09x book. That’s not as ridiculous as AGNC, but it’s still too high for comfort.
The 12.0% dividend yield is the lowest among agency REITs we’re covering today. Is NLY a bad stock? Not at all. Would I own it at a lower price? Absolutely. Would I be thrilled to buy it at this price? Nope.
DX: Above Book Value, But Not As Much
Dynex Capital is the mortgage REIT I actually like. Not the price, but I like the REIT. Management tends to play it safer than many other REITs. While it’s smaller than AGNC and NLY, it’s outperformed plenty of its peers over time.
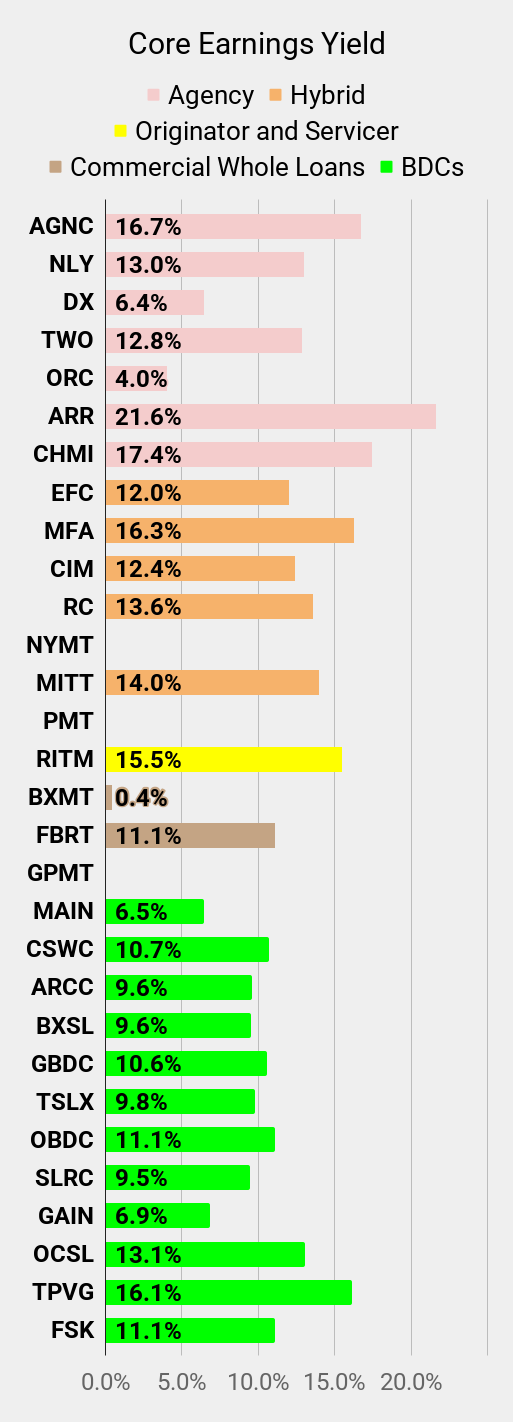
Yes, DX also trades at a premium, though not as high as AGNC or NLY. Some investors scoff at DX because its earnings yield looks low—but that’s another accounting illusion. DX’s management has gone out of their way to explain how Core EPS distorts the reality of the business. When you see AGNC trading at 6x earnings while DX sits at 15.6x earnings, you should know that the values aren’t really comparable. I’m not jumping to pay a premium to book value, but I want investors to understand that DX has a better valuation than AGNC despite the difference in earnings multiples.
TWO: Finally a Discount, But Not Enough
Two Harbors is the cheapest name on our list (relative to book value), sitting around 0.91x book at the time of writing. That sounds great, right? Not so fast.
Book values shift daily as bond prices and hedge values fluctuate. And guess what? Share prices move, too. Sure, it’s nice to see a discount, but 22% rally off its January lows makes this one a bit too pricey for us to take a bite.
ARR: When Management Makes The Wrong Moves—For a Decade
ARMOUR Residential REIT insists on shouting its name in all caps, but let’s be honest—there’s nothing to be excited about. It’s trading around book value, but is that a fair price? No. It’s too high.
Why? Because ARR’s management track record is brutal. They’ve managed the portfolio so poorly over the years that if they had just bought an MBS ETF (MBB) and called it a day, shareholders would’ve been better off. Seriously. Imagine doing your job so badly for a decade that doing nothing would’ve been better for shareholders. Now imagine getting paid millions to do it.
ORC: A Masterclass in Disasters
Orchid Island Capital trades at a premium to book value. Why? No idea. If you like watching stock prices sink, ORC’s been putting on a masterclass for years.
Does ORC have some revolutionary strategy? Nope. They buy agency MBS, slap on some hedges, pay out a fat dividend, and—more often than not—announce that book value went down. Every now and then, they toss in a dividend cut for variety. It’s practically tradition at this point.
CHMI: Small, but Still Trying (Poorly)
Cherry Hill Mortgage pulled off a monster rally. It’s the smallest of the agency mortgage REITs now, though it wasn’t always that way. Years of high dividends and shrinking book value took care of that.
Shares are currently trading just below our estimate of book value. Could CHMI issue more shares? Possibly. Would that be dilutive? Almost certainly. But when a mortgage REIT gets too small, overhead costs become harder to manage. Issuing shares keeps the machine running—even if it’s not ideal for existing investors.
CHMI does one thing a little differently: it includes MSRs (mortgage servicing rights) in its portfolio. This can be a way to hedge book value, but let’s not get too excited. Some REITs have used MSRs brilliantly to boost performance. CHMI? Not so much.
Final Thoughts
The agency mortgage REITs can feel attractive due to the high yields. The wider spread between agency MBS and Treasury rates (due to high implied volatility) also looks pretty good. Book values could increase if we see a sharp decrease in interest rate volatility. That could happen, but we don’t want to bet on hypothetical best-case scenarios. When we put our cash on the line, we want the deck stacked in our favor. Because book values could go up, but we could also see another sharp move in interest rates that would send them lower.
Why does book value matter to an income investor? Because over the long-term the level of dividends a mortgage REIT can support are a function of book value. The book value gives us a feel for how much capital management has available for leveraging into their portfolio structure. If they could earn 25% per year, the share price would be through the roof and they would be able to issue new shares at higher prices and invest that capital to earn 25% again. It would be amazing. Unfortunately, it’s also a fantasy.
That’s why we come to this sector looking for opportunities to trade on swings in price-to-book ratio. We don’t need the REIT to generate outstanding returns. We’re simply looking for the price-to-book ratio to trend towards historically normal levels. Today, investors buying into the sector really don’t want to see price-to-book ratios trending towards their normal levels. That would mean lower prices.
Overall, I find the superior spreads between MBS and Treasury rates more appealing. The sector is arguably on better footing than it usually was over the last decade. However, agency mortgage REIT share prices already reflect that.
If you’re looking for a high yield, tread carefully. Not all dividends are created equal.
Note: For our paid members, our Google Sheets provide dramatically more detail on current valuation and ratings.
REIT Forum Stock List
The charts provide comparisons several preferred shares as well as the following common shares:
- Residential Agency mREITs: (AGNC), (NLY), (DX), (TWO), (ORC), (ARR), (CHMI)
- Residential Hybrid mREITs: (RC), (EFC), (CIM), (NYMT), (MFA), (MITT)
- Residential Originator and Servicer mREITs: (PMT), (RITM)
- Commercial mREITs: (BXMT), (FBRT), (GPMT)
- BDCs: (MAIN), (CSWC), (ARCC), (BXSL), (GBDC), (TSLX), (OBDC), (OCSL), (SLRC), (GAIN), (TPVG), (FSK)
Charts
We prepared several charts for readers:
- Common shares: Price to Q3 2024 Book Value (because some companies have not reported Q4 2024 results)
- Common shares: Dividend Yield
- Common shares: Core Earnings Yield
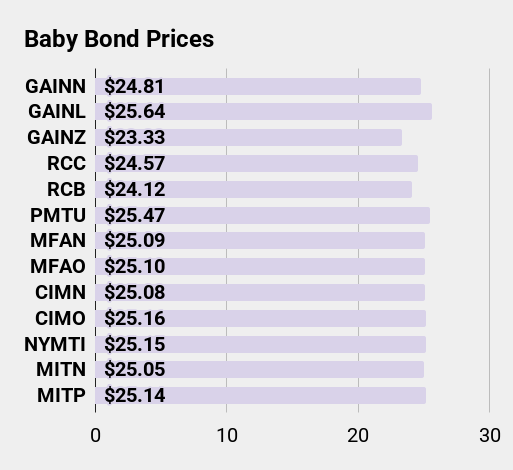
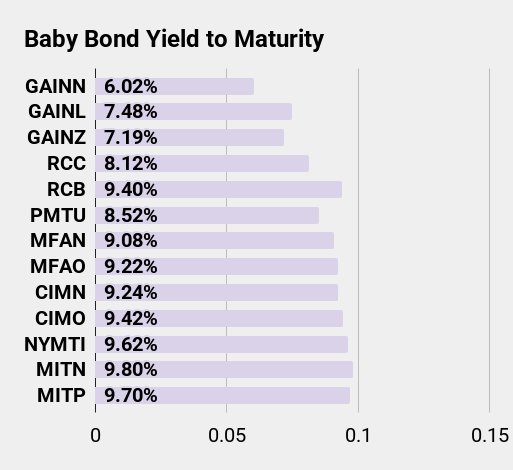
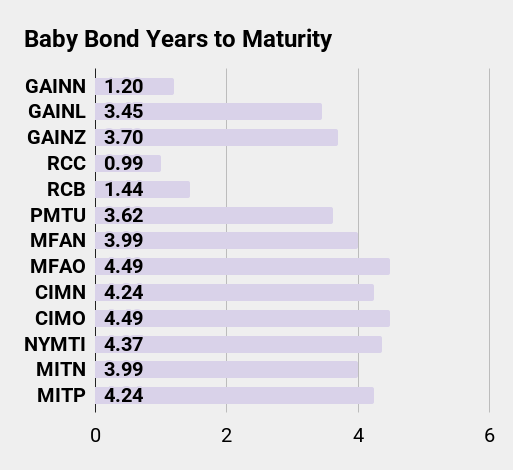
- Baby bonds: Prices
- Baby bonds: Years to maturity
- Baby bonds: Yield to maturity
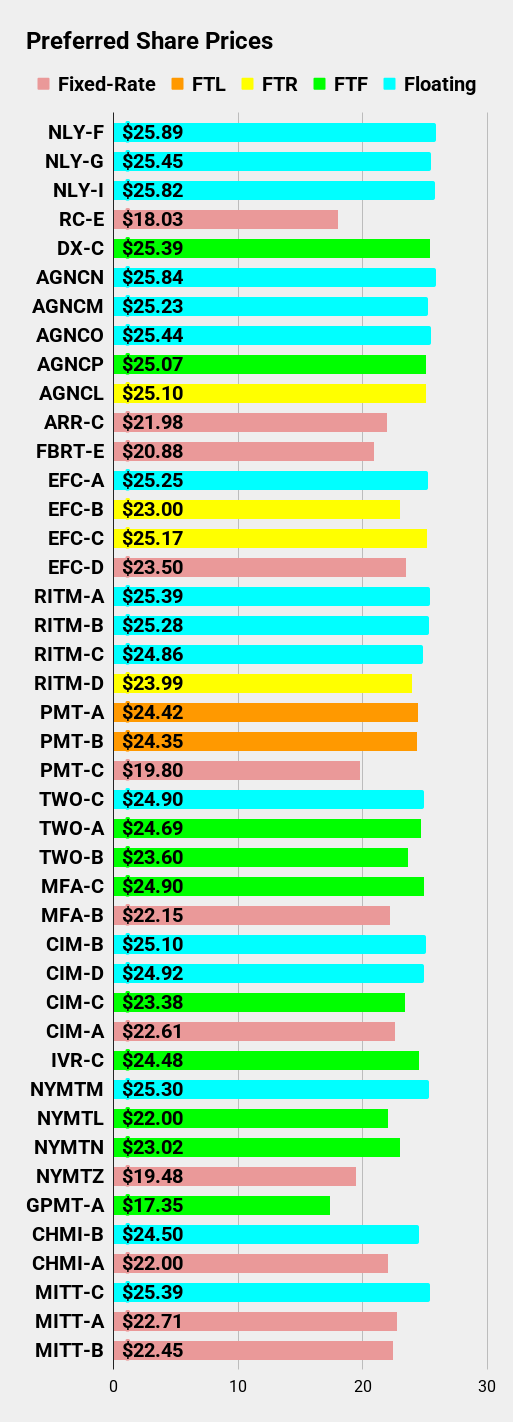
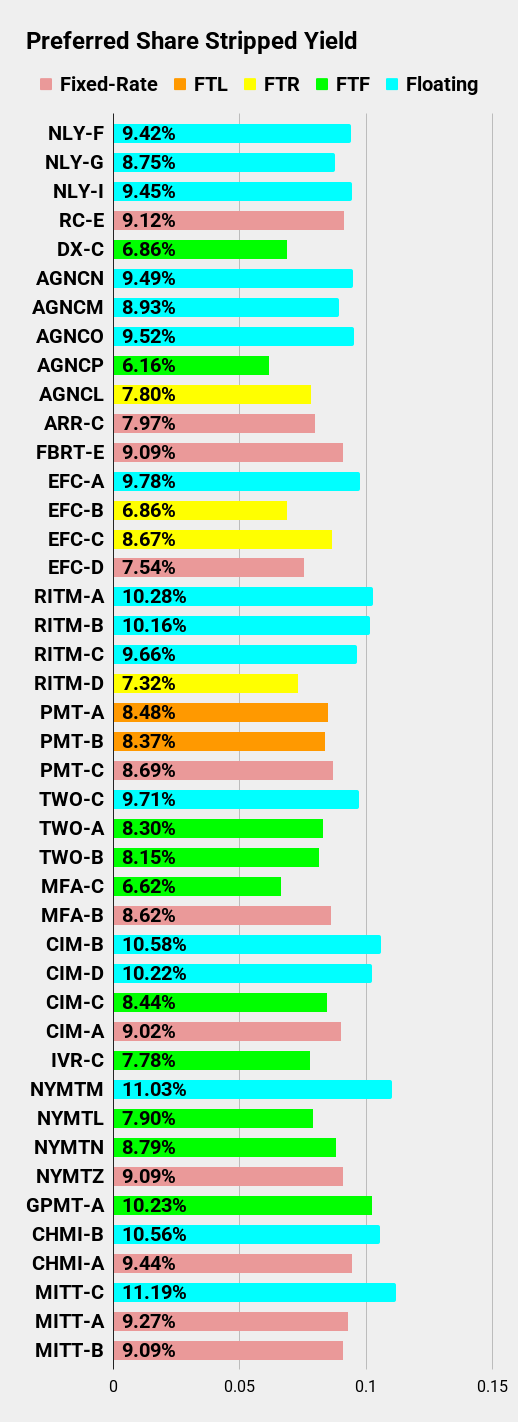
- Preferred shares: Prices
- Preferred shares: Stripped yield
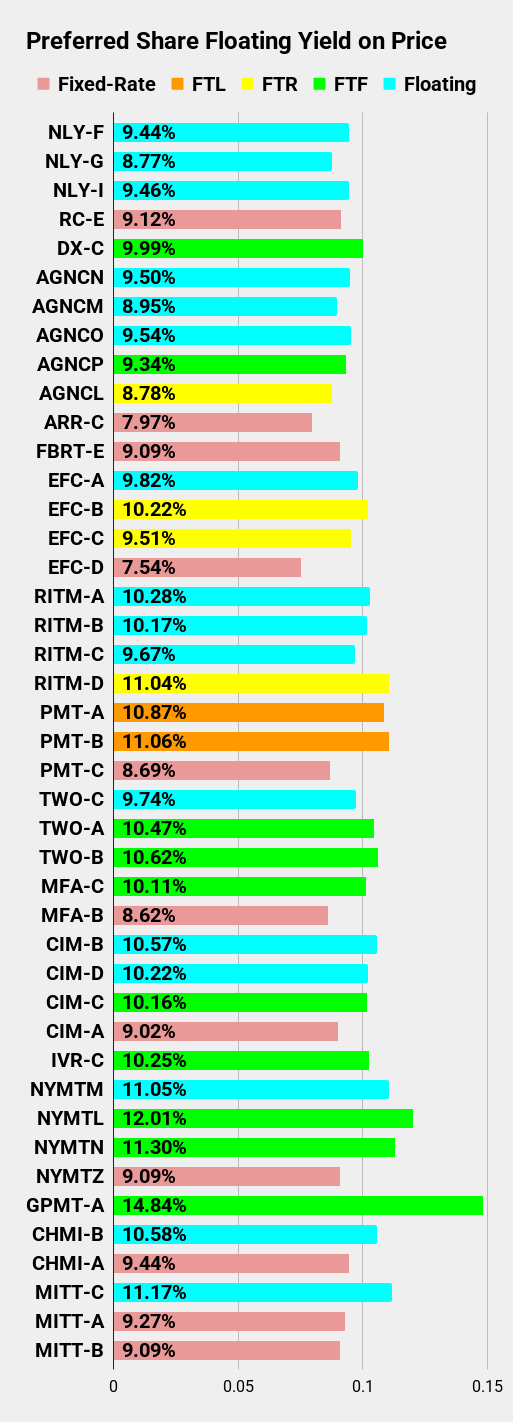
- Preferred shares: Floating yield on price
If you have a hard time seeing any chart, you're probably on a phone. No worries, our site works great with mobile. Just tap the chart once then tap directly on it again. The first tap brings up the image and the second will zoom you in dramatically. After that you can navigate by scrolling around. You can touch the dark space on the side to close out of the image. Of course, if you're on a computer, you probably won't need to zoom at all.
You can see those charts below:
Suggestions?
This article previews some general themes I may write about in the future.
The layout for this article is an updated version of a series I used to call "Quick and Dirty Discounts to Book Value". It was a series I published publicly on Seeking Alpha for many years. Publicly? Well, that's how I thought of it. Eventually it went behind the "Premium" paywall, much to my displeasure.
Here are some of the changes I made:
- Removed some repetitive sections while we rework them (to be shorter and more useful).
- Charts were redesigned to include more shares within the same chart.
- Colors on the charts were changed to support a wider variety of monitors.
I did a bit of testing with this layout. The one thing it doesn't do very well is send the entire article out via email. The abundance of links for the various tickers and the huge run into issues.
Feedback from readers is more than welcome. If you got the email alert that this article was posted, then you have an account here. All you need to remember is which email address had the alert. You can use that to sign in and post a comment below.
Disclosure: Long RITM-D, DX-C, EFC-B, RITM, SLRC, GPMT, RC, GBDC
Member discussion